
|
|||||
|
 | |
| |
| |
| |
| |
| |
|
Gene: RCN3 |
Gene summary for RCN3 |
| Gene information | Species | Human | Gene symbol | RCN3 | Gene ID | 57333 |
| Gene name | reticulocalbin 3 | |
| Gene Alias | RLP49 | |
| Cytomap | 19q13.33 | |
| Gene Type | protein-coding | GO ID | GO:0001894 | UniProtAcc | Q96D15 |
Top |
Malignant transformation analysis |
| Identification of the aberrant gene expression in precancerous and cancerous lesions by comparing the gene expression of stem-like cells in diseased tissues with normal stem cells |
| Entrez ID | Symbol | Replicates | Species | Organ | Tissue | Adj P-value | Log2FC | Malignancy |
| 57333 | RCN3 | LZE22T | Human | Esophagus | ESCC | 5.50e-06 | 4.43e-01 | 0.068 |
| 57333 | RCN3 | P2T-E | Human | Esophagus | ESCC | 6.02e-05 | 3.15e-02 | 0.1177 |
| 57333 | RCN3 | P4T-E | Human | Esophagus | ESCC | 6.44e-14 | 7.89e-01 | 0.1323 |
| 57333 | RCN3 | P5T-E | Human | Esophagus | ESCC | 7.10e-05 | 4.40e-01 | 0.1327 |
| 57333 | RCN3 | P8T-E | Human | Esophagus | ESCC | 9.19e-18 | 3.90e-01 | 0.0889 |
| 57333 | RCN3 | P9T-E | Human | Esophagus | ESCC | 9.99e-10 | 6.75e-01 | 0.1131 |
| 57333 | RCN3 | P11T-E | Human | Esophagus | ESCC | 3.03e-28 | 8.24e-01 | 0.1426 |
| 57333 | RCN3 | P12T-E | Human | Esophagus | ESCC | 6.40e-34 | 6.17e-01 | 0.1122 |
| 57333 | RCN3 | P15T-E | Human | Esophagus | ESCC | 4.47e-02 | 3.44e-01 | 0.1149 |
| 57333 | RCN3 | P17T-E | Human | Esophagus | ESCC | 1.29e-03 | 2.92e-01 | 0.1278 |
| 57333 | RCN3 | P19T-E | Human | Esophagus | ESCC | 8.13e-13 | 1.14e+00 | 0.1662 |
| 57333 | RCN3 | P22T-E | Human | Esophagus | ESCC | 4.20e-04 | 3.92e-01 | 0.1236 |
| 57333 | RCN3 | P23T-E | Human | Esophagus | ESCC | 5.99e-13 | 4.63e-01 | 0.108 |
| 57333 | RCN3 | P24T-E | Human | Esophagus | ESCC | 2.05e-04 | 3.56e-01 | 0.1287 |
| 57333 | RCN3 | P26T-E | Human | Esophagus | ESCC | 1.67e-27 | 5.11e-01 | 0.1276 |
| 57333 | RCN3 | P27T-E | Human | Esophagus | ESCC | 1.29e-06 | 1.64e-01 | 0.1055 |
| 57333 | RCN3 | P32T-E | Human | Esophagus | ESCC | 2.05e-24 | 7.05e-01 | 0.1666 |
| 57333 | RCN3 | P37T-E | Human | Esophagus | ESCC | 1.54e-24 | 7.57e-01 | 0.1371 |
| 57333 | RCN3 | P38T-E | Human | Esophagus | ESCC | 2.33e-05 | 1.53e-01 | 0.127 |
| 57333 | RCN3 | P42T-E | Human | Esophagus | ESCC | 1.18e-09 | 5.78e-01 | 0.1175 |
| Page: 1 2 3 |
| Tissue | Expression Dynamics | Abbreviation |
| Esophagus | 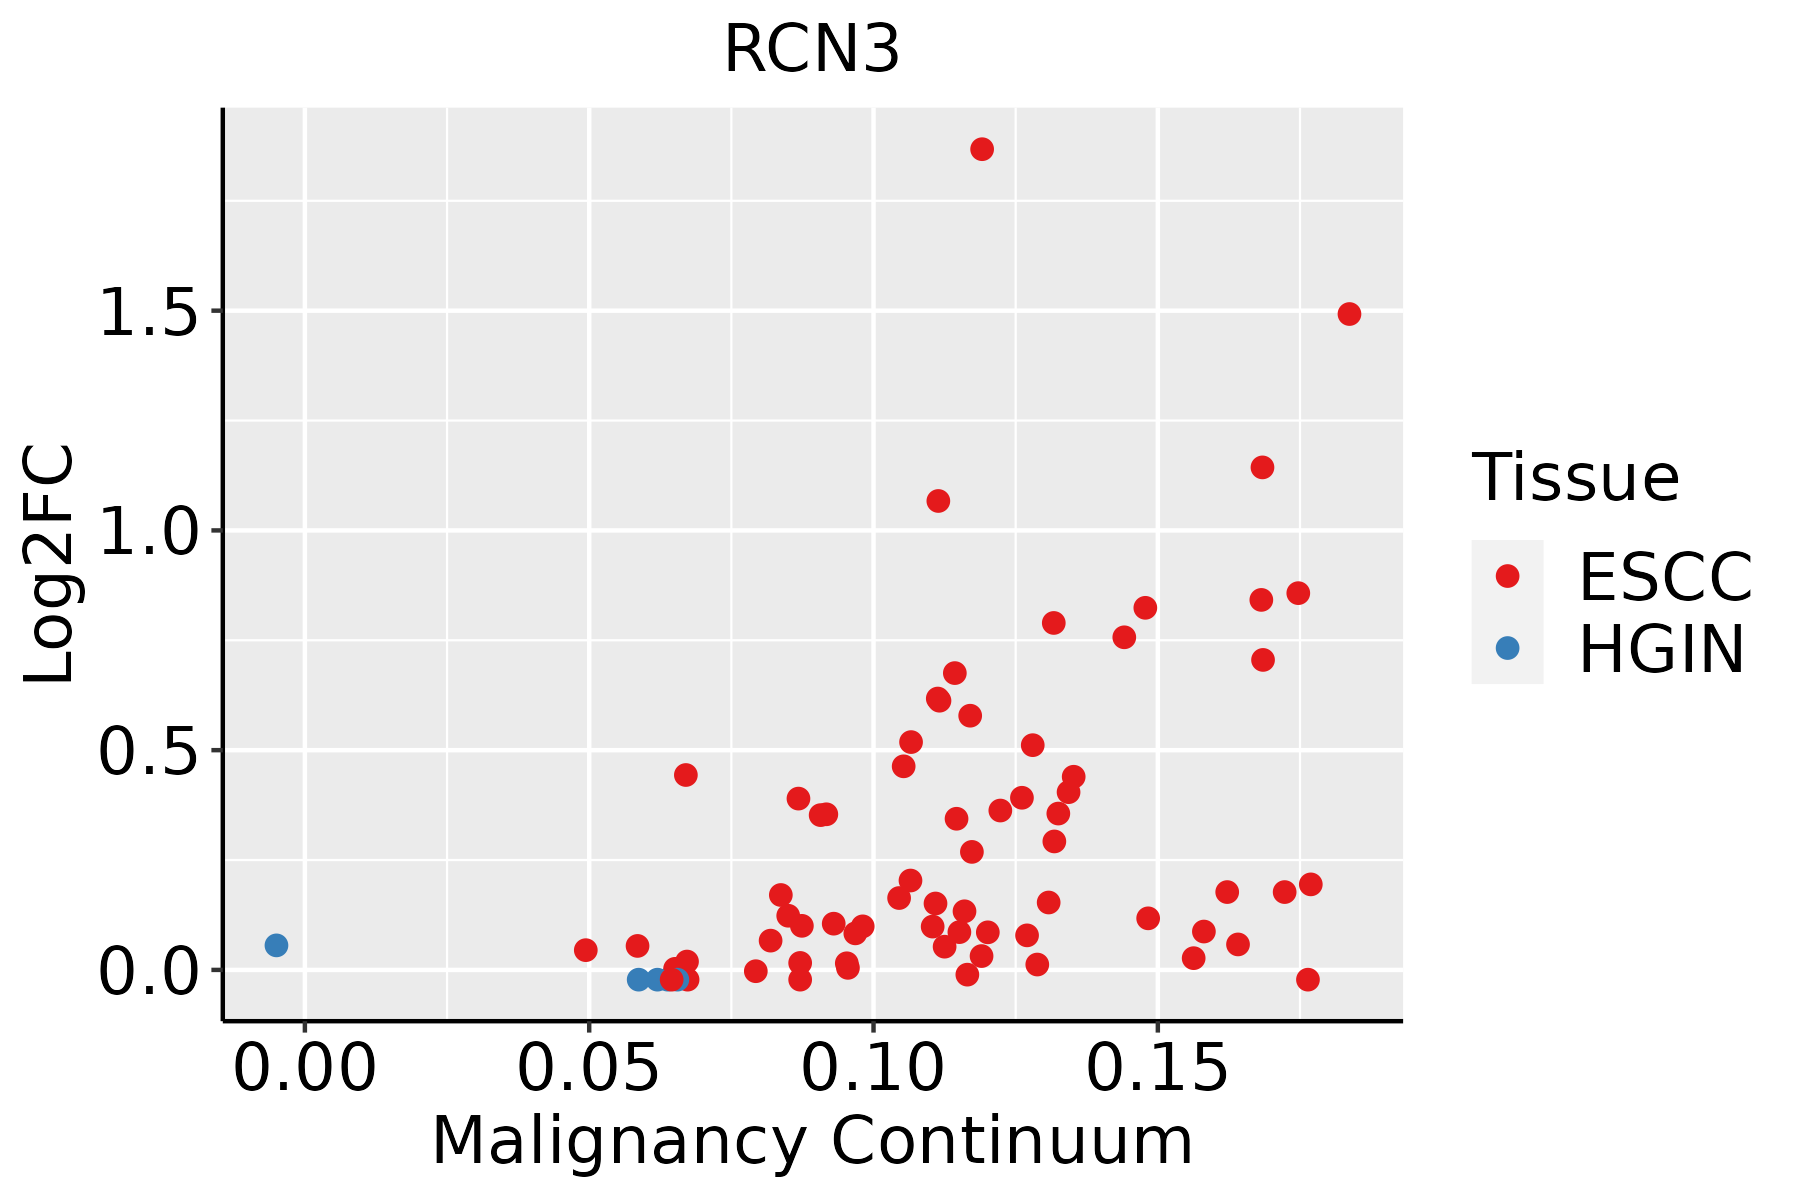 | ESCC: Esophageal squamous cell carcinoma |
| HGIN: High-grade intraepithelial neoplasias | ||
| LGIN: Low-grade intraepithelial neoplasias | ||
| Oral Cavity |  | EOLP: Erosive Oral lichen planus |
| LP: leukoplakia | ||
| NEOLP: Non-erosive oral lichen planus | ||
| OSCC: Oral squamous cell carcinoma | ||
| Thyroid | 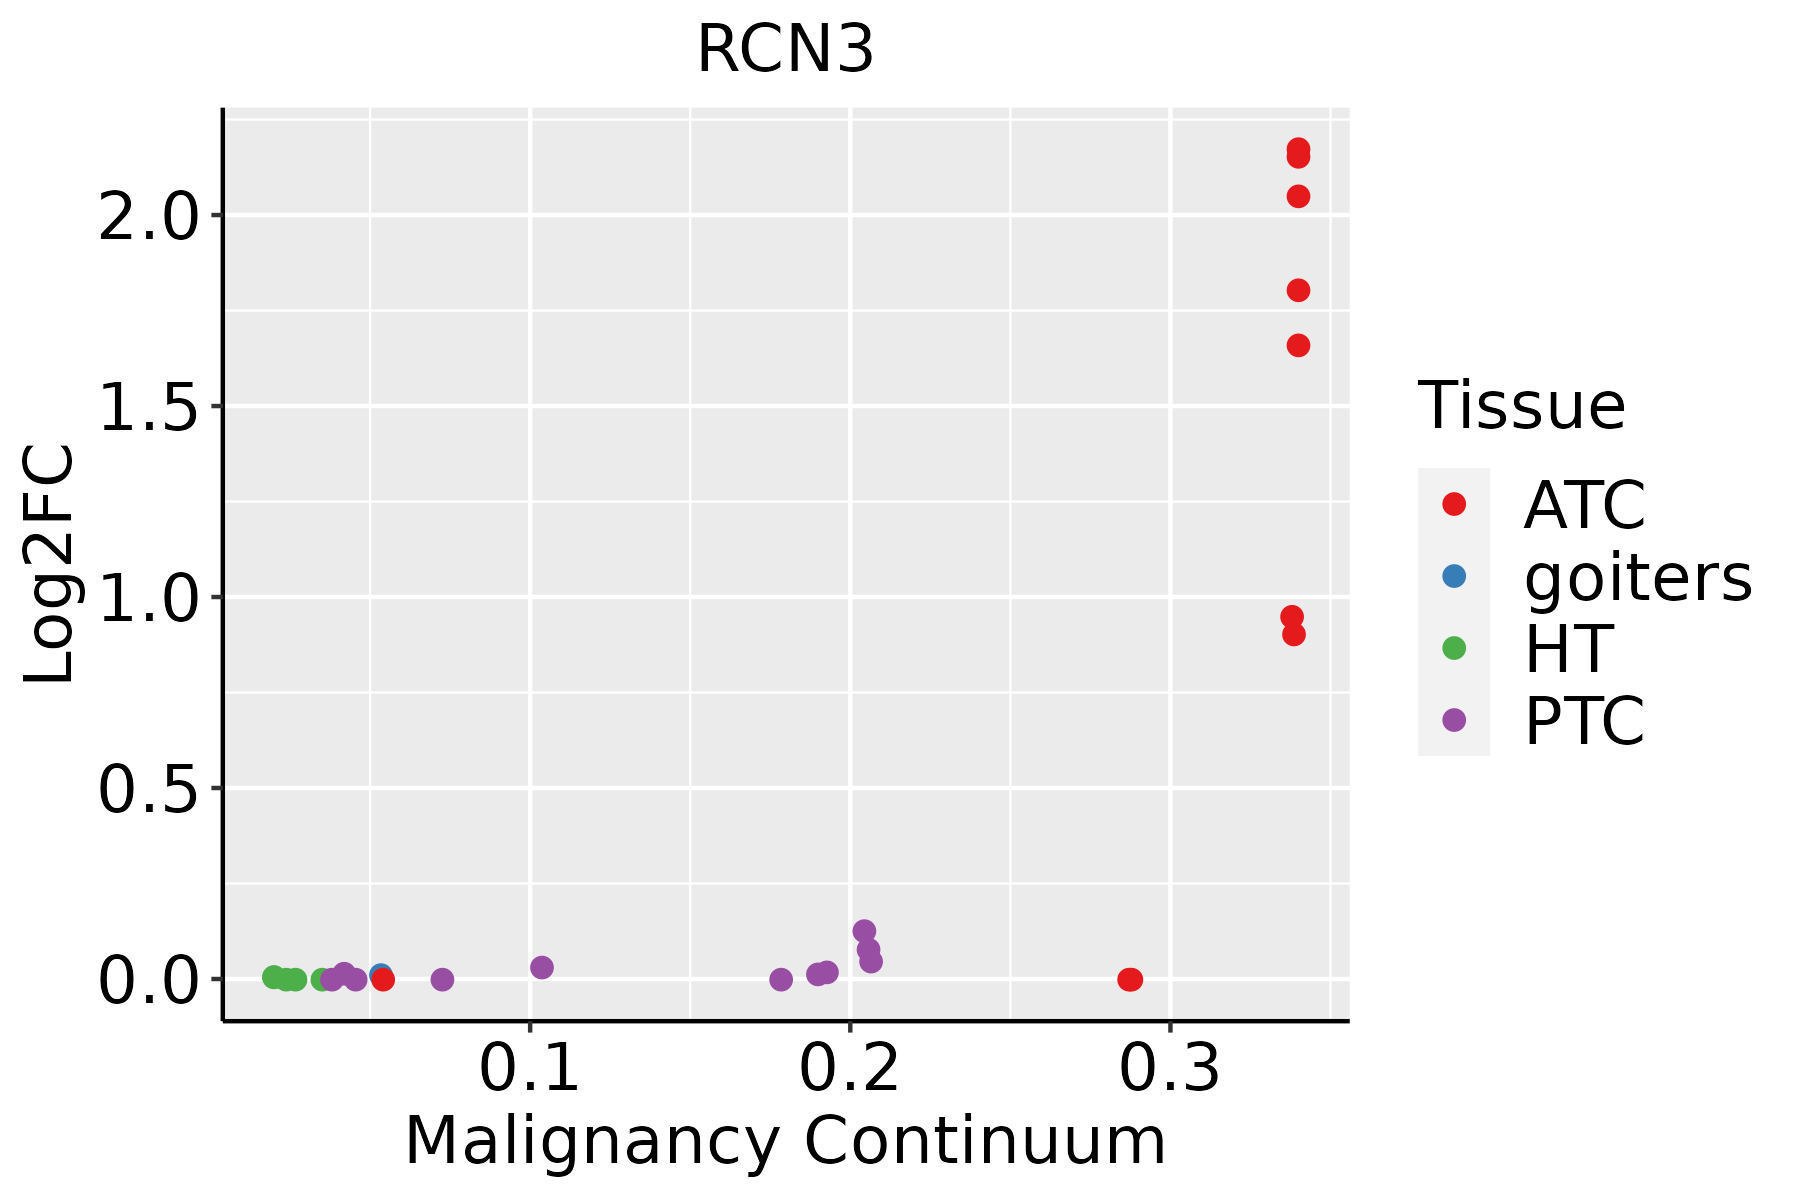 | ATC: Anaplastic thyroid cancer |
| HT: Hashimoto's thyroiditis | ||
| PTC: Papillary thyroid cancer |
| ∗log2FC in expression of this searched gene in stem-like cells from each diseased tissue sample relative to stem-like cells in normal samples in each tissue plotted against the malignancy continuum. Samples are colored based on if they are from different disease stage. |
Top |
Malignant transformation related pathway analysis |
| Find out the enriched GO biological processes and KEGG pathways involved in transition from healthy to precancer to cancer |
| Tissue | Disease Stage | Enriched GO biological Processes |
| Colorectum | AD |  |
| Colorectum | SER |  |
| Colorectum | MSS |  |
| Colorectum | MSI-H |  |
| Colorectum | FAP |  |
| ∗Top 15 enriched GO BP terms are showed in the bar plot of each disease state in each tissue. Each row represents a significant GO biological process which is colored according to the -log10(p.adjust). |
| Page: 1 2 3 4 5 6 7 8 9 |
| GO ID | Tissue | Disease Stage | Description | Gene Ratio | Bg Ratio | pvalue | p.adjust | Count |
| GO:0010498111 | Esophagus | ESCC | proteasomal protein catabolic process | 369/8552 | 490/18723 | 1.13e-41 | 1.80e-38 | 369 |
| GO:0034976111 | Esophagus | ESCC | response to endoplasmic reticulum stress | 192/8552 | 256/18723 | 7.15e-22 | 1.30e-19 | 192 |
| GO:0045862111 | Esophagus | ESCC | positive regulation of proteolysis | 256/8552 | 372/18723 | 7.88e-20 | 9.43e-18 | 256 |
| GO:003650315 | Esophagus | ESCC | ERAD pathway | 82/8552 | 107/18723 | 5.80e-11 | 1.84e-09 | 82 |
| GO:0010952111 | Esophagus | ESCC | positive regulation of peptidase activity | 133/8552 | 197/18723 | 4.31e-10 | 1.14e-08 | 133 |
| GO:0052547111 | Esophagus | ESCC | regulation of peptidase activity | 275/8552 | 461/18723 | 7.54e-10 | 1.88e-08 | 275 |
| GO:00303239 | Esophagus | ESCC | respiratory tube development | 112/8552 | 181/18723 | 7.82e-06 | 7.69e-05 | 112 |
| GO:00605417 | Esophagus | ESCC | respiratory system development | 123/8552 | 203/18723 | 1.26e-05 | 1.15e-04 | 123 |
| GO:00303249 | Esophagus | ESCC | lung development | 109/8552 | 177/18723 | 1.40e-05 | 1.27e-04 | 109 |
| GO:00604284 | Esophagus | ESCC | lung epithelium development | 27/8552 | 37/18723 | 7.00e-04 | 3.66e-03 | 27 |
| GO:00329631 | Esophagus | ESCC | collagen metabolic process | 62/8552 | 104/18723 | 2.90e-03 | 1.22e-02 | 62 |
| GO:000930617 | Esophagus | ESCC | protein secretion | 190/8552 | 359/18723 | 3.22e-03 | 1.34e-02 | 190 |
| GO:003559217 | Esophagus | ESCC | establishment of protein localization to extracellular region | 190/8552 | 360/18723 | 3.77e-03 | 1.53e-02 | 190 |
| GO:007169210 | Esophagus | ESCC | protein localization to extracellular region | 193/8552 | 368/18723 | 5.01e-03 | 1.92e-02 | 193 |
| GO:001049820 | Oral cavity | OSCC | proteasomal protein catabolic process | 336/7305 | 490/18723 | 5.45e-41 | 8.63e-38 | 336 |
| GO:003497620 | Oral cavity | OSCC | response to endoplasmic reticulum stress | 178/7305 | 256/18723 | 2.59e-23 | 6.06e-21 | 178 |
| GO:004586220 | Oral cavity | OSCC | positive regulation of proteolysis | 236/7305 | 372/18723 | 6.53e-22 | 1.38e-19 | 236 |
| GO:005254720 | Oral cavity | OSCC | regulation of peptidase activity | 255/7305 | 461/18723 | 5.78e-13 | 2.75e-11 | 255 |
| GO:00365035 | Oral cavity | OSCC | ERAD pathway | 76/7305 | 107/18723 | 1.76e-11 | 6.11e-10 | 76 |
| GO:001095220 | Oral cavity | OSCC | positive regulation of peptidase activity | 123/7305 | 197/18723 | 2.12e-11 | 7.21e-10 | 123 |
| Page: 1 2 3 4 |
| Pathway ID | Tissue | Disease Stage | Description | Gene Ratio | Bg Ratio | pvalue | p.adjust | qvalue | Count |
| Page: 1 |
Top |
Cell-cell communication analysis |
| Identification of potential cell-cell interactions between two cell types and their ligand-receptor pairs for different disease states |
| Ligand | Receptor | LRpair | Pathway | Tissue | Disease Stage |
| Page: 1 |
Top |
Single-cell gene regulatory network inference analysis |
| Find out the significant the regulons (TFs) and the target genes of each regulon across cell types for different disease states |
| TF | Cell Type | Tissue | Disease Stage | Target Gene | RSS | Regulon Activity |
| ∗The dot plots of a searched regulon are shown for all cell subpopulations in each disease state of each tissue based on the regulon specific score inferred using pySCENIC and by calculating the average expression. |
| Page: 1 |
Top |
Somatic mutation of malignant transformation related genes |
| Annotation of somatic variants for genes involved in malignant transformation |
| Hugo Symbol | Variant Class | Variant Classification | dbSNP RS | HGVSc | HGVSp | HGVSp Short | SWISSPROT | BIOTYPE | SIFT | PolyPhen | Tumor Sample Barcode | Tissue | Histology | Sex | Age | Stage | Therapy Types | Drugs | Outcome |
| RCN3 | deletion | Frame_Shift_Del | novel | c.452delN | p.Glu151AspfsTer38 | p.E151Dfs*38 | Q96D15 | protein_coding | TCGA-EW-A2FV-01 | Breast | breast invasive carcinoma | Female | <65 | III/IV | Chemotherapy | docetaxel | SD | ||
| RCN3 | SNV | Missense_Mutation | novel | c.73N>A | p.Asp25Asn | p.D25N | Q96D15 | protein_coding | deleterious(0.05) | possibly_damaging(0.665) | TCGA-2W-A8YY-01 | Cervix | cervical & endocervical cancer | Female | <65 | I/II | Chemotherapy | cisplatin | CR |
| RCN3 | SNV | Missense_Mutation | c.358N>A | p.Ala120Thr | p.A120T | Q96D15 | protein_coding | tolerated(0.05) | benign(0.102) | TCGA-A6-3809-01 | Colorectum | colon adenocarcinoma | Female | >=65 | I/II | Unknown | Unknown | SD | |
| RCN3 | SNV | Missense_Mutation | c.166C>T | p.His56Tyr | p.H56Y | Q96D15 | protein_coding | deleterious(0) | probably_damaging(0.979) | TCGA-AA-3672-01 | Colorectum | colon adenocarcinoma | Female | >=65 | III/IV | Unknown | Unknown | SD | |
| RCN3 | SNV | Missense_Mutation | novel | c.461N>G | p.Asp154Gly | p.D154G | Q96D15 | protein_coding | deleterious(0.02) | benign(0.037) | TCGA-AA-3861-01 | Colorectum | colon adenocarcinoma | Male | >=65 | I/II | Unknown | Unknown | SD |
| RCN3 | SNV | Missense_Mutation | novel | c.112N>C | p.Ala38Pro | p.A38P | Q96D15 | protein_coding | tolerated(0.41) | benign(0) | TCGA-AA-3950-01 | Colorectum | colon adenocarcinoma | Female | >=65 | I/II | Unknown | Unknown | SD |
| RCN3 | SNV | Missense_Mutation | rs748594439 | c.899C>T | p.Ala300Val | p.A300V | Q96D15 | protein_coding | deleterious(0.03) | benign(0.183) | TCGA-AD-5900-01 | Colorectum | colon adenocarcinoma | Male | >=65 | I/II | Unknown | Unknown | SD |
| RCN3 | SNV | Missense_Mutation | c.517N>T | p.Arg173Trp | p.R173W | Q96D15 | protein_coding | deleterious(0) | benign(0.269) | TCGA-AZ-6598-01 | Colorectum | colon adenocarcinoma | Female | >=65 | I/II | Unknown | Unknown | SD | |
| RCN3 | SNV | Missense_Mutation | novel | c.119T>C | p.Leu40Pro | p.L40P | Q96D15 | protein_coding | deleterious(0) | probably_damaging(0.997) | TCGA-D5-6927-01 | Colorectum | colon adenocarcinoma | Male | <65 | I/II | Unknown | Unknown | SD |
| RCN3 | SNV | Missense_Mutation | c.818C>A | p.Pro273His | p.P273H | Q96D15 | protein_coding | tolerated(0.13) | possibly_damaging(0.575) | TCGA-G4-6309-01 | Colorectum | colon adenocarcinoma | Female | <65 | III/IV | Chemotherapy | xeloda | PD |
| Page: 1 2 3 4 |
Top |
Related drugs of malignant transformation related genes |
| Identification of chemicals and drugs interact with genes involved in malignant transfromation |
| (DGIdb 4.0) |
| Entrez ID | Symbol | Category | Interaction Types | Drug Claim Name | Drug Name | PMIDs |
| Page: 1 |

Copyright 2023-Present -The University of Texas Health Science Center at Houston |