
|
|||||
|
 | |
| |
| |
| |
| |
| |
|
Gene: RCN2 |
Gene summary for RCN2 |
| Gene information | Species | Human | Gene symbol | RCN2 | Gene ID | 5955 |
| Gene name | reticulocalbin 2 | |
| Gene Alias | E6BP | |
| Cytomap | 15q24.3 | |
| Gene Type | protein-coding | GO ID | GO:0005575 | UniProtAcc | Q14257 |
Top |
Malignant transformation analysis |
| Identification of the aberrant gene expression in precancerous and cancerous lesions by comparing the gene expression of stem-like cells in diseased tissues with normal stem cells |
| Entrez ID | Symbol | Replicates | Species | Organ | Tissue | Adj P-value | Log2FC | Malignancy |
| 5955 | RCN2 | AEH-subject1 | Human | Endometrium | AEH | 4.49e-10 | -3.35e-01 | -0.3059 |
| 5955 | RCN2 | AEH-subject2 | Human | Endometrium | AEH | 5.88e-06 | -2.74e-01 | -0.2525 |
| 5955 | RCN2 | AEH-subject3 | Human | Endometrium | AEH | 5.93e-09 | -2.64e-01 | -0.2576 |
| 5955 | RCN2 | AEH-subject4 | Human | Endometrium | AEH | 1.32e-02 | -3.07e-01 | -0.2657 |
| 5955 | RCN2 | AEH-subject5 | Human | Endometrium | AEH | 4.17e-09 | -3.40e-01 | -0.2953 |
| 5955 | RCN2 | EEC-subject1 | Human | Endometrium | EEC | 5.91e-06 | -1.14e-01 | -0.2682 |
| 5955 | RCN2 | EEC-subject2 | Human | Endometrium | EEC | 7.97e-13 | -4.32e-01 | -0.2607 |
| 5955 | RCN2 | EEC-subject3 | Human | Endometrium | EEC | 3.33e-37 | -1.31e-01 | -0.2525 |
| 5955 | RCN2 | EEC-subject4 | Human | Endometrium | EEC | 1.46e-02 | -2.85e-01 | -0.2571 |
| 5955 | RCN2 | EEC-subject5 | Human | Endometrium | EEC | 3.10e-08 | -3.14e-01 | -0.249 |
| 5955 | RCN2 | GSM5276934 | Human | Endometrium | EEC | 1.41e-14 | -4.40e-01 | -0.0913 |
| 5955 | RCN2 | GSM5276935 | Human | Endometrium | EEC | 7.04e-09 | 3.48e-01 | -0.123 |
| 5955 | RCN2 | GSM5276937 | Human | Endometrium | EEC | 3.09e-03 | -3.49e-01 | -0.0897 |
| 5955 | RCN2 | GSM6177620_NYU_UCEC1_lib1_lib1 | Human | Endometrium | EEC | 1.13e-26 | -4.36e-01 | -0.1869 |
| 5955 | RCN2 | GSM6177620_NYU_UCEC1_lib2_lib2 | Human | Endometrium | EEC | 2.41e-27 | -3.13e-01 | -0.1875 |
| 5955 | RCN2 | GSM6177620_NYU_UCEC1_lib3_lib3 | Human | Endometrium | EEC | 1.24e-27 | -2.78e-01 | -0.1883 |
| 5955 | RCN2 | GSM6177621_NYU_UCEC2_lib1_lib1 | Human | Endometrium | EEC | 2.92e-25 | -2.08e-01 | -0.1934 |
| 5955 | RCN2 | GSM6177622_NYU_UCEC3_lib1_lib1 | Human | Endometrium | EEC | 6.28e-48 | -4.14e-01 | -0.1917 |
| 5955 | RCN2 | GSM6177622_NYU_UCEC3_lib2_lib2 | Human | Endometrium | EEC | 9.24e-41 | -4.79e-01 | -0.1916 |
| 5955 | RCN2 | GSM6177623_NYU_UCEC3_Vis | Human | Endometrium | EEC | 1.41e-05 | 7.33e-02 | -0.1269 |
| Page: 1 2 3 4 5 6 7 8 9 |
| Tissue | Expression Dynamics | Abbreviation |
| Endometrium |  | AEH: Atypical endometrial hyperplasia |
| EEC: Endometrioid Cancer | ||
| Esophagus | 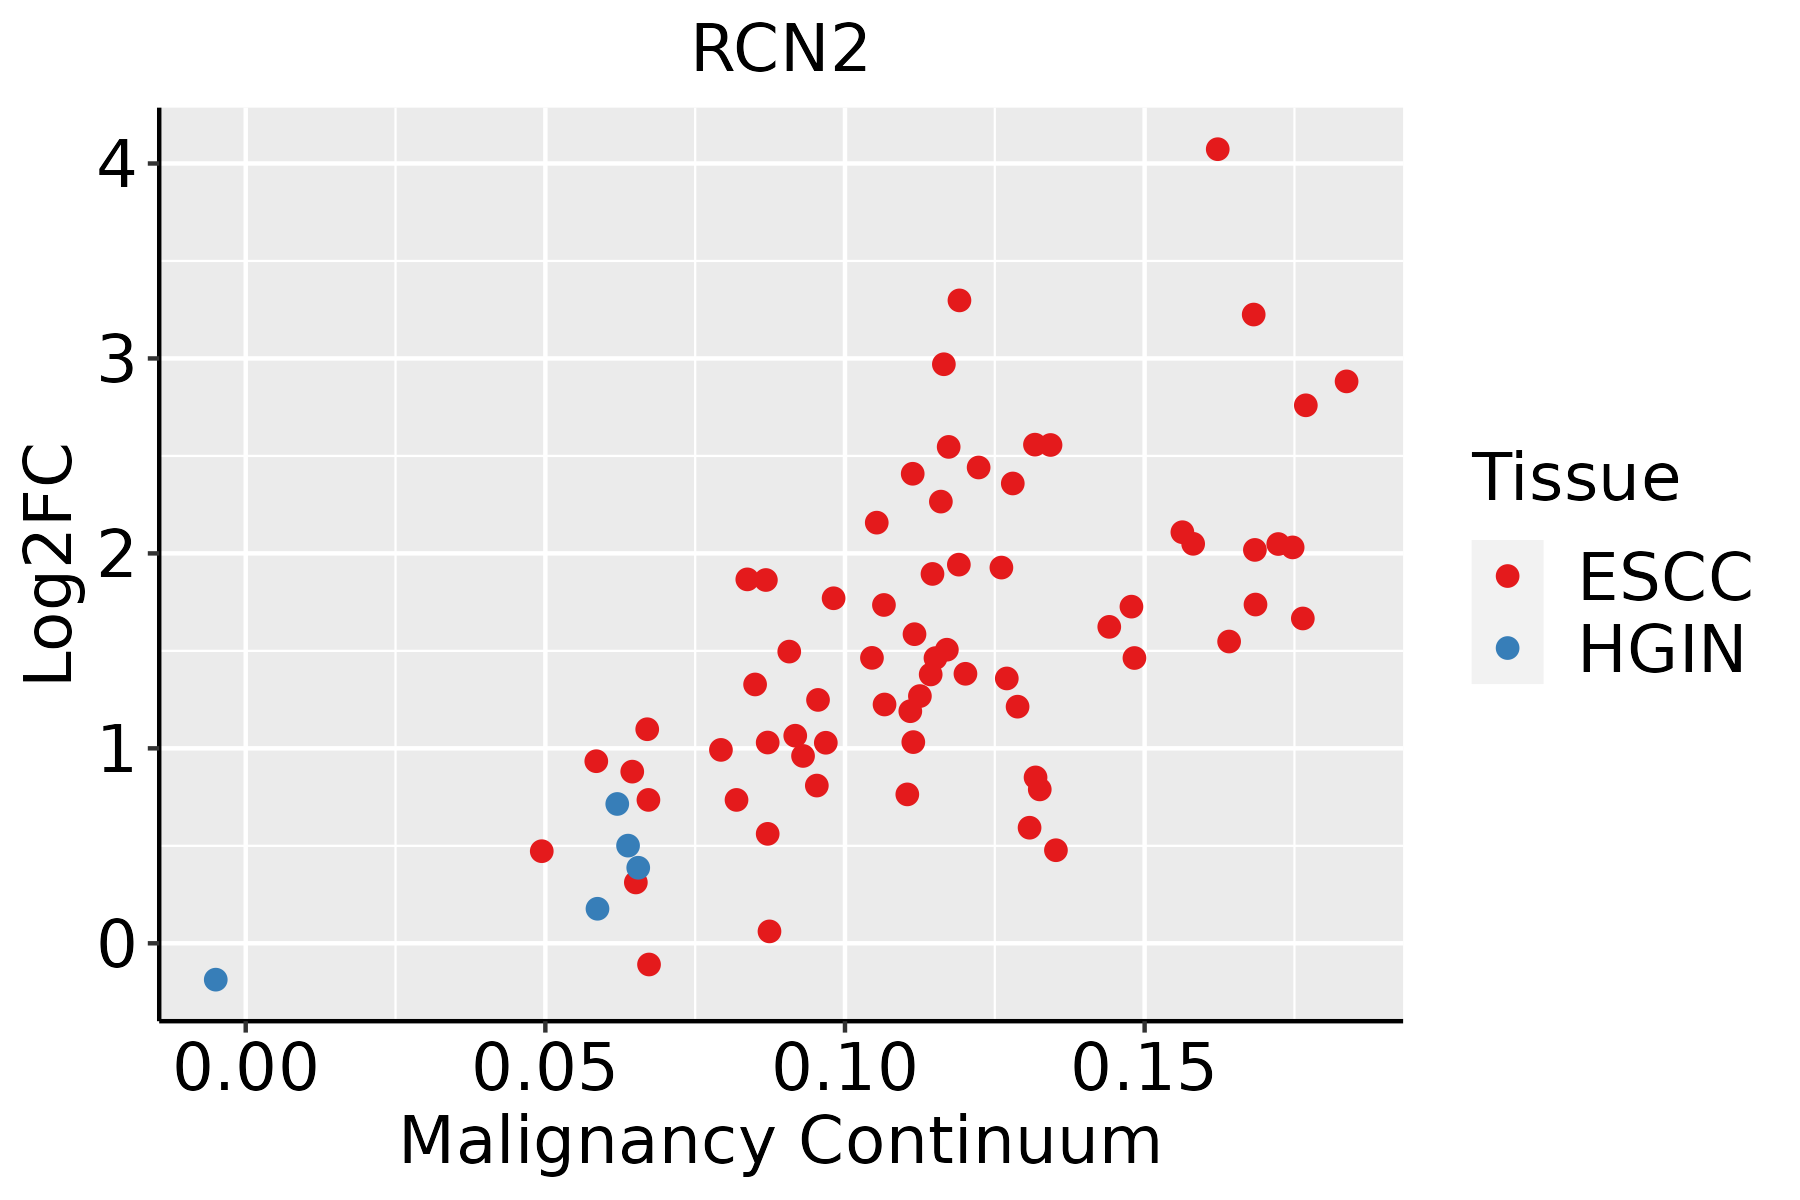 | ESCC: Esophageal squamous cell carcinoma |
| HGIN: High-grade intraepithelial neoplasias | ||
| LGIN: Low-grade intraepithelial neoplasias | ||
| Liver | 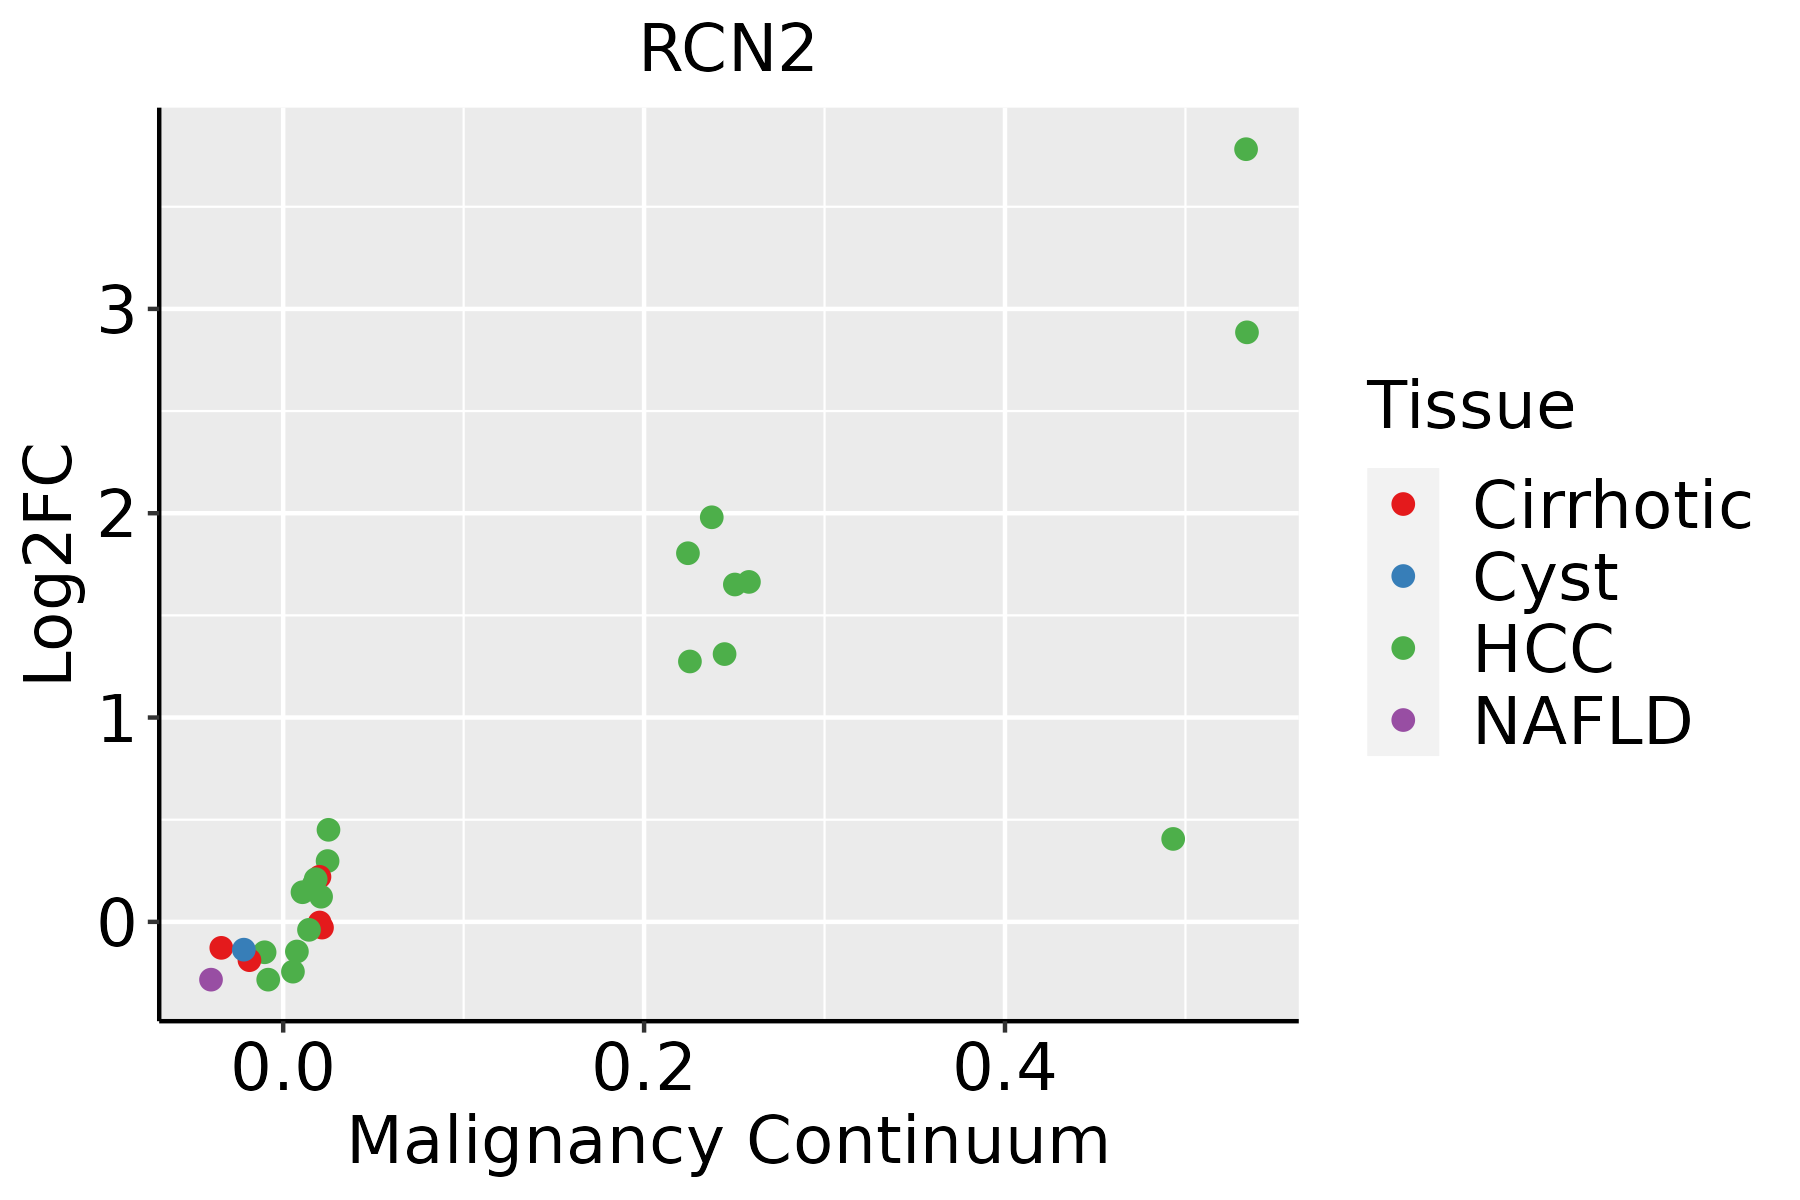 | HCC: Hepatocellular carcinoma |
| NAFLD: Non-alcoholic fatty liver disease | ||
| Oral Cavity | 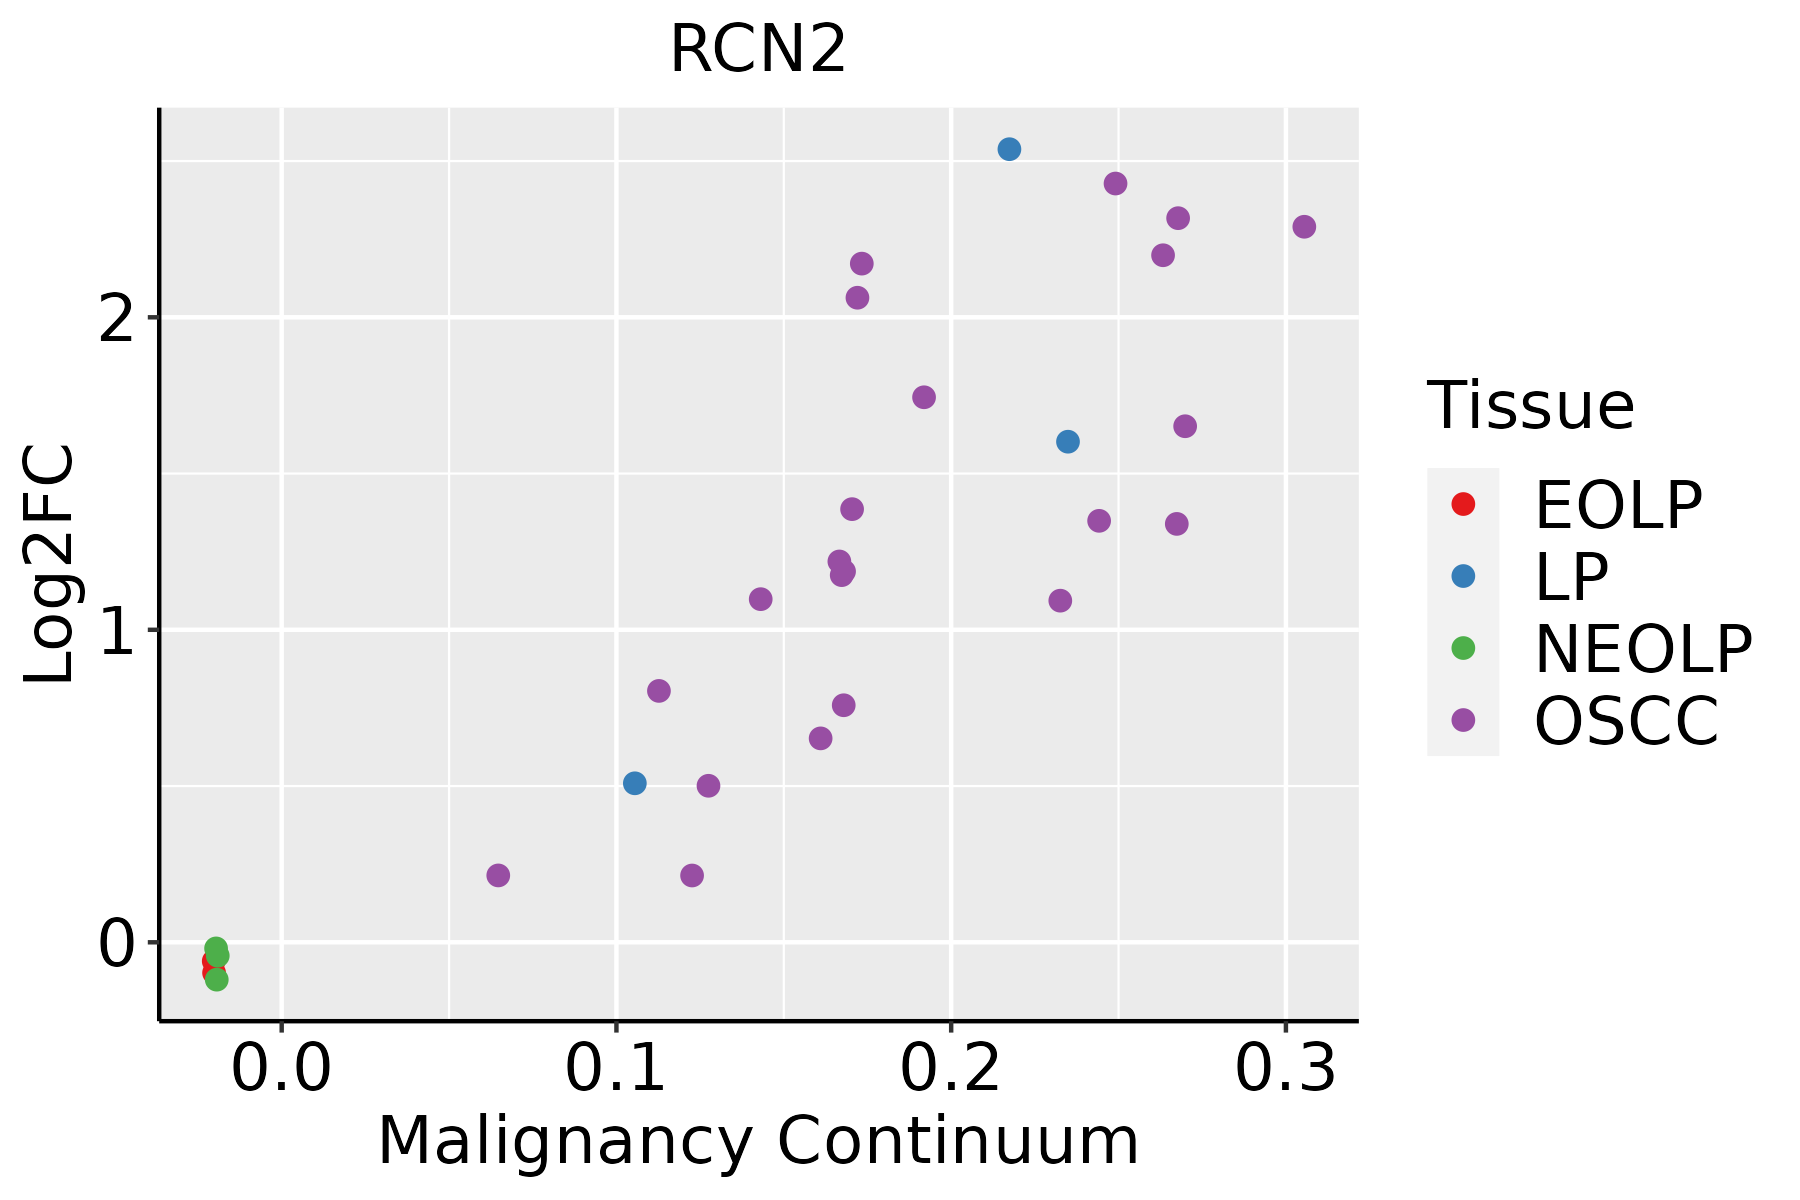 | EOLP: Erosive Oral lichen planus |
| LP: leukoplakia | ||
| NEOLP: Non-erosive oral lichen planus | ||
| OSCC: Oral squamous cell carcinoma | ||
| Prostate |  | BPH: Benign Prostatic Hyperplasia |
| Skin | 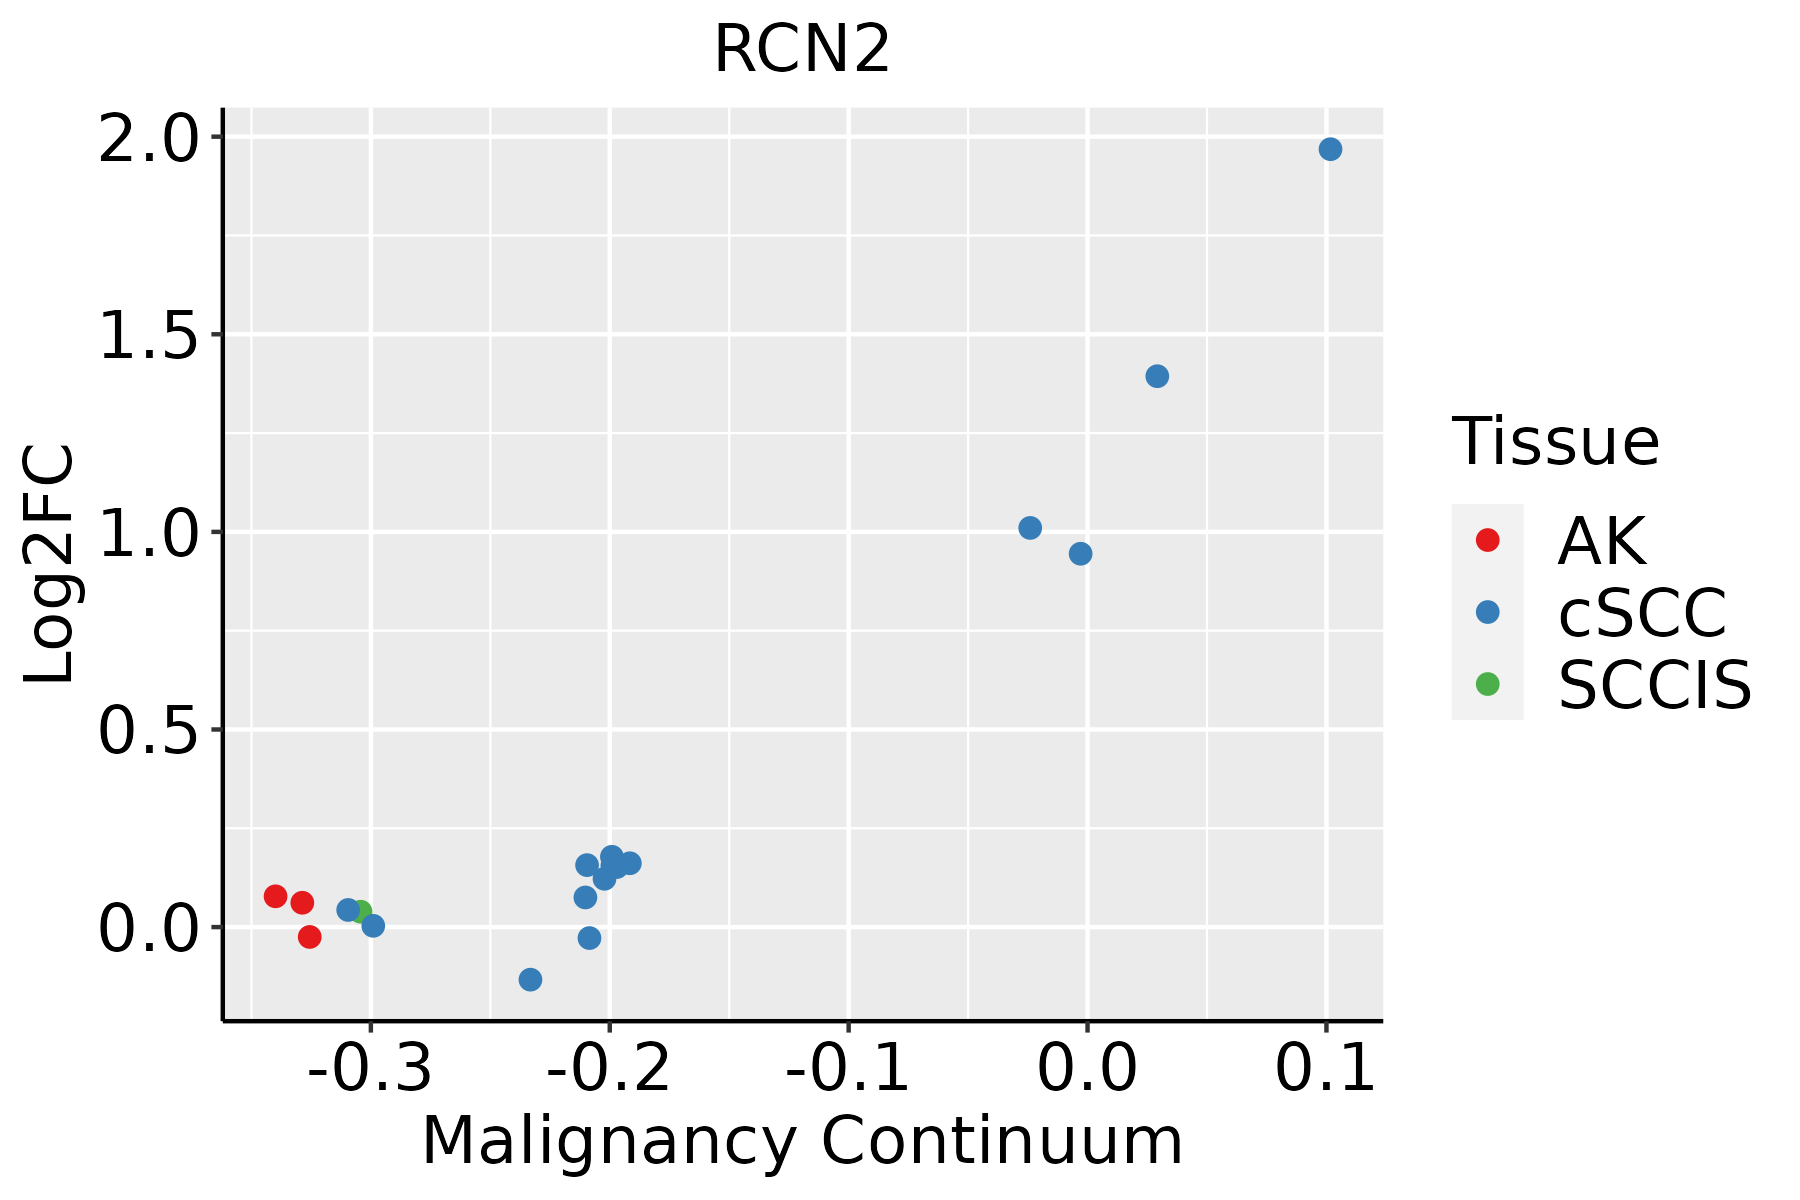 | AK: Actinic keratosis |
| cSCC: Cutaneous squamous cell carcinoma | ||
| SCCIS:squamous cell carcinoma in situ | ||
| Thyroid | 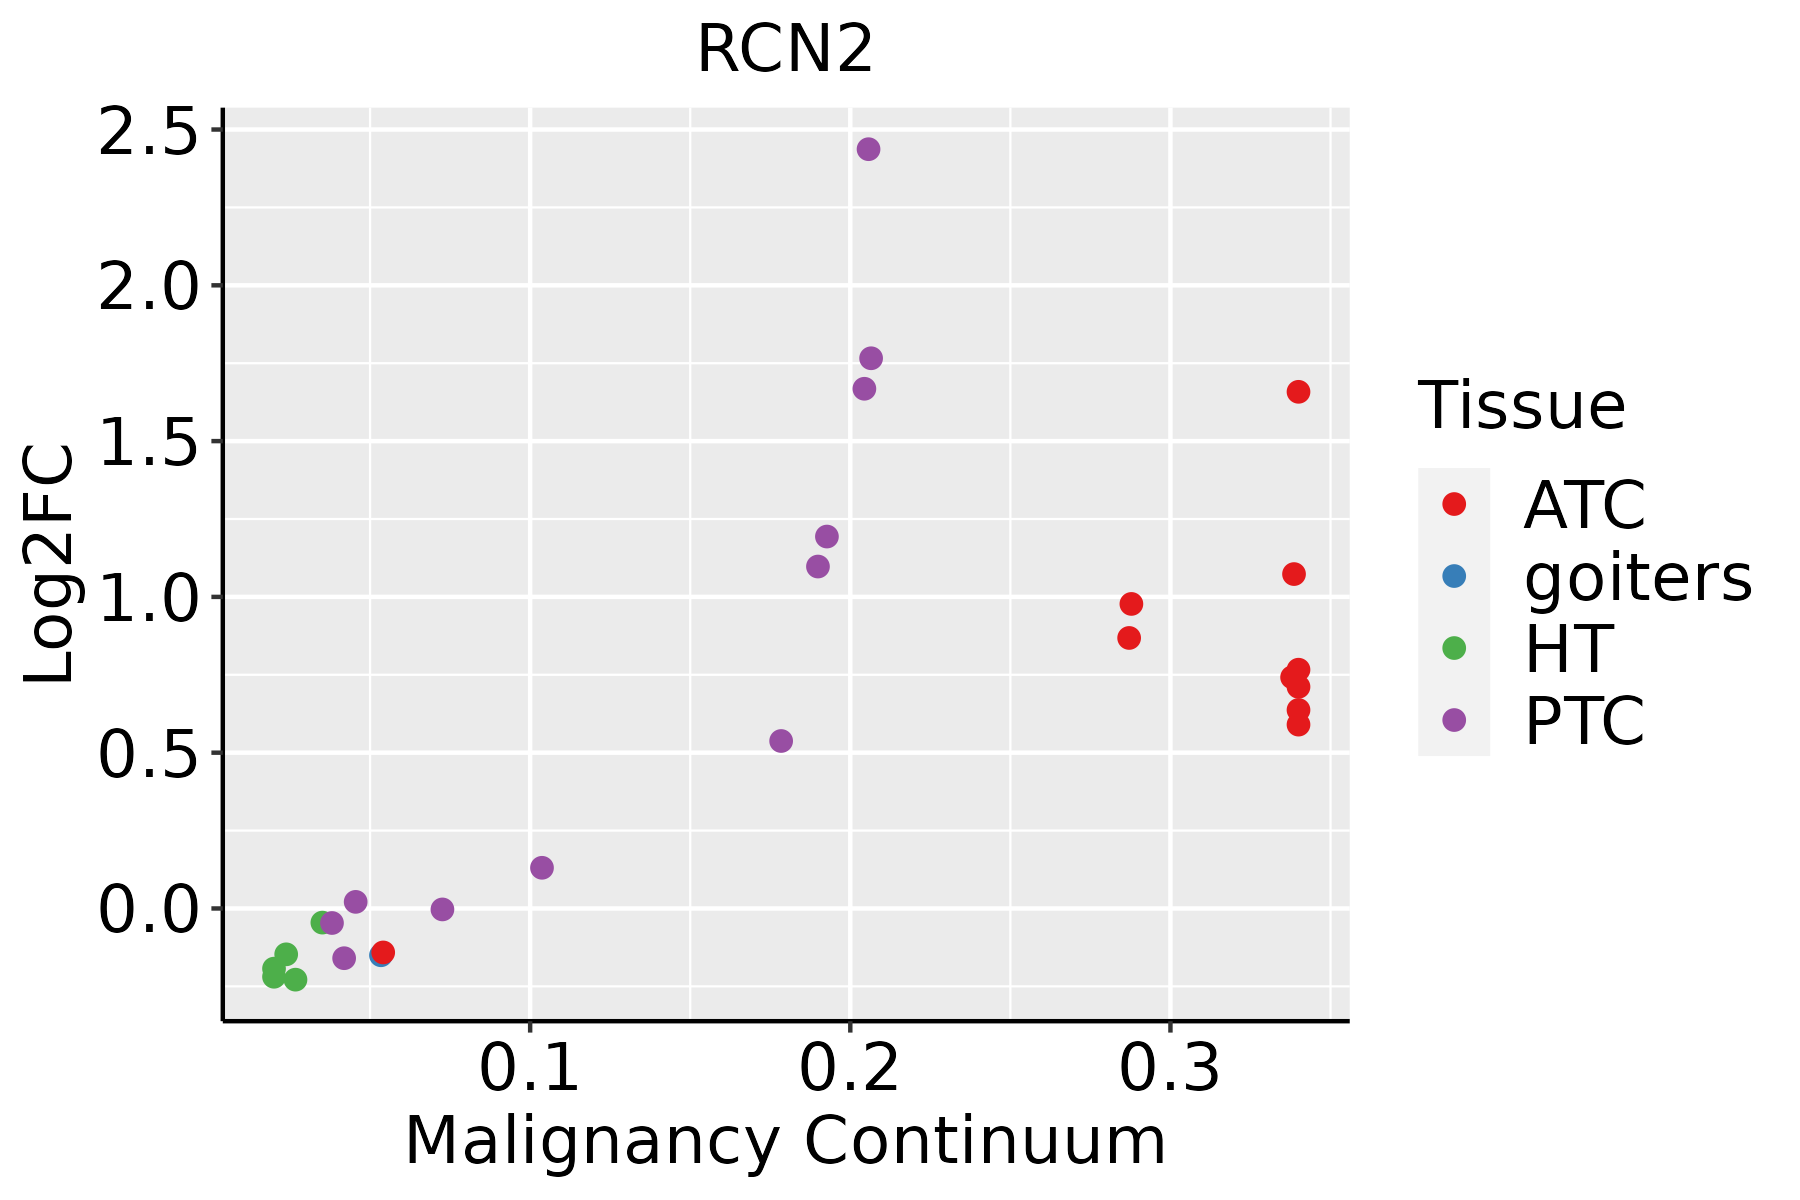 | ATC: Anaplastic thyroid cancer |
| HT: Hashimoto's thyroiditis | ||
| PTC: Papillary thyroid cancer |
| ∗log2FC in expression of this searched gene in stem-like cells from each diseased tissue sample relative to stem-like cells in normal samples in each tissue plotted against the malignancy continuum. Samples are colored based on if they are from different disease stage. |
Top |
Malignant transformation related pathway analysis |
| Find out the enriched GO biological processes and KEGG pathways involved in transition from healthy to precancer to cancer |
| Tissue | Disease Stage | Enriched GO biological Processes |
| Colorectum | AD |  |
| Colorectum | SER |  |
| Colorectum | MSS |  |
| Colorectum | MSI-H |  |
| Colorectum | FAP |  |
| ∗Top 15 enriched GO BP terms are showed in the bar plot of each disease state in each tissue. Each row represents a significant GO biological process which is colored according to the -log10(p.adjust). |
| Page: 1 2 3 4 5 6 7 8 9 |
| GO ID | Tissue | Disease Stage | Description | Gene Ratio | Bg Ratio | pvalue | p.adjust | Count |
| Page: 1 |
| Pathway ID | Tissue | Disease Stage | Description | Gene Ratio | Bg Ratio | pvalue | p.adjust | qvalue | Count |
| Page: 1 |
Top |
Cell-cell communication analysis |
| Identification of potential cell-cell interactions between two cell types and their ligand-receptor pairs for different disease states |
| Ligand | Receptor | LRpair | Pathway | Tissue | Disease Stage |
| Page: 1 |
Top |
Single-cell gene regulatory network inference analysis |
| Find out the significant the regulons (TFs) and the target genes of each regulon across cell types for different disease states |
| TF | Cell Type | Tissue | Disease Stage | Target Gene | RSS | Regulon Activity |
| ∗The dot plots of a searched regulon are shown for all cell subpopulations in each disease state of each tissue based on the regulon specific score inferred using pySCENIC and by calculating the average expression. |
| Page: 1 |
Top |
Somatic mutation of malignant transformation related genes |
| Annotation of somatic variants for genes involved in malignant transformation |
| Hugo Symbol | Variant Class | Variant Classification | dbSNP RS | HGVSc | HGVSp | HGVSp Short | SWISSPROT | BIOTYPE | SIFT | PolyPhen | Tumor Sample Barcode | Tissue | Histology | Sex | Age | Stage | Therapy Types | Drugs | Outcome |
| RCN2 | SNV | Missense_Mutation | novel | c.563N>A | p.Ser188Asn | p.S188N | Q14257 | protein_coding | tolerated(1) | benign(0.001) | TCGA-2W-A8YY-01 | Cervix | cervical & endocervical cancer | Female | <65 | I/II | Chemotherapy | cisplatin | CR |
| RCN2 | SNV | Missense_Mutation | c.919C>A | p.Leu307Met | p.L307M | Q14257 | protein_coding | tolerated(0.06) | benign(0.232) | TCGA-AA-A010-01 | Colorectum | colon adenocarcinoma | Female | <65 | I/II | Chemotherapy | folinic | CR | |
| RCN2 | SNV | Missense_Mutation | rs766204743 | c.784N>A | p.Asp262Asn | p.D262N | Q14257 | protein_coding | tolerated(0.12) | benign(0.062) | TCGA-F5-6814-01 | Colorectum | rectum adenocarcinoma | Male | <65 | I/II | Unknown | Unknown | SD |
| RCN2 | deletion | Frame_Shift_Del | c.331delN | p.Asn112ThrfsTer6 | p.N112Tfs*6 | Q14257 | protein_coding | TCGA-D5-6530-01 | Colorectum | colon adenocarcinoma | Male | <65 | I/II | Unknown | Unknown | SD | |||
| RCN2 | SNV | Missense_Mutation | novel | c.443N>T | p.Arg148Met | p.R148M | Q14257 | protein_coding | deleterious(0.01) | probably_damaging(0.974) | TCGA-A5-A0G2-01 | Endometrium | uterine corpus endometrioid carcinoma | Female | <65 | III/IV | Unknown | Unknown | SD |
| RCN2 | SNV | Missense_Mutation | rs556906206 | c.494G>A | p.Arg165Gln | p.R165Q | Q14257 | protein_coding | tolerated(0.1) | benign(0.009) | TCGA-AX-A2HC-01 | Endometrium | uterine corpus endometrioid carcinoma | Female | <65 | III/IV | Chemotherapy | paclitaxel | PD |
| RCN2 | SNV | Missense_Mutation | novel | c.473N>T | p.Ser158Phe | p.S158F | Q14257 | protein_coding | tolerated_low_confidence(0.35) | benign(0.003) | TCGA-B5-A1MR-01 | Endometrium | uterine corpus endometrioid carcinoma | Female | >=65 | III/IV | Unknown | Unknown | SD |
| RCN2 | SNV | Missense_Mutation | rs751566644 | c.844N>A | p.Ala282Thr | p.A282T | Q14257 | protein_coding | deleterious(0) | possibly_damaging(0.82) | TCGA-B5-A3FC-01 | Endometrium | uterine corpus endometrioid carcinoma | Female | <65 | I/II | Unknown | Unknown | SD |
| RCN2 | SNV | Missense_Mutation | rs770494865 | c.936N>T | p.Leu312Phe | p.L312F | Q14257 | protein_coding | deleterious(0) | possibly_damaging(0.694) | TCGA-BG-A187-01 | Endometrium | uterine corpus endometrioid carcinoma | Female | >=65 | I/II | Unknown | Unknown | SD |
| RCN2 | SNV | Missense_Mutation | novel | c.602N>C | p.Val201Ala | p.V201A | Q14257 | protein_coding | tolerated(0.14) | possibly_damaging(0.57) | TCGA-BG-A222-01 | Endometrium | uterine corpus endometrioid carcinoma | Female | <65 | I/II | Unknown | Unknown | SD |
| Page: 1 2 3 |
Top |
Related drugs of malignant transformation related genes |
| Identification of chemicals and drugs interact with genes involved in malignant transfromation |
| (DGIdb 4.0) |
| Entrez ID | Symbol | Category | Interaction Types | Drug Claim Name | Drug Name | PMIDs |
| Page: 1 |

Copyright 2023-Present -The University of Texas Health Science Center at Houston |