
|
|||||
|
 | |
| |
| |
| |
| |
| |
|
Gene: RCN1 |
Gene summary for RCN1 |
| Gene information | Species | Human | Gene symbol | RCN1 | Gene ID | 5954 |
| Gene name | reticulocalbin 1 | |
| Gene Alias | HEL-S-84 | |
| Cytomap | 11p13 | |
| Gene Type | protein-coding | GO ID | GO:0005575 | UniProtAcc | Q15293 |
Top |
Malignant transformation analysis |
| Identification of the aberrant gene expression in precancerous and cancerous lesions by comparing the gene expression of stem-like cells in diseased tissues with normal stem cells |
| Entrez ID | Symbol | Replicates | Species | Organ | Tissue | Adj P-value | Log2FC | Malignancy |
| 5954 | RCN1 | HTA11_1938_2000001011 | Human | Colorectum | AD | 2.00e-10 | 3.30e-01 | -0.0811 |
| 5954 | RCN1 | HTA11_78_2000001011 | Human | Colorectum | AD | 1.31e-09 | 3.15e-01 | -0.1088 |
| 5954 | RCN1 | HTA11_347_2000001011 | Human | Colorectum | AD | 1.71e-12 | 3.69e-01 | -0.1954 |
| 5954 | RCN1 | HTA11_3361_2000001011 | Human | Colorectum | AD | 5.26e-03 | 2.26e-01 | -0.1207 |
| 5954 | RCN1 | HTA11_83_2000001011 | Human | Colorectum | SER | 3.19e-02 | 2.00e-01 | -0.1526 |
| 5954 | RCN1 | HTA11_696_2000001011 | Human | Colorectum | AD | 3.83e-10 | 2.60e-01 | -0.1464 |
| 5954 | RCN1 | HTA11_866_2000001011 | Human | Colorectum | AD | 5.36e-04 | 1.54e-01 | -0.1001 |
| 5954 | RCN1 | HTA11_1391_2000001011 | Human | Colorectum | AD | 1.43e-20 | 5.61e-01 | -0.059 |
| 5954 | RCN1 | HTA11_2992_2000001011 | Human | Colorectum | SER | 1.15e-02 | 2.79e-01 | -0.1706 |
| 5954 | RCN1 | HTA11_546_2000001011 | Human | Colorectum | AD | 7.69e-05 | 2.44e-01 | -0.0842 |
| 5954 | RCN1 | HTA11_866_3004761011 | Human | Colorectum | AD | 3.06e-11 | 2.73e-01 | 0.096 |
| 5954 | RCN1 | HTA11_7663_2000001011 | Human | Colorectum | SER | 9.74e-06 | 3.76e-01 | 0.0131 |
| 5954 | RCN1 | HTA11_10623_2000001011 | Human | Colorectum | AD | 2.27e-02 | 2.32e-01 | -0.0177 |
| 5954 | RCN1 | HTA11_10711_2000001011 | Human | Colorectum | AD | 1.12e-02 | 1.43e-01 | 0.0338 |
| 5954 | RCN1 | HTA11_7696_3000711011 | Human | Colorectum | AD | 1.25e-10 | 2.34e-01 | 0.0674 |
| 5954 | RCN1 | HTA11_6818_2000001021 | Human | Colorectum | AD | 8.21e-06 | 2.46e-01 | 0.0588 |
| 5954 | RCN1 | HTA11_99999970781_79442 | Human | Colorectum | MSS | 2.98e-20 | 5.02e-01 | 0.294 |
| 5954 | RCN1 | HTA11_99999965062_69753 | Human | Colorectum | MSI-H | 1.65e-18 | 1.40e+00 | 0.3487 |
| 5954 | RCN1 | HTA11_99999965104_69814 | Human | Colorectum | MSS | 1.86e-09 | 3.39e-01 | 0.281 |
| 5954 | RCN1 | HTA11_99999971662_82457 | Human | Colorectum | MSS | 5.18e-24 | 5.64e-01 | 0.3859 |
| Page: 1 2 3 4 5 6 7 8 9 |
| Tissue | Expression Dynamics | Abbreviation |
| Colorectum (GSE201348) |  | FAP: Familial adenomatous polyposis |
| CRC: Colorectal cancer | ||
| Colorectum (HTA11) |  | AD: Adenomas |
| SER: Sessile serrated lesions | ||
| MSI-H: Microsatellite-high colorectal cancer | ||
| MSS: Microsatellite stable colorectal cancer | ||
| Endometrium | 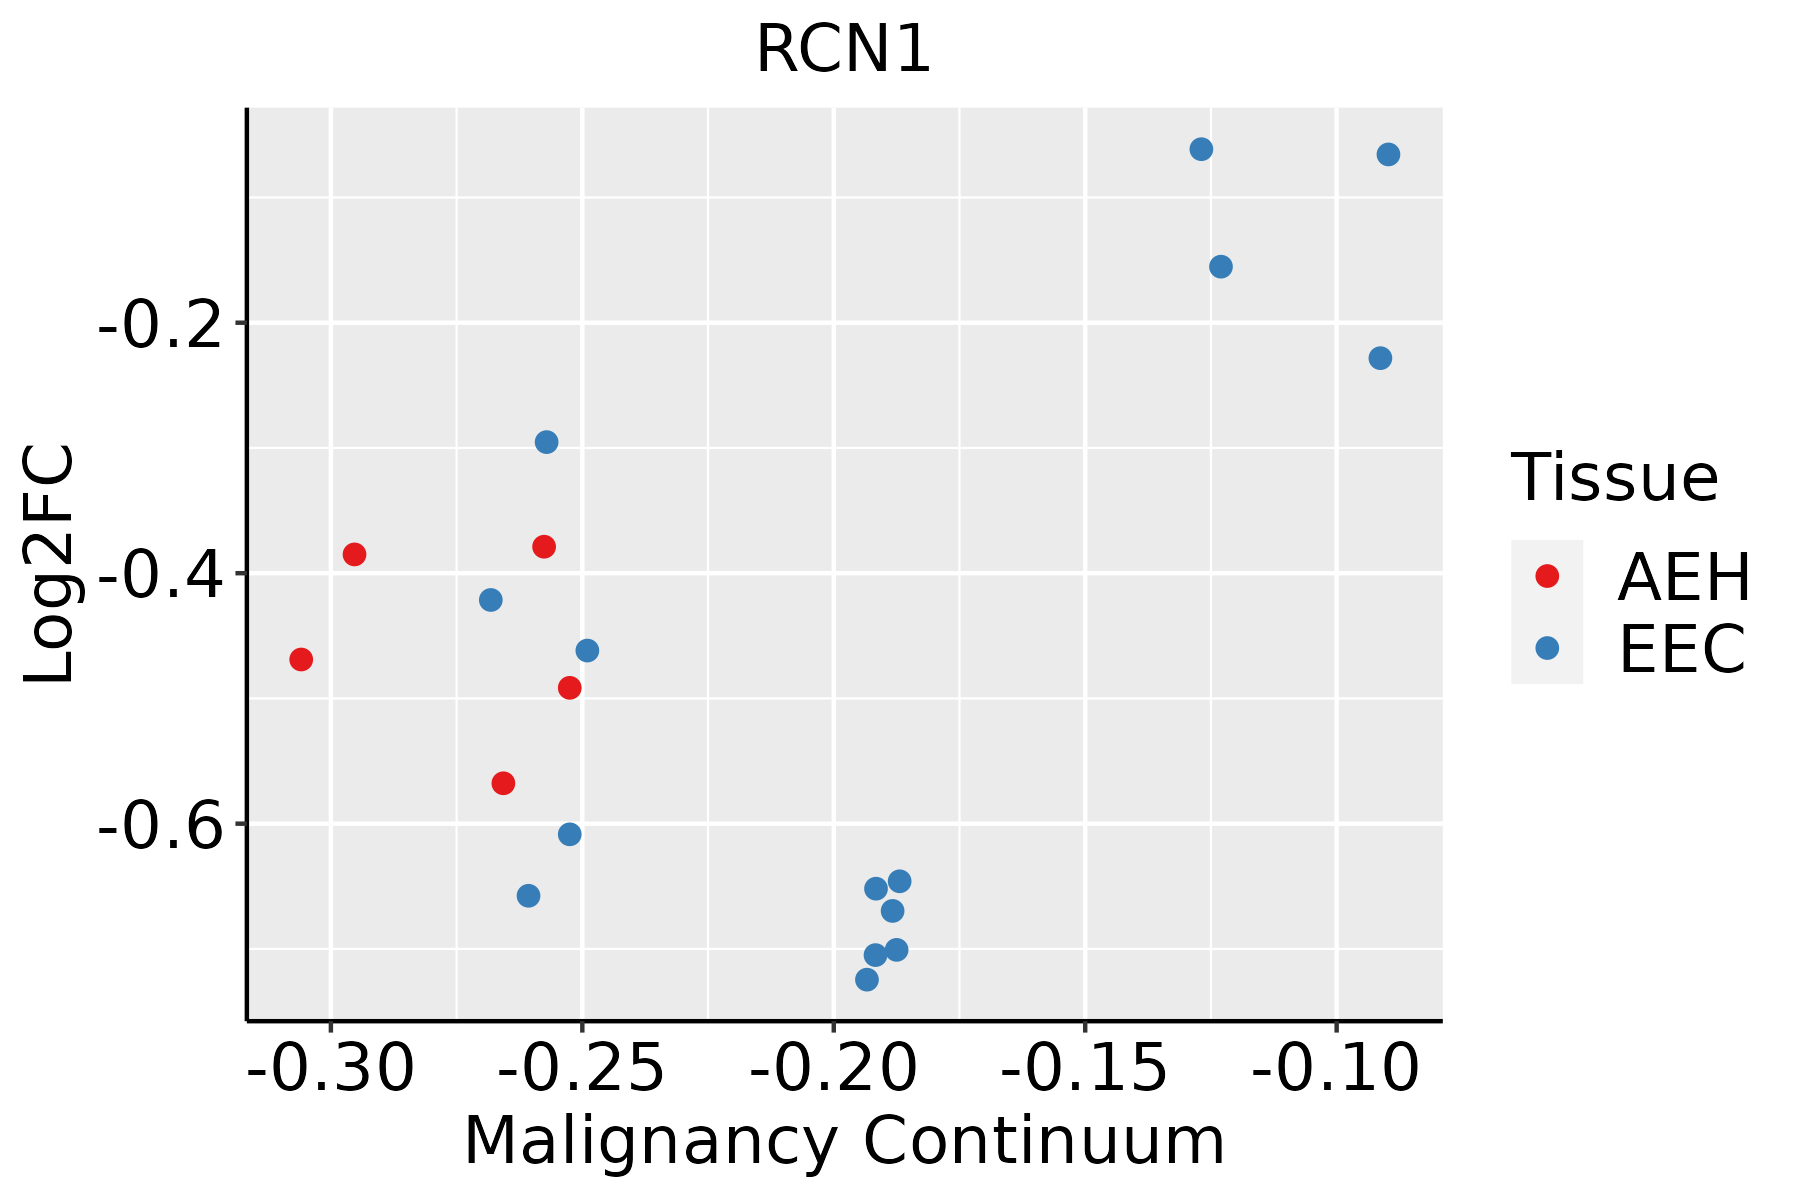 | AEH: Atypical endometrial hyperplasia |
| EEC: Endometrioid Cancer | ||
| Esophagus | 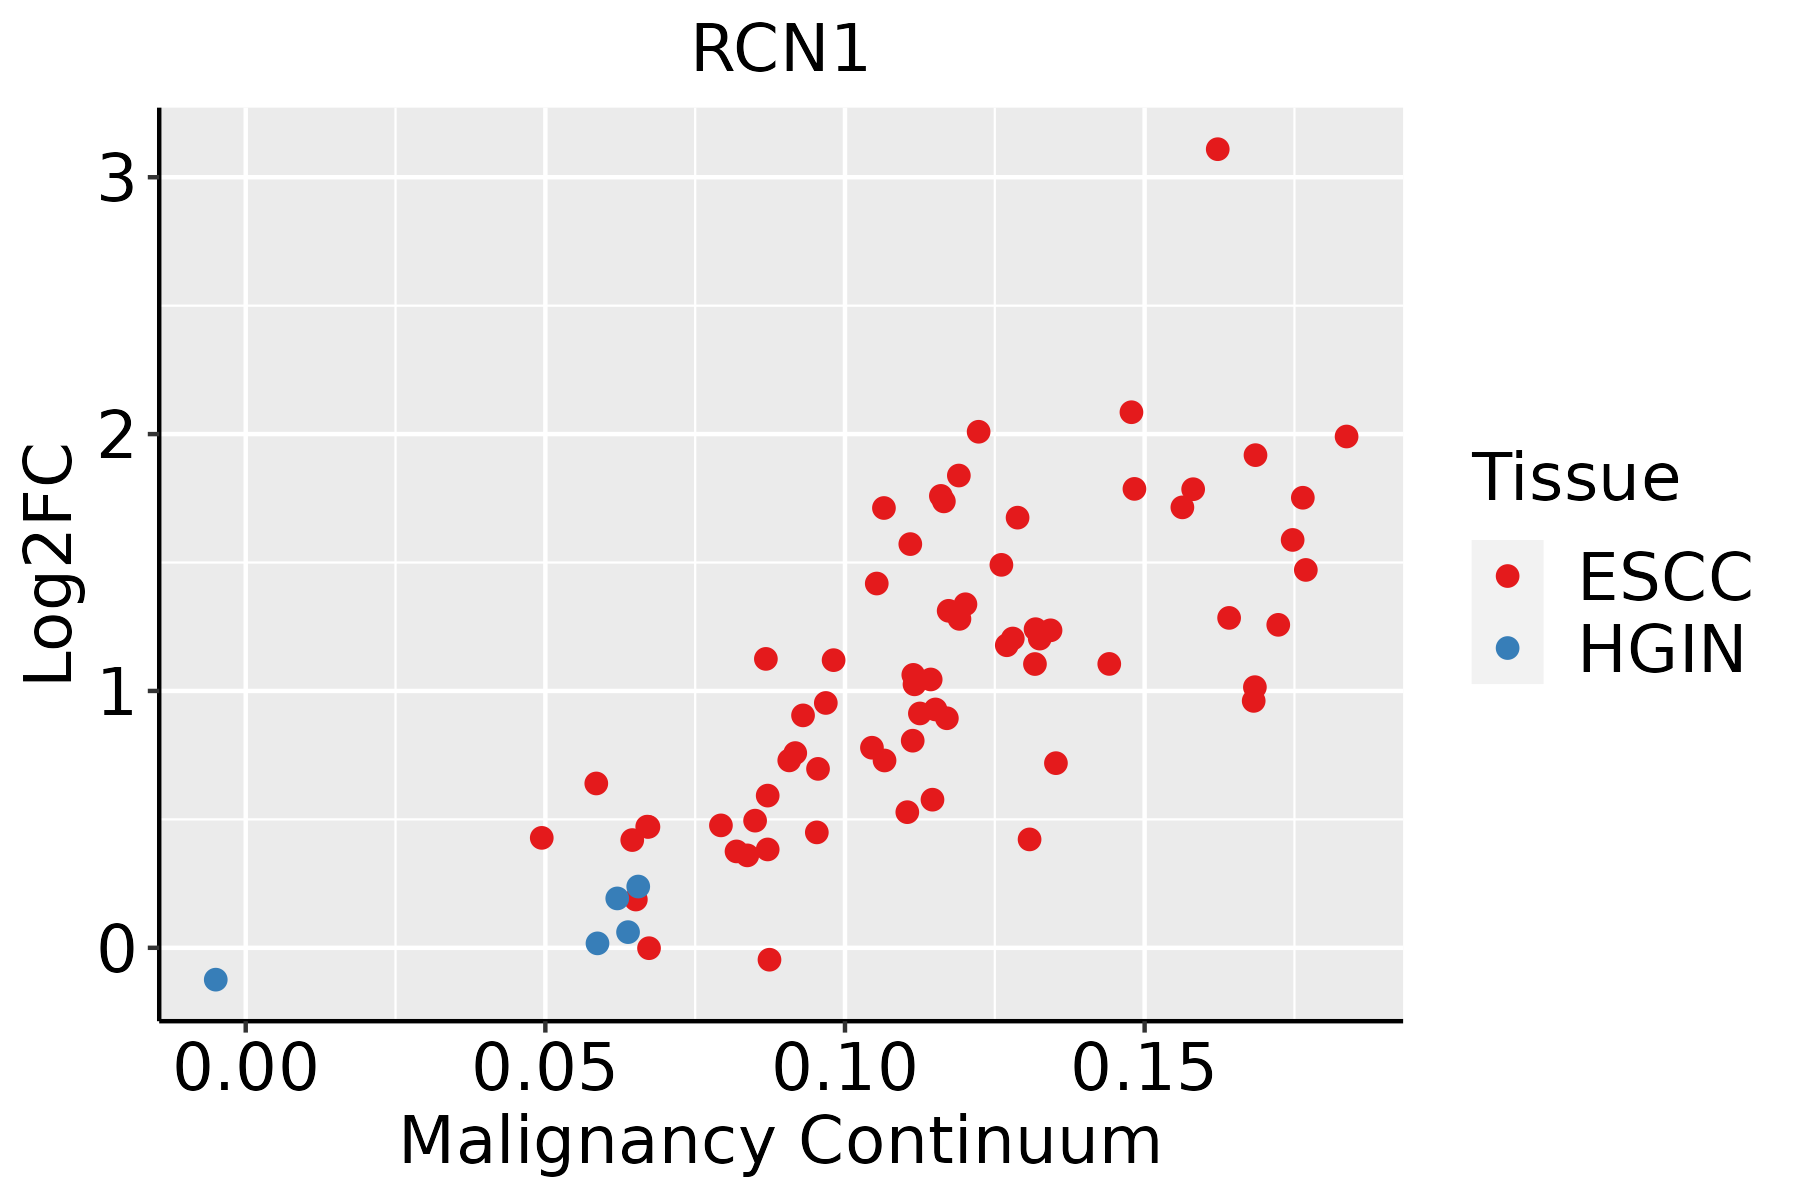 | ESCC: Esophageal squamous cell carcinoma |
| HGIN: High-grade intraepithelial neoplasias | ||
| LGIN: Low-grade intraepithelial neoplasias | ||
| Liver | 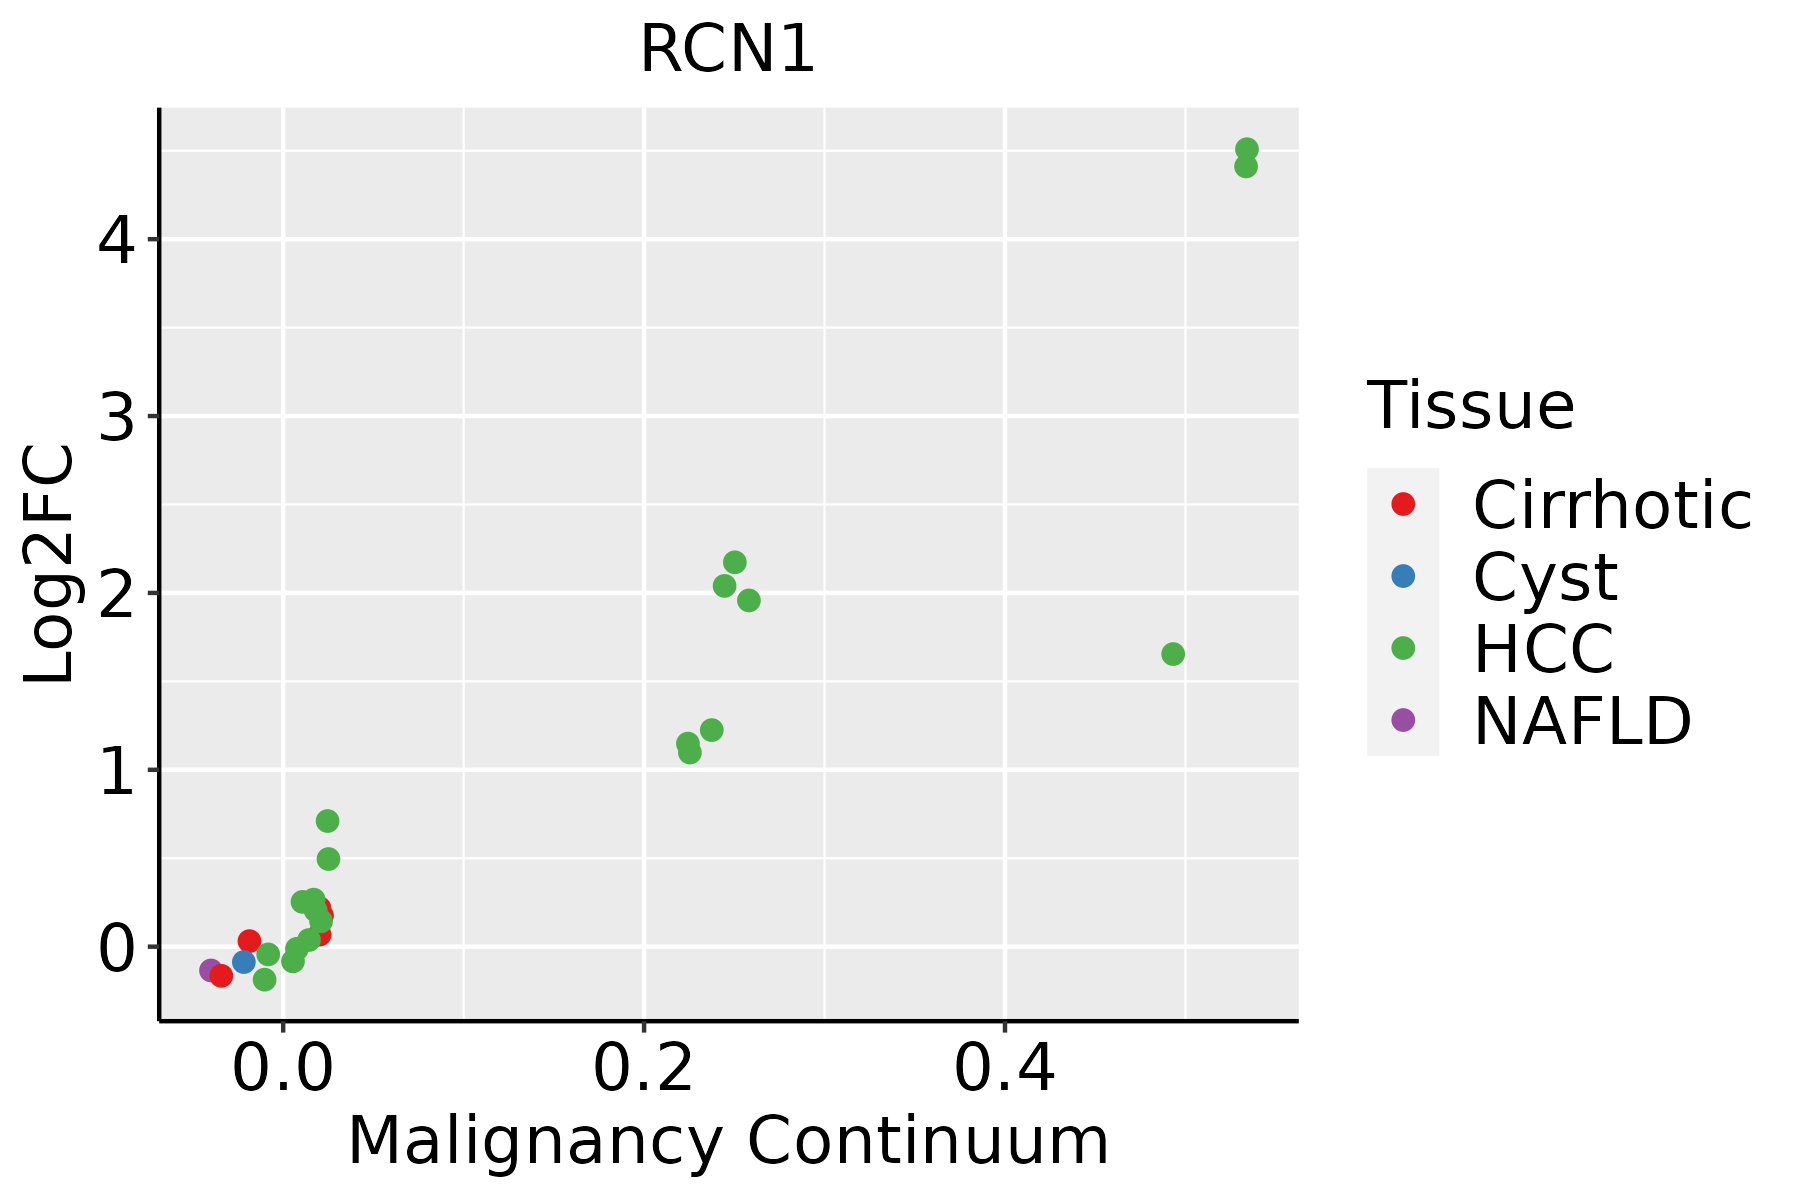 | HCC: Hepatocellular carcinoma |
| NAFLD: Non-alcoholic fatty liver disease | ||
| Oral Cavity | 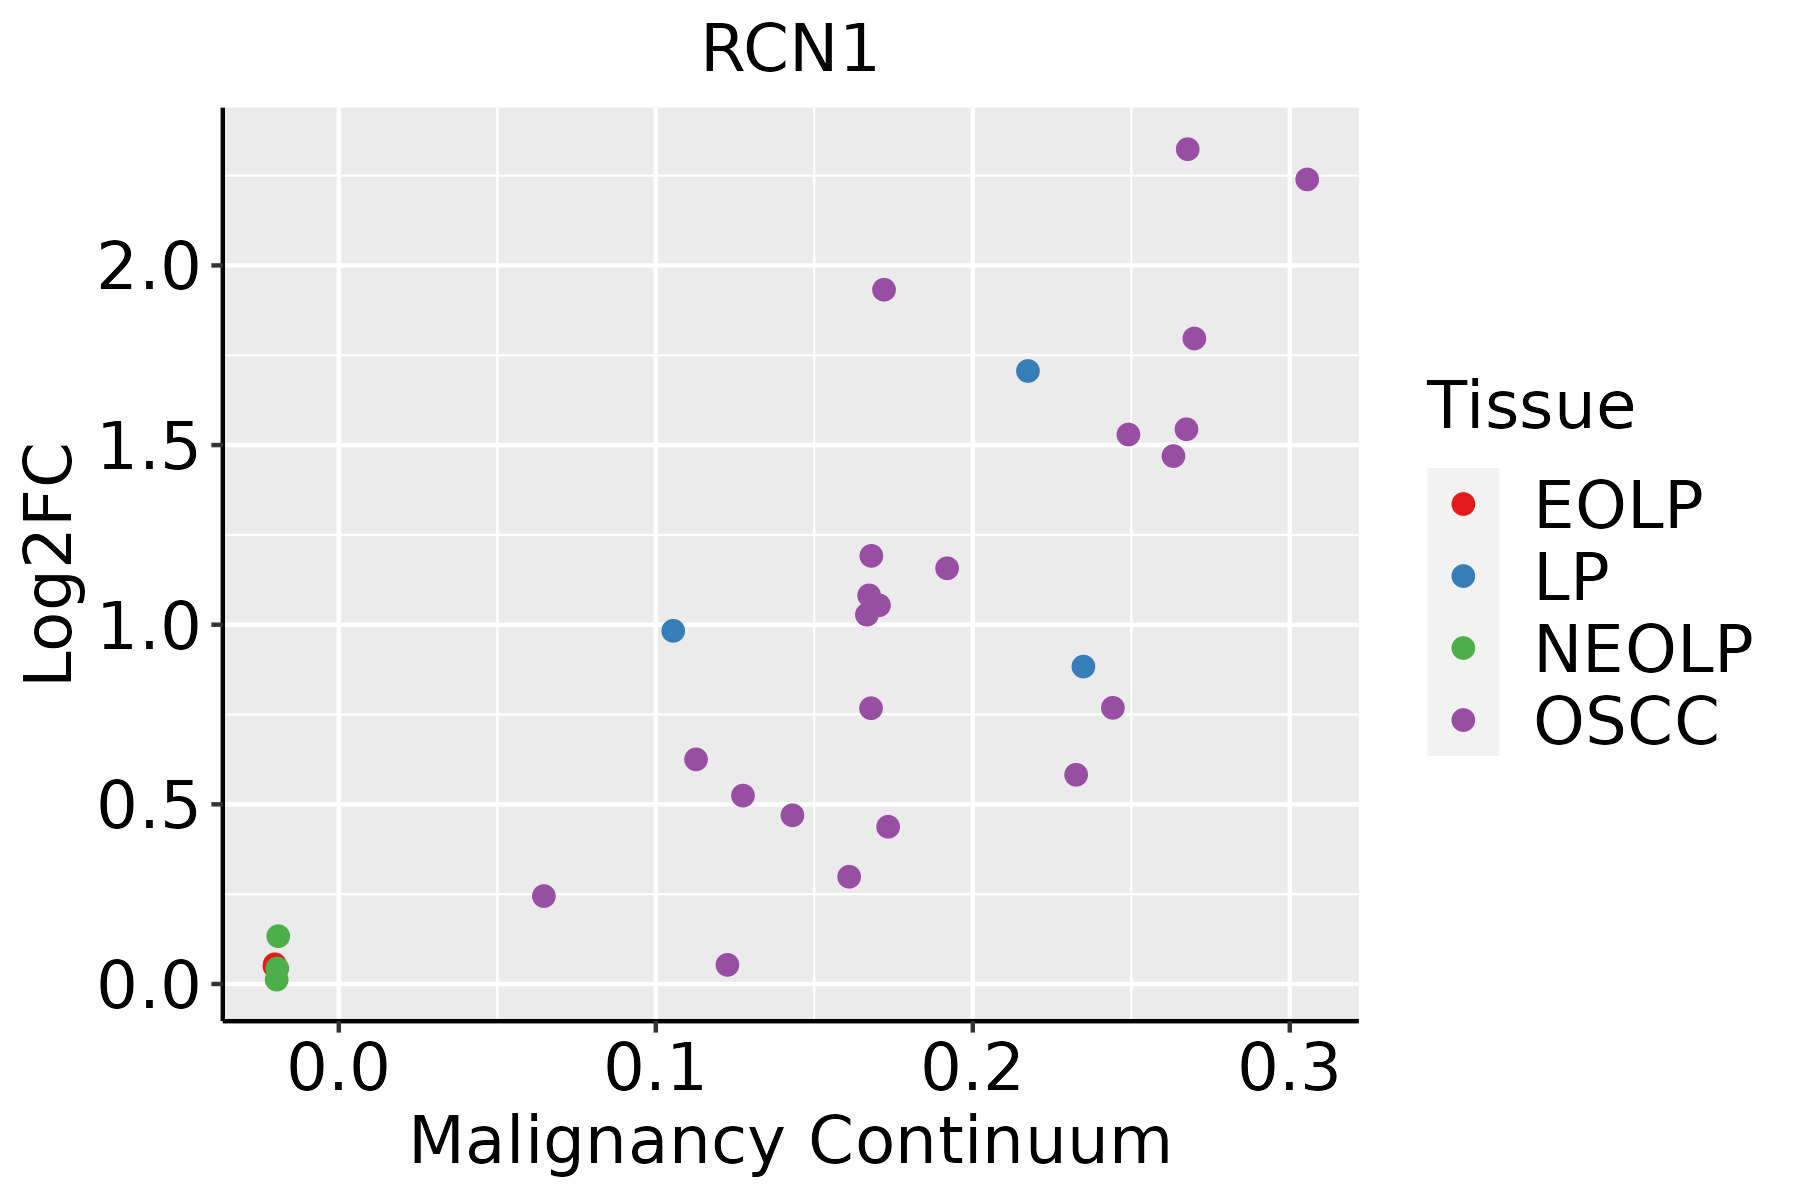 | EOLP: Erosive Oral lichen planus |
| LP: leukoplakia | ||
| NEOLP: Non-erosive oral lichen planus | ||
| OSCC: Oral squamous cell carcinoma | ||
| Prostate | 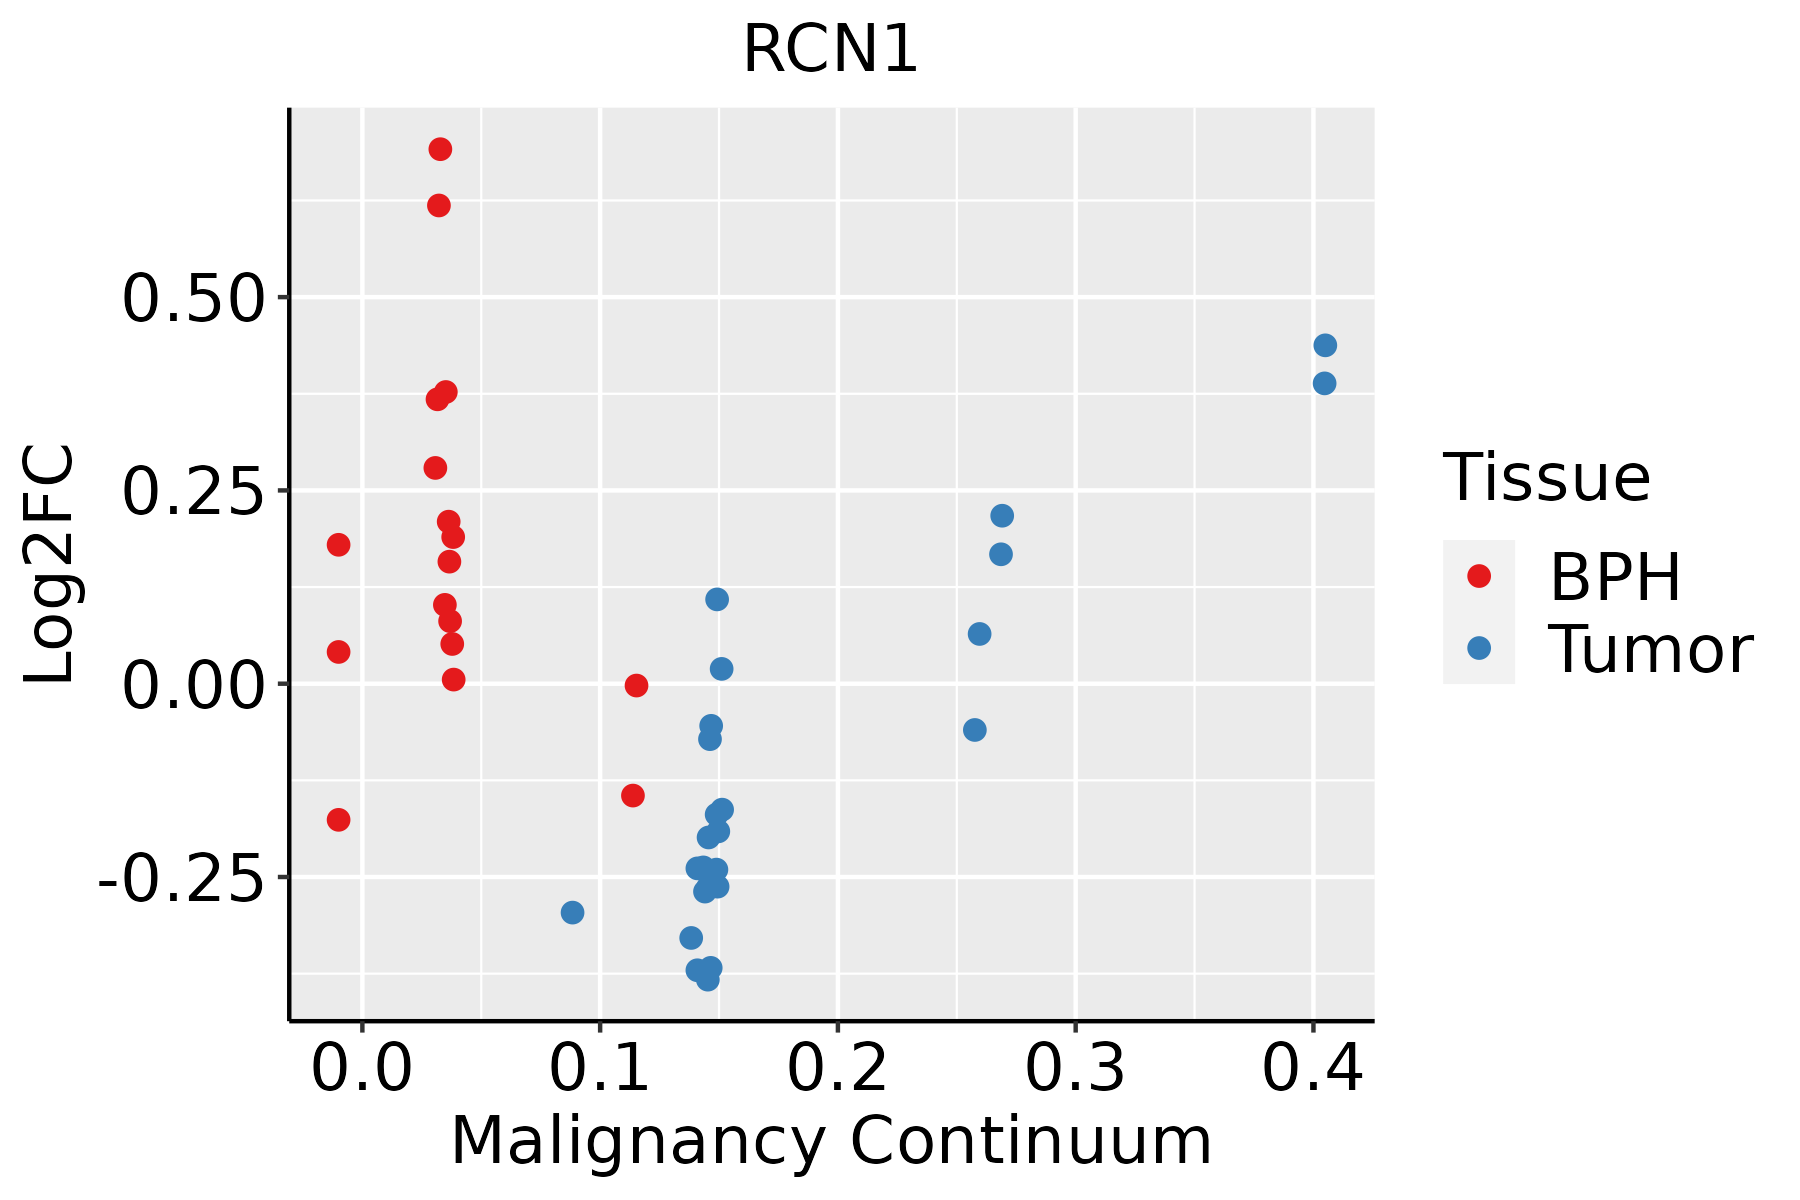 | BPH: Benign Prostatic Hyperplasia |
| Skin |  | AK: Actinic keratosis |
| cSCC: Cutaneous squamous cell carcinoma | ||
| SCCIS:squamous cell carcinoma in situ | ||
| Thyroid | 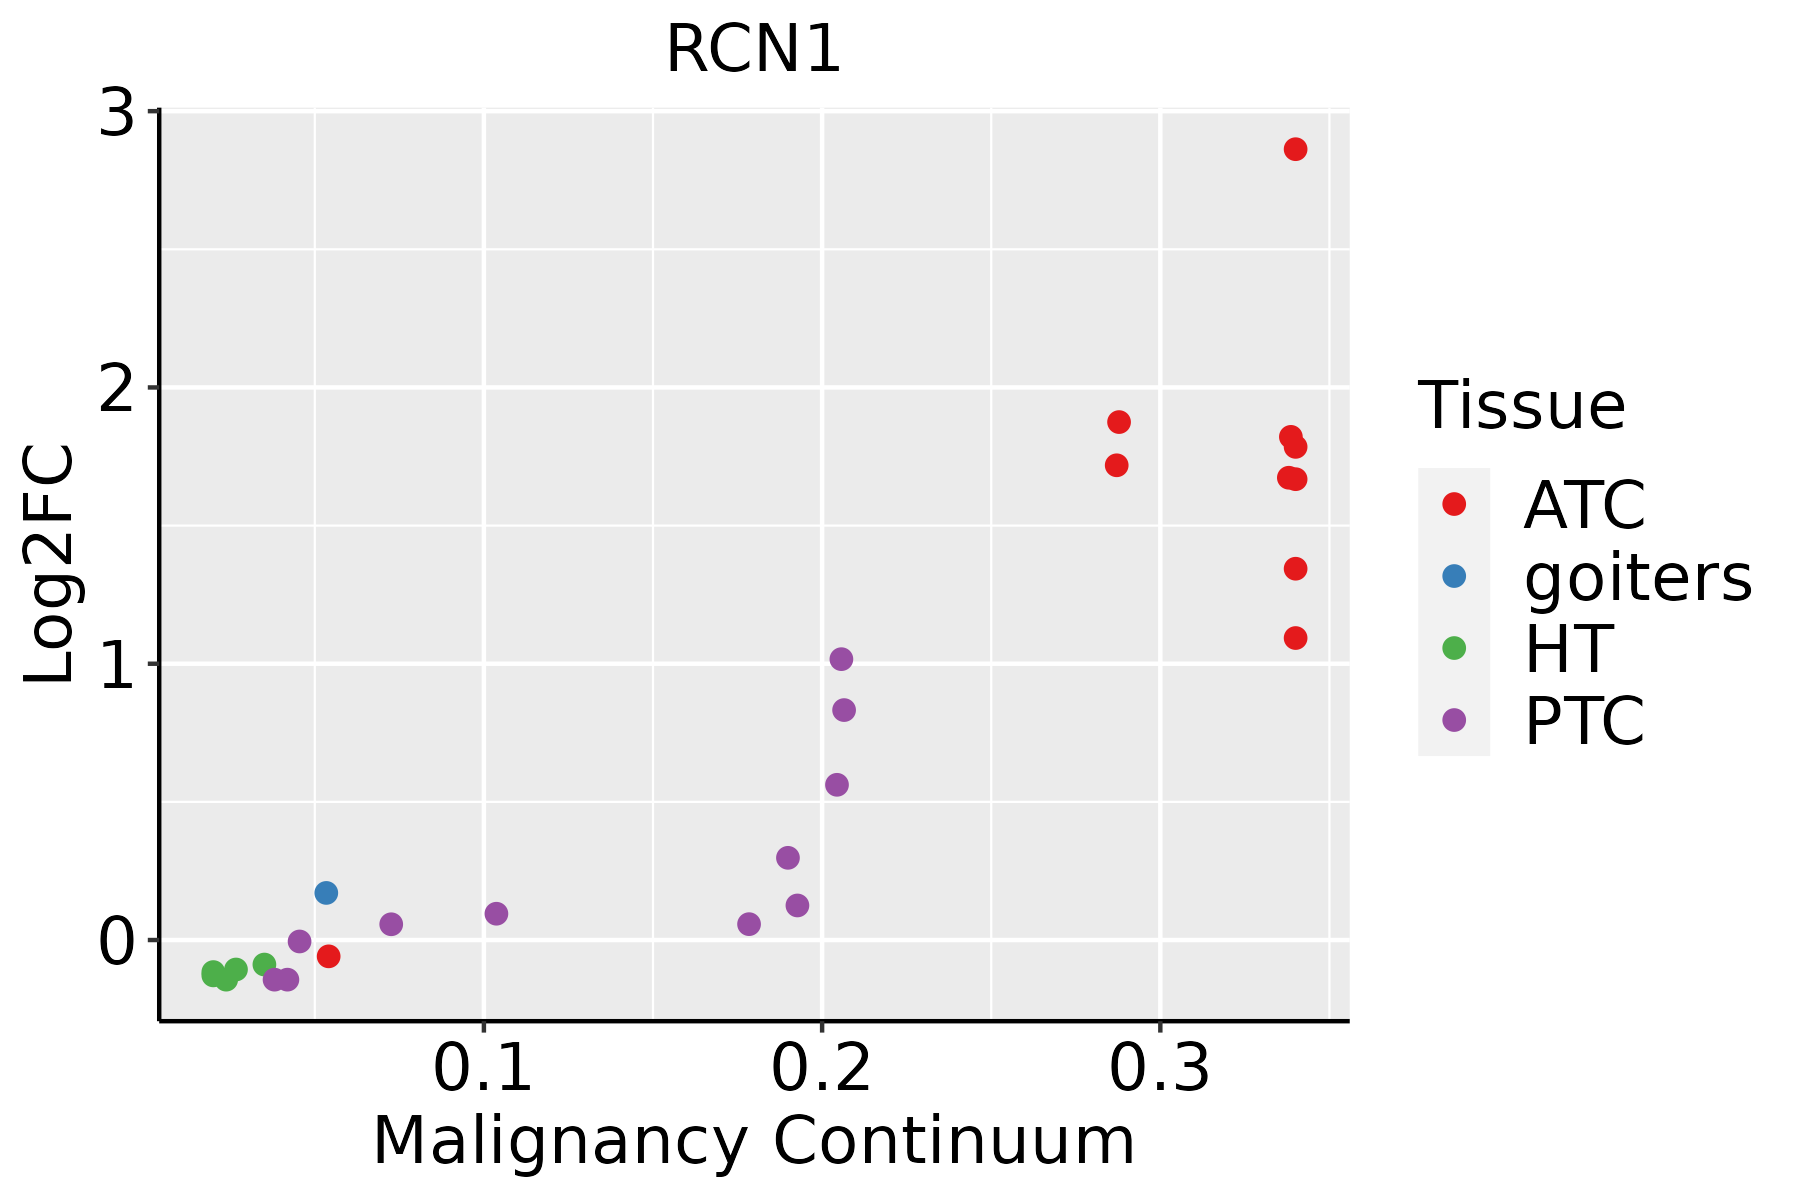 | ATC: Anaplastic thyroid cancer |
| HT: Hashimoto's thyroiditis | ||
| PTC: Papillary thyroid cancer |
| ∗log2FC in expression of this searched gene in stem-like cells from each diseased tissue sample relative to stem-like cells in normal samples in each tissue plotted against the malignancy continuum. Samples are colored based on if they are from different disease stage. |
Top |
Malignant transformation related pathway analysis |
| Find out the enriched GO biological processes and KEGG pathways involved in transition from healthy to precancer to cancer |
| Tissue | Disease Stage | Enriched GO biological Processes |
| Colorectum | AD |  |
| Colorectum | SER |  |
| Colorectum | MSS |  |
| Colorectum | MSI-H |  |
| Colorectum | FAP |  |
| ∗Top 15 enriched GO BP terms are showed in the bar plot of each disease state in each tissue. Each row represents a significant GO biological process which is colored according to the -log10(p.adjust). |
| Page: 1 2 3 4 5 6 7 8 9 |
| GO ID | Tissue | Disease Stage | Description | Gene Ratio | Bg Ratio | pvalue | p.adjust | Count |
| GO:0048193 | Colorectum | AD | Golgi vesicle transport | 109/3918 | 296/18723 | 1.80e-10 | 1.68e-08 | 109 |
| GO:0006890 | Colorectum | AD | retrograde vesicle-mediated transport, Golgi to endoplasmic reticulum | 27/3918 | 52/18723 | 7.67e-07 | 2.70e-05 | 27 |
| GO:0006888 | Colorectum | AD | endoplasmic reticulum to Golgi vesicle-mediated transport | 44/3918 | 130/18723 | 4.13e-04 | 4.68e-03 | 44 |
| GO:00481931 | Colorectum | SER | Golgi vesicle transport | 79/2897 | 296/18723 | 4.20e-07 | 2.15e-05 | 79 |
| GO:00068901 | Colorectum | SER | retrograde vesicle-mediated transport, Golgi to endoplasmic reticulum | 20/2897 | 52/18723 | 4.80e-05 | 1.18e-03 | 20 |
| GO:00068881 | Colorectum | SER | endoplasmic reticulum to Golgi vesicle-mediated transport | 34/2897 | 130/18723 | 1.13e-03 | 1.29e-02 | 34 |
| GO:00481932 | Colorectum | MSS | Golgi vesicle transport | 101/3467 | 296/18723 | 9.09e-11 | 9.77e-09 | 101 |
| GO:00068902 | Colorectum | MSS | retrograde vesicle-mediated transport, Golgi to endoplasmic reticulum | 26/3467 | 52/18723 | 2.66e-07 | 1.10e-05 | 26 |
| GO:00068882 | Colorectum | MSS | endoplasmic reticulum to Golgi vesicle-mediated transport | 44/3467 | 130/18723 | 2.17e-05 | 4.60e-04 | 44 |
| GO:0051645 | Colorectum | MSS | Golgi localization | 7/3467 | 14/18723 | 7.51e-03 | 4.72e-02 | 7 |
| GO:00068903 | Colorectum | MSI-H | retrograde vesicle-mediated transport, Golgi to endoplasmic reticulum | 13/1319 | 52/18723 | 4.72e-05 | 1.69e-03 | 13 |
| GO:00068883 | Colorectum | MSI-H | endoplasmic reticulum to Golgi vesicle-mediated transport | 22/1319 | 130/18723 | 1.05e-04 | 3.24e-03 | 22 |
| GO:00481933 | Colorectum | MSI-H | Golgi vesicle transport | 39/1319 | 296/18723 | 1.17e-04 | 3.51e-03 | 39 |
| GO:0008344 | Colorectum | MSI-H | adult locomotory behavior | 13/1319 | 71/18723 | 1.24e-03 | 2.00e-02 | 13 |
| GO:00481934 | Colorectum | FAP | Golgi vesicle transport | 77/2622 | 296/18723 | 2.86e-08 | 2.62e-06 | 77 |
| GO:00068904 | Colorectum | FAP | retrograde vesicle-mediated transport, Golgi to endoplasmic reticulum | 18/2622 | 52/18723 | 1.48e-04 | 2.29e-03 | 18 |
| GO:00516451 | Colorectum | FAP | Golgi localization | 7/2622 | 14/18723 | 1.45e-03 | 1.31e-02 | 7 |
| GO:0021700 | Colorectum | FAP | developmental maturation | 57/2622 | 280/18723 | 2.08e-03 | 1.72e-02 | 57 |
| GO:00068884 | Colorectum | FAP | endoplasmic reticulum to Golgi vesicle-mediated transport | 30/2622 | 130/18723 | 3.51e-03 | 2.53e-02 | 30 |
| GO:004819317 | Esophagus | HGIN | Golgi vesicle transport | 83/2587 | 296/18723 | 8.59e-11 | 8.89e-09 | 83 |
| Page: 1 2 3 |
| Pathway ID | Tissue | Disease Stage | Description | Gene Ratio | Bg Ratio | pvalue | p.adjust | qvalue | Count |
| Page: 1 |
Top |
Cell-cell communication analysis |
| Identification of potential cell-cell interactions between two cell types and their ligand-receptor pairs for different disease states |
| Ligand | Receptor | LRpair | Pathway | Tissue | Disease Stage |
| Page: 1 |
Top |
Single-cell gene regulatory network inference analysis |
| Find out the significant the regulons (TFs) and the target genes of each regulon across cell types for different disease states |
| TF | Cell Type | Tissue | Disease Stage | Target Gene | RSS | Regulon Activity |
| ∗The dot plots of a searched regulon are shown for all cell subpopulations in each disease state of each tissue based on the regulon specific score inferred using pySCENIC and by calculating the average expression. |
| Page: 1 |
Top |
Somatic mutation of malignant transformation related genes |
| Annotation of somatic variants for genes involved in malignant transformation |
| Hugo Symbol | Variant Class | Variant Classification | dbSNP RS | HGVSc | HGVSp | HGVSp Short | SWISSPROT | BIOTYPE | SIFT | PolyPhen | Tumor Sample Barcode | Tissue | Histology | Sex | Age | Stage | Therapy Types | Drugs | Outcome |
| RCN1 | SNV | Missense_Mutation | c.883N>T | p.Asn295Tyr | p.N295Y | Q15293 | protein_coding | deleterious(0) | possibly_damaging(0.557) | TCGA-AN-A04C-01 | Breast | breast invasive carcinoma | Female | <65 | I/II | Unknown | Unknown | SD | |
| RCN1 | SNV | Missense_Mutation | rs375977831 | c.509N>A | p.Arg170His | p.R170H | Q15293 | protein_coding | deleterious(0) | probably_damaging(0.977) | TCGA-AN-A0AK-01 | Breast | breast invasive carcinoma | Female | >=65 | I/II | Unknown | Unknown | SD |
| RCN1 | SNV | Missense_Mutation | c.539N>A | p.Leu180His | p.L180H | Q15293 | protein_coding | tolerated(0.14) | possibly_damaging(0.72) | TCGA-B6-A0X1-01 | Breast | breast invasive carcinoma | Female | <65 | I/II | Unknown | Unknown | PD | |
| RCN1 | SNV | Missense_Mutation | c.184N>A | p.Ala62Thr | p.A62T | Q15293 | protein_coding | deleterious(0) | possibly_damaging(0.887) | TCGA-BH-A18G-01 | Breast | breast invasive carcinoma | Female | >=65 | I/II | Unknown | Unknown | SD | |
| RCN1 | SNV | Missense_Mutation | novel | c.128C>T | p.Ser43Leu | p.S43L | Q15293 | protein_coding | tolerated(0.45) | benign(0.006) | TCGA-LL-A5YN-01 | Breast | breast invasive carcinoma | Female | <65 | I/II | Chemotherapy | carboplatin | SD |
| RCN1 | SNV | Missense_Mutation | novel | c.434N>G | p.Tyr145Cys | p.Y145C | Q15293 | protein_coding | deleterious(0) | probably_damaging(0.991) | TCGA-LL-A6FP-01 | Breast | breast invasive carcinoma | Female | >=65 | I/II | Hormone Therapy | arimidex | SD |
| RCN1 | SNV | Missense_Mutation | c.198G>T | p.Lys66Asn | p.K66N | Q15293 | protein_coding | tolerated(0.09) | benign(0.365) | TCGA-AA-3811-01 | Colorectum | colon adenocarcinoma | Female | >=65 | III/IV | Unknown | Unknown | PD | |
| RCN1 | SNV | Missense_Mutation | c.886N>G | p.Lys296Glu | p.K296E | Q15293 | protein_coding | deleterious(0.04) | benign(0.212) | TCGA-D5-6930-01 | Colorectum | colon adenocarcinoma | Male | >=65 | I/II | Unknown | Unknown | SD | |
| RCN1 | SNV | Missense_Mutation | novel | c.316N>G | p.Thr106Ala | p.T106A | Q15293 | protein_coding | tolerated(1) | benign(0) | TCGA-A5-A2K5-01 | Endometrium | uterine corpus endometrioid carcinoma | Female | >=65 | I/II | Unknown | Unknown | SD |
| RCN1 | SNV | Missense_Mutation | c.481C>T | p.His161Tyr | p.H161Y | Q15293 | protein_coding | deleterious(0.03) | benign(0.222) | TCGA-AJ-A3BH-01 | Endometrium | uterine corpus endometrioid carcinoma | Female | Unknown | I/II | Unknown | Unknown | SD |
| Page: 1 2 3 |
Top |
Related drugs of malignant transformation related genes |
| Identification of chemicals and drugs interact with genes involved in malignant transfromation |
| (DGIdb 4.0) |
| Entrez ID | Symbol | Category | Interaction Types | Drug Claim Name | Drug Name | PMIDs |
| Page: 1 |

Copyright 2023-Present -The University of Texas Health Science Center at Houston |