
|
|||||
|
 | |
| |
| |
| |
| |
| |
|
Gene: RCL1 |
Gene summary for RCL1 |
| Gene information | Species | Human | Gene symbol | RCL1 | Gene ID | 10171 |
| Gene name | RNA terminal phosphate cyclase like 1 | |
| Gene Alias | RNAC | |
| Cytomap | 9p24.1 | |
| Gene Type | protein-coding | GO ID | GO:0000447 | UniProtAcc | Q5VZU3 |
Top |
Malignant transformation analysis |
| Identification of the aberrant gene expression in precancerous and cancerous lesions by comparing the gene expression of stem-like cells in diseased tissues with normal stem cells |
| Entrez ID | Symbol | Replicates | Species | Organ | Tissue | Adj P-value | Log2FC | Malignancy |
| 10171 | RCL1 | LZE4T | Human | Esophagus | ESCC | 2.36e-04 | 5.48e-02 | 0.0811 |
| 10171 | RCL1 | LZE7T | Human | Esophagus | ESCC | 6.52e-05 | 2.17e-01 | 0.0667 |
| 10171 | RCL1 | LZE8T | Human | Esophagus | ESCC | 8.04e-04 | 3.67e-03 | 0.067 |
| 10171 | RCL1 | LZE24T | Human | Esophagus | ESCC | 6.02e-13 | 2.86e-01 | 0.0596 |
| 10171 | RCL1 | LZE21T | Human | Esophagus | ESCC | 1.12e-02 | 1.13e-01 | 0.0655 |
| 10171 | RCL1 | P2T-E | Human | Esophagus | ESCC | 1.91e-19 | 1.86e-01 | 0.1177 |
| 10171 | RCL1 | P4T-E | Human | Esophagus | ESCC | 2.27e-07 | 2.10e-01 | 0.1323 |
| 10171 | RCL1 | P5T-E | Human | Esophagus | ESCC | 3.86e-13 | 2.02e-01 | 0.1327 |
| 10171 | RCL1 | P8T-E | Human | Esophagus | ESCC | 1.24e-08 | 3.09e-02 | 0.0889 |
| 10171 | RCL1 | P9T-E | Human | Esophagus | ESCC | 1.15e-19 | 3.72e-01 | 0.1131 |
| 10171 | RCL1 | P10T-E | Human | Esophagus | ESCC | 3.52e-30 | 2.82e-01 | 0.116 |
| 10171 | RCL1 | P11T-E | Human | Esophagus | ESCC | 1.01e-06 | 3.60e-01 | 0.1426 |
| 10171 | RCL1 | P12T-E | Human | Esophagus | ESCC | 6.22e-18 | 3.96e-01 | 0.1122 |
| 10171 | RCL1 | P15T-E | Human | Esophagus | ESCC | 3.10e-15 | 3.35e-01 | 0.1149 |
| 10171 | RCL1 | P16T-E | Human | Esophagus | ESCC | 4.75e-12 | 1.45e-01 | 0.1153 |
| 10171 | RCL1 | P20T-E | Human | Esophagus | ESCC | 1.38e-13 | 2.18e-01 | 0.1124 |
| 10171 | RCL1 | P21T-E | Human | Esophagus | ESCC | 7.35e-18 | 2.08e-01 | 0.1617 |
| 10171 | RCL1 | P22T-E | Human | Esophagus | ESCC | 3.68e-07 | 5.97e-03 | 0.1236 |
| 10171 | RCL1 | P23T-E | Human | Esophagus | ESCC | 5.34e-18 | 3.68e-01 | 0.108 |
| 10171 | RCL1 | P24T-E | Human | Esophagus | ESCC | 1.80e-46 | 1.81e+00 | 0.1287 |
| Page: 1 2 3 4 |
| Tissue | Expression Dynamics | Abbreviation |
| Esophagus | 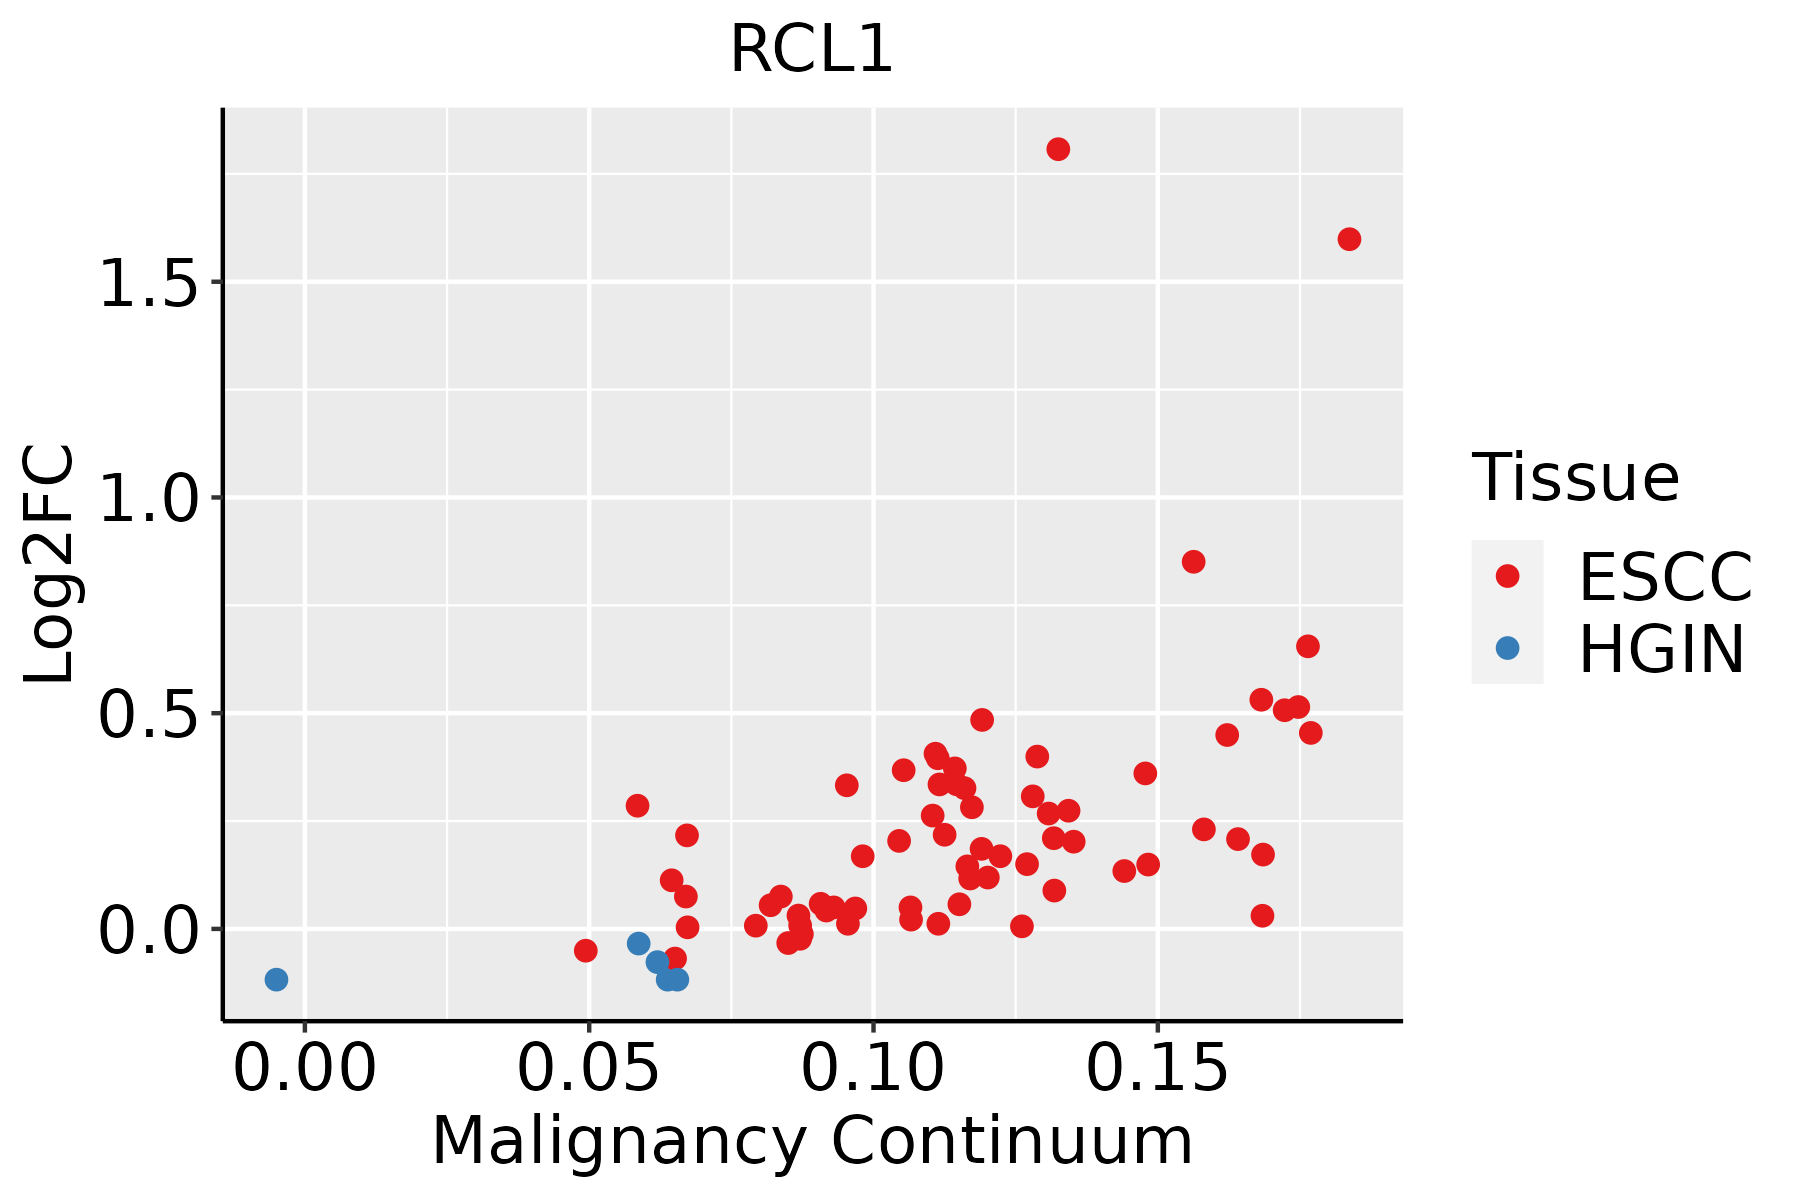 | ESCC: Esophageal squamous cell carcinoma |
| HGIN: High-grade intraepithelial neoplasias | ||
| LGIN: Low-grade intraepithelial neoplasias | ||
| Oral Cavity |  | EOLP: Erosive Oral lichen planus |
| LP: leukoplakia | ||
| NEOLP: Non-erosive oral lichen planus | ||
| OSCC: Oral squamous cell carcinoma |
| ∗log2FC in expression of this searched gene in stem-like cells from each diseased tissue sample relative to stem-like cells in normal samples in each tissue plotted against the malignancy continuum. Samples are colored based on if they are from different disease stage. |
Top |
Malignant transformation related pathway analysis |
| Find out the enriched GO biological processes and KEGG pathways involved in transition from healthy to precancer to cancer |
| Tissue | Disease Stage | Enriched GO biological Processes |
| Colorectum | AD |  |
| Colorectum | SER |  |
| Colorectum | MSS |  |
| Colorectum | MSI-H |  |
| Colorectum | FAP |  |
| ∗Top 15 enriched GO BP terms are showed in the bar plot of each disease state in each tissue. Each row represents a significant GO biological process which is colored according to the -log10(p.adjust). |
| Page: 1 2 3 4 5 6 7 8 9 |
| GO ID | Tissue | Disease Stage | Description | Gene Ratio | Bg Ratio | pvalue | p.adjust | Count |
| GO:0098742 | Cervix | N_HPV | cell-cell adhesion via plasma-membrane adhesion molecules | 17/534 | 273/18723 | 2.26e-03 | 2.11e-02 | 17 |
| GO:00508086 | Endometrium | AEH | synapse organization | 67/2100 | 426/18723 | 2.67e-03 | 1.94e-02 | 67 |
| GO:005080812 | Endometrium | EEC | synapse organization | 68/2168 | 426/18723 | 3.73e-03 | 2.49e-02 | 68 |
| GO:0022613111 | Esophagus | ESCC | ribonucleoprotein complex biogenesis | 365/8552 | 463/18723 | 1.74e-49 | 1.11e-45 | 365 |
| GO:0042254111 | Esophagus | ESCC | ribosome biogenesis | 252/8552 | 299/18723 | 3.27e-44 | 1.04e-40 | 252 |
| GO:003447015 | Esophagus | ESCC | ncRNA processing | 300/8552 | 395/18723 | 3.09e-35 | 3.26e-32 | 300 |
| GO:0016072110 | Esophagus | ESCC | rRNA metabolic process | 197/8552 | 236/18723 | 1.31e-33 | 1.18e-30 | 197 |
| GO:0006364110 | Esophagus | ESCC | rRNA processing | 189/8552 | 225/18723 | 4.88e-33 | 3.87e-30 | 189 |
| GO:003466012 | Esophagus | ESCC | ncRNA metabolic process | 346/8552 | 485/18723 | 4.35e-31 | 2.51e-28 | 346 |
| GO:0042274111 | Esophagus | ESCC | ribosomal small subunit biogenesis | 67/8552 | 73/18723 | 6.62e-17 | 5.38e-15 | 67 |
| GO:00905013 | Esophagus | ESCC | RNA phosphodiester bond hydrolysis | 110/8552 | 152/18723 | 1.95e-11 | 6.81e-10 | 110 |
| GO:00304904 | Esophagus | ESCC | maturation of SSU-rRNA | 45/8552 | 50/18723 | 5.07e-11 | 1.63e-09 | 45 |
| GO:00903053 | Esophagus | ESCC | nucleic acid phosphodiester bond hydrolysis | 163/8552 | 261/18723 | 3.07e-08 | 5.73e-07 | 163 |
| GO:00004623 | Esophagus | ESCC | maturation of SSU-rRNA from tricistronic rRNA transcript (SSU-rRNA, 5.8S rRNA, LSU-rRNA) | 32/8552 | 37/18723 | 2.96e-07 | 4.23e-06 | 32 |
| GO:00004603 | Esophagus | ESCC | maturation of 5.8S rRNA | 30/8552 | 35/18723 | 1.07e-06 | 1.34e-05 | 30 |
| GO:00004693 | Esophagus | ESCC | cleavage involved in rRNA processing | 24/8552 | 27/18723 | 3.48e-06 | 3.84e-05 | 24 |
| GO:00004663 | Esophagus | ESCC | maturation of 5.8S rRNA from tricistronic rRNA transcript (SSU-rRNA, 5.8S rRNA, LSU-rRNA) | 21/8552 | 24/18723 | 2.57e-05 | 2.17e-04 | 21 |
| GO:00905023 | Esophagus | ESCC | RNA phosphodiester bond hydrolysis, endonucleolytic | 55/8552 | 82/18723 | 7.34e-05 | 5.51e-04 | 55 |
| GO:00004783 | Esophagus | ESCC | endonucleolytic cleavage involved in rRNA processing | 14/8552 | 15/18723 | 1.47e-04 | 9.85e-04 | 14 |
| GO:00004793 | Esophagus | ESCC | endonucleolytic cleavage of tricistronic rRNA transcript (SSU-rRNA, 5.8S rRNA, LSU-rRNA) | 14/8552 | 15/18723 | 1.47e-04 | 9.85e-04 | 14 |
| Page: 1 2 3 |
| Pathway ID | Tissue | Disease Stage | Description | Gene Ratio | Bg Ratio | pvalue | p.adjust | qvalue | Count |
| Page: 1 |
Top |
Cell-cell communication analysis |
| Identification of potential cell-cell interactions between two cell types and their ligand-receptor pairs for different disease states |
| Ligand | Receptor | LRpair | Pathway | Tissue | Disease Stage |
| Page: 1 |
Top |
Single-cell gene regulatory network inference analysis |
| Find out the significant the regulons (TFs) and the target genes of each regulon across cell types for different disease states |
| TF | Cell Type | Tissue | Disease Stage | Target Gene | RSS | Regulon Activity |
| ∗The dot plots of a searched regulon are shown for all cell subpopulations in each disease state of each tissue based on the regulon specific score inferred using pySCENIC and by calculating the average expression. |
| Page: 1 |
Top |
Somatic mutation of malignant transformation related genes |
| Annotation of somatic variants for genes involved in malignant transformation |
| Hugo Symbol | Variant Class | Variant Classification | dbSNP RS | HGVSc | HGVSp | HGVSp Short | SWISSPROT | BIOTYPE | SIFT | PolyPhen | Tumor Sample Barcode | Tissue | Histology | Sex | Age | Stage | Therapy Types | Drugs | Outcome |
| RCL1 | SNV | Missense_Mutation | c.277N>T | p.Arg93Cys | p.R93C | Q9Y2P8 | protein_coding | deleterious(0) | probably_damaging(0.997) | TCGA-BH-A0EE-01 | Breast | breast invasive carcinoma | Female | >=65 | I/II | Chemotherapy | docetaxel | SD | |
| RCL1 | SNV | Missense_Mutation | rs781574564 | c.877G>A | p.Val293Ile | p.V293I | Q9Y2P8 | protein_coding | tolerated(0.21) | benign(0.079) | TCGA-AA-A010-01 | Colorectum | colon adenocarcinoma | Female | <65 | I/II | Chemotherapy | folinic | CR |
| RCL1 | SNV | Missense_Mutation | rs745330205 | c.614N>T | p.Ala205Val | p.A205V | Q9Y2P8 | protein_coding | tolerated(0.09) | benign(0.053) | TCGA-AD-6964-01 | Colorectum | colon adenocarcinoma | Male | <65 | III/IV | Chemotherapy | folfox | PD |
| RCL1 | SNV | Missense_Mutation | c.1057G>T | p.Gly353Trp | p.G353W | Q9Y2P8 | protein_coding | deleterious(0) | possibly_damaging(0.825) | TCGA-G4-6309-01 | Colorectum | colon adenocarcinoma | Female | <65 | III/IV | Chemotherapy | xeloda | PD | |
| RCL1 | SNV | Missense_Mutation | c.353N>T | p.Arg118Leu | p.R118L | Q9Y2P8 | protein_coding | deleterious(0.03) | benign(0.044) | TCGA-QG-A5Z2-01 | Colorectum | colon adenocarcinoma | Male | <65 | I/II | Unknown | Unknown | SD | |
| RCL1 | SNV | Missense_Mutation | c.712N>C | p.Ser238Pro | p.S238P | Q9Y2P8 | protein_coding | deleterious(0) | probably_damaging(0.996) | TCGA-F5-6861-01 | Colorectum | rectum adenocarcinoma | Female | <65 | I/II | Unknown | Unknown | SD | |
| RCL1 | SNV | Missense_Mutation | rs142051884 | c.985N>T | p.Arg329Trp | p.R329W | Q9Y2P8 | protein_coding | deleterious(0) | possibly_damaging(0.849) | TCGA-A5-A2K5-01 | Endometrium | uterine corpus endometrioid carcinoma | Female | >=65 | I/II | Unknown | Unknown | SD |
| RCL1 | SNV | Missense_Mutation | novel | c.289N>C | p.Tyr97His | p.Y97H | Q9Y2P8 | protein_coding | deleterious(0) | probably_damaging(0.996) | TCGA-AJ-A3BH-01 | Endometrium | uterine corpus endometrioid carcinoma | Female | Unknown | I/II | Unknown | Unknown | SD |
| RCL1 | SNV | Missense_Mutation | novel | c.32C>G | p.Ala11Gly | p.A11G | Q9Y2P8 | protein_coding | tolerated(0.11) | benign(0) | TCGA-AP-A056-01 | Endometrium | uterine corpus endometrioid carcinoma | Female | <65 | I/II | Unknown | Unknown | SD |
| RCL1 | SNV | Missense_Mutation | c.344T>C | p.Ile115Thr | p.I115T | Q9Y2P8 | protein_coding | tolerated(0.06) | possibly_damaging(0.606) | TCGA-AX-A05Z-01 | Endometrium | uterine corpus endometrioid carcinoma | Female | <65 | III/IV | Chemotherapy | adriamycin | SD |
| Page: 1 2 3 |
Top |
Related drugs of malignant transformation related genes |
| Identification of chemicals and drugs interact with genes involved in malignant transfromation |
| (DGIdb 4.0) |
| Entrez ID | Symbol | Category | Interaction Types | Drug Claim Name | Drug Name | PMIDs |
| Page: 1 |

Copyright 2023-Present -The University of Texas Health Science Center at Houston |