
|
|||||
|
 | |
| |
| |
| |
| |
| |
|
Gene: RCHY1 |
Gene summary for RCHY1 |
| Gene information | Species | Human | Gene symbol | RCHY1 | Gene ID | 25898 |
| Gene name | ring finger and CHY zinc finger domain containing 1 | |
| Gene Alias | ARNIP | |
| Cytomap | 4q21.1 | |
| Gene Type | protein-coding | GO ID | GO:0000731 | UniProtAcc | Q96PM5 |
Top |
Malignant transformation analysis |
| Identification of the aberrant gene expression in precancerous and cancerous lesions by comparing the gene expression of stem-like cells in diseased tissues with normal stem cells |
| Entrez ID | Symbol | Replicates | Species | Organ | Tissue | Adj P-value | Log2FC | Malignancy |
| 25898 | RCHY1 | LZE3D | Human | Esophagus | HGIN | 4.81e-03 | 5.15e-01 | 0.0668 |
| 25898 | RCHY1 | LZE4T | Human | Esophagus | ESCC | 3.35e-09 | 2.84e-01 | 0.0811 |
| 25898 | RCHY1 | LZE7T | Human | Esophagus | ESCC | 5.11e-08 | 4.36e-01 | 0.0667 |
| 25898 | RCHY1 | LZE8T | Human | Esophagus | ESCC | 1.43e-05 | 2.06e-01 | 0.067 |
| 25898 | RCHY1 | LZE22T | Human | Esophagus | ESCC | 2.50e-03 | 2.38e-01 | 0.068 |
| 25898 | RCHY1 | LZE24T | Human | Esophagus | ESCC | 1.31e-06 | 1.42e-01 | 0.0596 |
| 25898 | RCHY1 | LZE6T | Human | Esophagus | ESCC | 1.81e-10 | 2.70e-01 | 0.0845 |
| 25898 | RCHY1 | P1T-E | Human | Esophagus | ESCC | 4.56e-03 | 2.26e-01 | 0.0875 |
| 25898 | RCHY1 | P2T-E | Human | Esophagus | ESCC | 9.04e-36 | 6.12e-01 | 0.1177 |
| 25898 | RCHY1 | P4T-E | Human | Esophagus | ESCC | 6.28e-29 | 5.74e-01 | 0.1323 |
| 25898 | RCHY1 | P5T-E | Human | Esophagus | ESCC | 1.34e-08 | 1.58e-01 | 0.1327 |
| 25898 | RCHY1 | P8T-E | Human | Esophagus | ESCC | 3.47e-18 | 2.51e-01 | 0.0889 |
| 25898 | RCHY1 | P9T-E | Human | Esophagus | ESCC | 2.31e-05 | 9.26e-02 | 0.1131 |
| 25898 | RCHY1 | P10T-E | Human | Esophagus | ESCC | 5.59e-17 | 3.05e-01 | 0.116 |
| 25898 | RCHY1 | P11T-E | Human | Esophagus | ESCC | 6.72e-13 | 4.08e-01 | 0.1426 |
| 25898 | RCHY1 | P12T-E | Human | Esophagus | ESCC | 4.63e-18 | 3.12e-01 | 0.1122 |
| 25898 | RCHY1 | P15T-E | Human | Esophagus | ESCC | 2.00e-21 | 4.65e-01 | 0.1149 |
| 25898 | RCHY1 | P16T-E | Human | Esophagus | ESCC | 2.60e-20 | 4.52e-01 | 0.1153 |
| 25898 | RCHY1 | P17T-E | Human | Esophagus | ESCC | 1.88e-02 | 1.53e-01 | 0.1278 |
| 25898 | RCHY1 | P20T-E | Human | Esophagus | ESCC | 6.31e-08 | 9.54e-02 | 0.1124 |
| Page: 1 2 3 4 |
| Tissue | Expression Dynamics | Abbreviation |
| Esophagus | 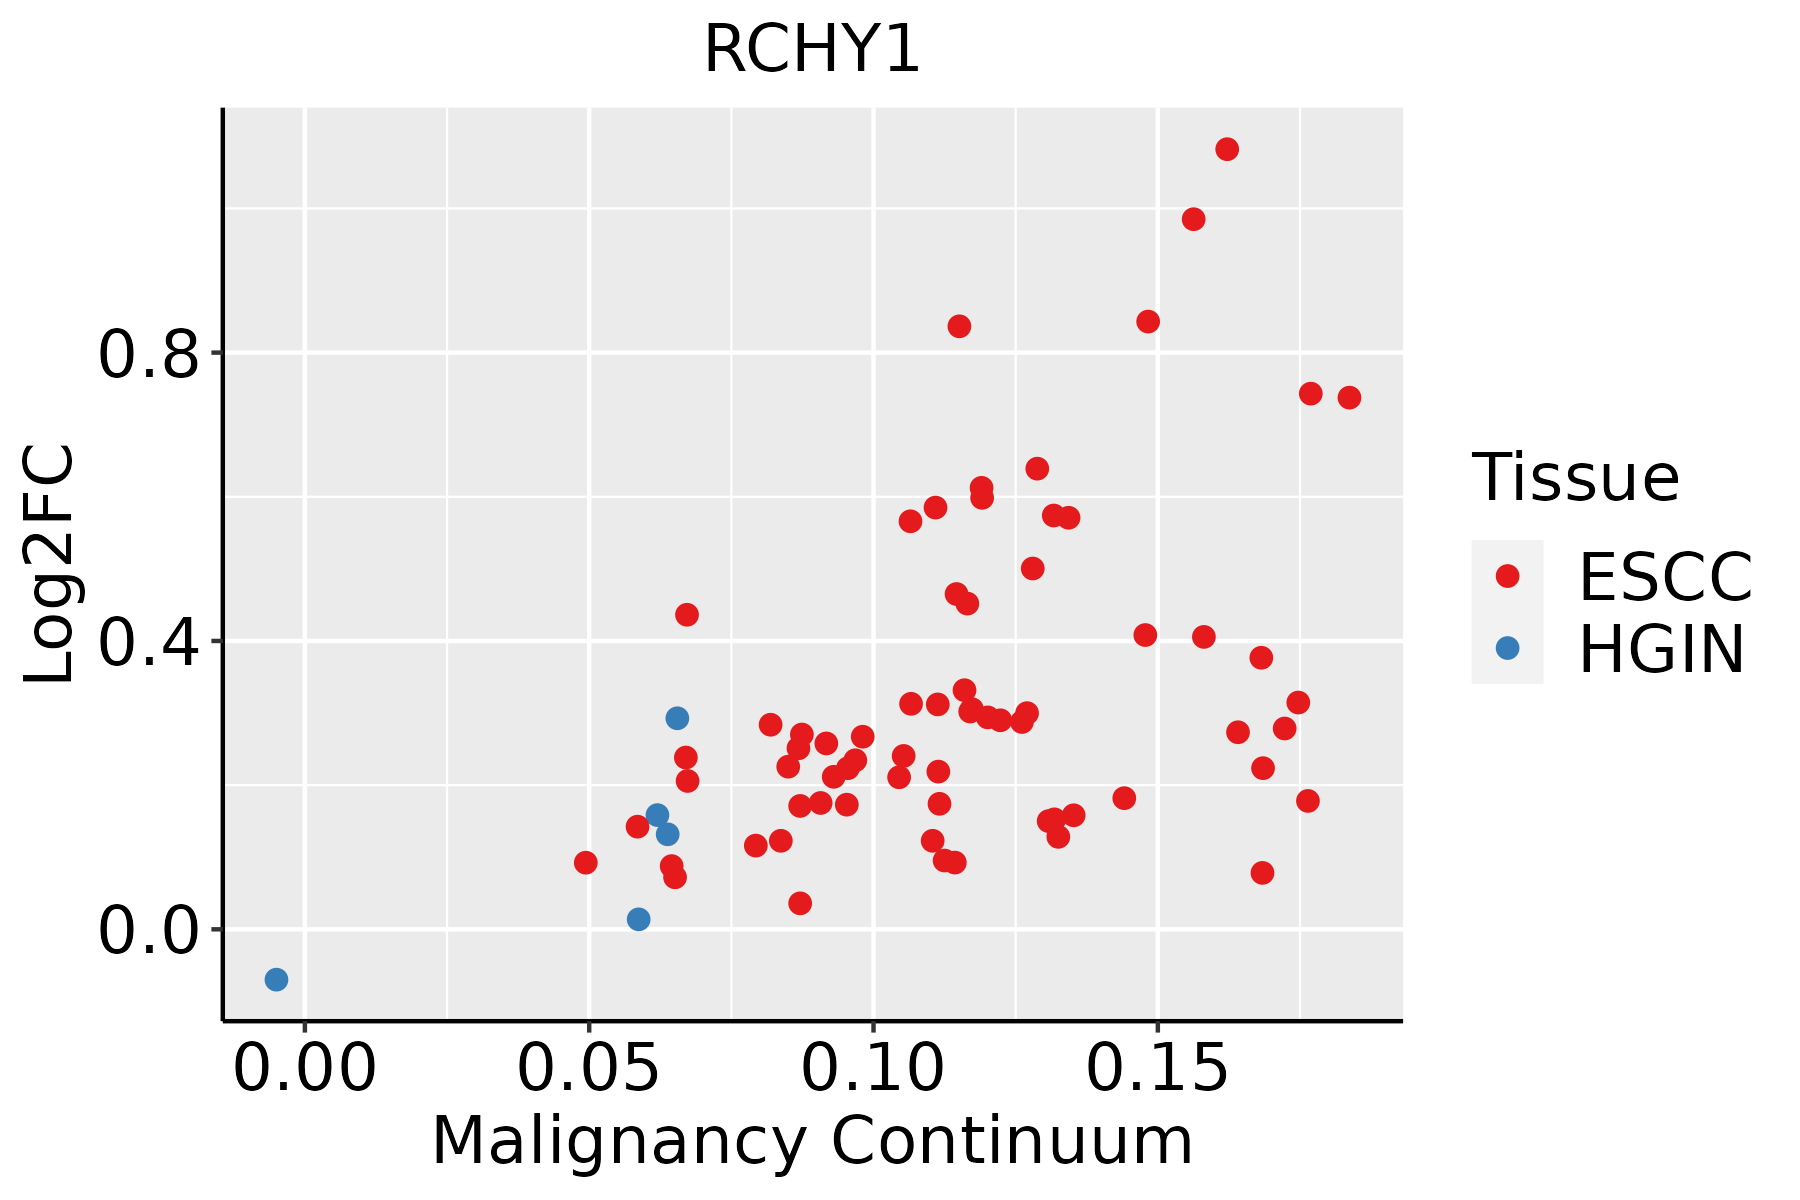 | ESCC: Esophageal squamous cell carcinoma |
| HGIN: High-grade intraepithelial neoplasias | ||
| LGIN: Low-grade intraepithelial neoplasias | ||
| Liver | 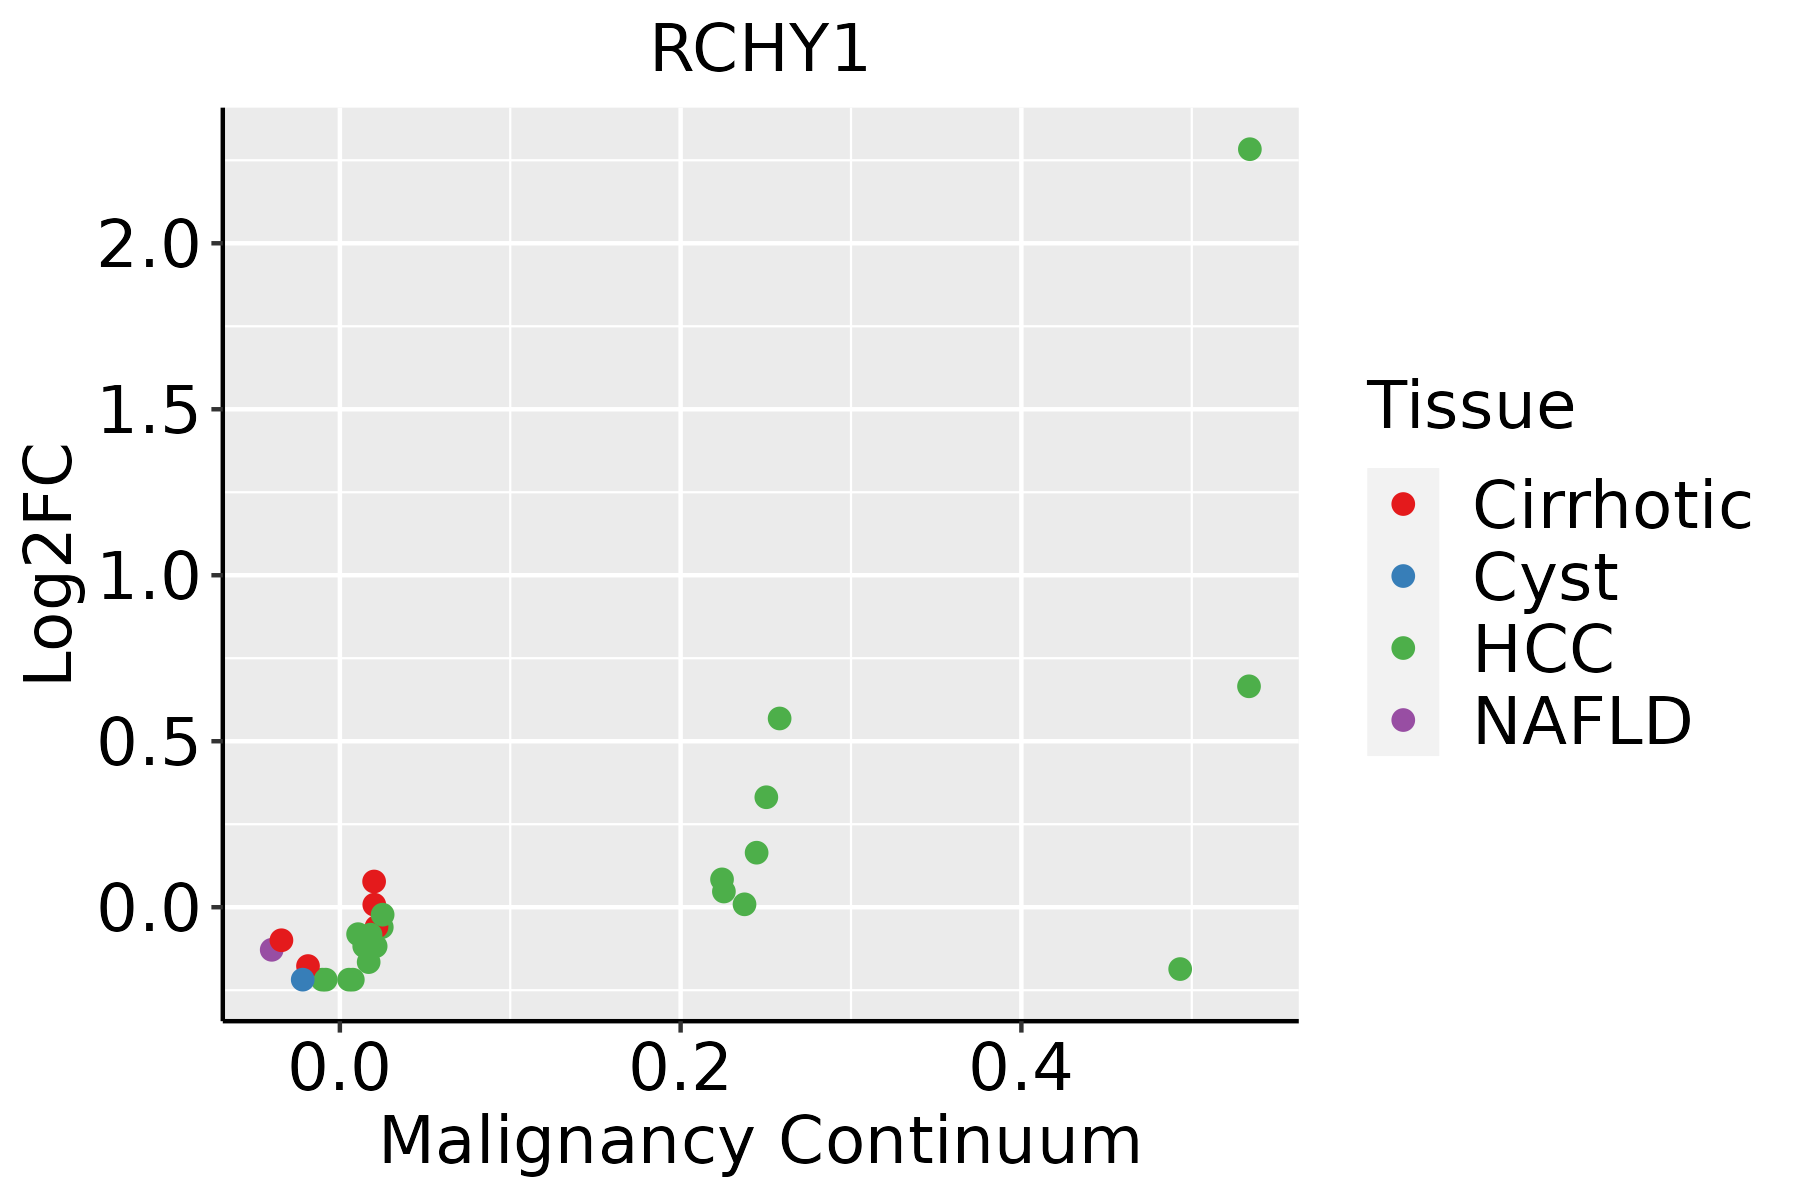 | HCC: Hepatocellular carcinoma |
| NAFLD: Non-alcoholic fatty liver disease |
| ∗log2FC in expression of this searched gene in stem-like cells from each diseased tissue sample relative to stem-like cells in normal samples in each tissue plotted against the malignancy continuum. Samples are colored based on if they are from different disease stage. |
Top |
Malignant transformation related pathway analysis |
| Find out the enriched GO biological processes and KEGG pathways involved in transition from healthy to precancer to cancer |
| Tissue | Disease Stage | Enriched GO biological Processes |
| Colorectum | AD |  |
| Colorectum | SER |  |
| Colorectum | MSS |  |
| Colorectum | MSI-H |  |
| Colorectum | FAP |  |
| ∗Top 15 enriched GO BP terms are showed in the bar plot of each disease state in each tissue. Each row represents a significant GO biological process which is colored according to the -log10(p.adjust). |
| Page: 1 2 3 4 5 6 7 8 9 |
| GO ID | Tissue | Disease Stage | Description | Gene Ratio | Bg Ratio | pvalue | p.adjust | Count |
| GO:0010498111 | Esophagus | ESCC | proteasomal protein catabolic process | 369/8552 | 490/18723 | 1.13e-41 | 1.80e-38 | 369 |
| GO:0043161111 | Esophagus | ESCC | proteasome-mediated ubiquitin-dependent protein catabolic process | 312/8552 | 412/18723 | 3.53e-36 | 4.48e-33 | 312 |
| GO:0042176111 | Esophagus | ESCC | regulation of protein catabolic process | 280/8552 | 391/18723 | 8.65e-26 | 2.39e-23 | 280 |
| GO:0009896111 | Esophagus | ESCC | positive regulation of catabolic process | 332/8552 | 492/18723 | 4.36e-23 | 9.22e-21 | 332 |
| GO:0031331111 | Esophagus | ESCC | positive regulation of cellular catabolic process | 292/8552 | 427/18723 | 8.67e-22 | 1.53e-19 | 292 |
| GO:1903320111 | Esophagus | ESCC | regulation of protein modification by small protein conjugation or removal | 181/8552 | 242/18723 | 1.80e-20 | 2.60e-18 | 181 |
| GO:1903362111 | Esophagus | ESCC | regulation of cellular protein catabolic process | 188/8552 | 255/18723 | 5.12e-20 | 6.62e-18 | 188 |
| GO:0045862111 | Esophagus | ESCC | positive regulation of proteolysis | 256/8552 | 372/18723 | 7.88e-20 | 9.43e-18 | 256 |
| GO:1903050111 | Esophagus | ESCC | regulation of proteolysis involved in cellular protein catabolic process | 163/8552 | 221/18723 | 1.44e-17 | 1.27e-15 | 163 |
| GO:0061136111 | Esophagus | ESCC | regulation of proteasomal protein catabolic process | 142/8552 | 187/18723 | 2.40e-17 | 2.00e-15 | 142 |
| GO:0045732111 | Esophagus | ESCC | positive regulation of protein catabolic process | 167/8552 | 231/18723 | 1.47e-16 | 1.14e-14 | 167 |
| GO:0031396111 | Esophagus | ESCC | regulation of protein ubiquitination | 154/8552 | 210/18723 | 2.70e-16 | 2.04e-14 | 154 |
| GO:0032434111 | Esophagus | ESCC | regulation of proteasomal ubiquitin-dependent protein catabolic process | 107/8552 | 134/18723 | 4.06e-16 | 2.93e-14 | 107 |
| GO:2000058111 | Esophagus | ESCC | regulation of ubiquitin-dependent protein catabolic process | 125/8552 | 164/18723 | 1.17e-15 | 7.76e-14 | 125 |
| GO:1903364111 | Esophagus | ESCC | positive regulation of cellular protein catabolic process | 117/8552 | 155/18723 | 3.25e-14 | 1.66e-12 | 117 |
| GO:1901800110 | Esophagus | ESCC | positive regulation of proteasomal protein catabolic process | 91/8552 | 114/18723 | 6.74e-14 | 3.34e-12 | 91 |
| GO:1903052110 | Esophagus | ESCC | positive regulation of proteolysis involved in cellular protein catabolic process | 101/8552 | 133/18723 | 9.58e-13 | 4.19e-11 | 101 |
| GO:007189716 | Esophagus | ESCC | DNA biosynthetic process | 127/8552 | 180/18723 | 1.04e-11 | 3.85e-10 | 127 |
| GO:0032436111 | Esophagus | ESCC | positive regulation of proteasomal ubiquitin-dependent protein catabolic process | 72/8552 | 90/18723 | 2.30e-11 | 7.87e-10 | 72 |
| GO:2000060111 | Esophagus | ESCC | positive regulation of ubiquitin-dependent protein catabolic process | 81/8552 | 107/18723 | 2.23e-10 | 6.34e-09 | 81 |
| Page: 1 2 3 4 |
| Pathway ID | Tissue | Disease Stage | Description | Gene Ratio | Bg Ratio | pvalue | p.adjust | qvalue | Count |
| hsa0412027 | Esophagus | ESCC | Ubiquitin mediated proteolysis | 122/4205 | 142/8465 | 6.53e-20 | 7.29e-18 | 3.74e-18 | 122 |
| hsa0411524 | Esophagus | ESCC | p53 signaling pathway | 65/4205 | 74/8465 | 3.88e-12 | 6.50e-11 | 3.33e-11 | 65 |
| hsa051629 | Esophagus | ESCC | Measles | 90/4205 | 139/8465 | 2.16e-04 | 7.87e-04 | 4.03e-04 | 90 |
| hsa0412036 | Esophagus | ESCC | Ubiquitin mediated proteolysis | 122/4205 | 142/8465 | 6.53e-20 | 7.29e-18 | 3.74e-18 | 122 |
| hsa0411534 | Esophagus | ESCC | p53 signaling pathway | 65/4205 | 74/8465 | 3.88e-12 | 6.50e-11 | 3.33e-11 | 65 |
| hsa0516213 | Esophagus | ESCC | Measles | 90/4205 | 139/8465 | 2.16e-04 | 7.87e-04 | 4.03e-04 | 90 |
| hsa0412021 | Liver | Cirrhotic | Ubiquitin mediated proteolysis | 72/2530 | 142/8465 | 1.32e-07 | 1.97e-06 | 1.21e-06 | 72 |
| hsa0412031 | Liver | Cirrhotic | Ubiquitin mediated proteolysis | 72/2530 | 142/8465 | 1.32e-07 | 1.97e-06 | 1.21e-06 | 72 |
| hsa0412041 | Liver | HCC | Ubiquitin mediated proteolysis | 110/4020 | 142/8465 | 1.67e-13 | 3.74e-12 | 2.08e-12 | 110 |
| hsa041156 | Liver | HCC | p53 signaling pathway | 46/4020 | 74/8465 | 7.64e-03 | 2.08e-02 | 1.16e-02 | 46 |
| hsa0412051 | Liver | HCC | Ubiquitin mediated proteolysis | 110/4020 | 142/8465 | 1.67e-13 | 3.74e-12 | 2.08e-12 | 110 |
| hsa0411511 | Liver | HCC | p53 signaling pathway | 46/4020 | 74/8465 | 7.64e-03 | 2.08e-02 | 1.16e-02 | 46 |
| Page: 1 |
Top |
Cell-cell communication analysis |
| Identification of potential cell-cell interactions between two cell types and their ligand-receptor pairs for different disease states |
| Ligand | Receptor | LRpair | Pathway | Tissue | Disease Stage |
| Page: 1 |
Top |
Single-cell gene regulatory network inference analysis |
| Find out the significant the regulons (TFs) and the target genes of each regulon across cell types for different disease states |
| TF | Cell Type | Tissue | Disease Stage | Target Gene | RSS | Regulon Activity |
| ∗The dot plots of a searched regulon are shown for all cell subpopulations in each disease state of each tissue based on the regulon specific score inferred using pySCENIC and by calculating the average expression. |
| Page: 1 |
Top |
Somatic mutation of malignant transformation related genes |
| Annotation of somatic variants for genes involved in malignant transformation |
| Hugo Symbol | Variant Class | Variant Classification | dbSNP RS | HGVSc | HGVSp | HGVSp Short | SWISSPROT | BIOTYPE | SIFT | PolyPhen | Tumor Sample Barcode | Tissue | Histology | Sex | Age | Stage | Therapy Types | Drugs | Outcome |
| RCHY1 | SNV | Missense_Mutation | c.640N>G | p.Gln214Glu | p.Q214E | Q96PM5 | protein_coding | tolerated(0.41) | benign(0.031) | TCGA-BH-A18P-01 | Breast | breast invasive carcinoma | Female | <65 | I/II | Unknown | Unknown | PD | |
| RCHY1 | SNV | Missense_Mutation | rs766486122 | c.53G>A | p.Arg18Gln | p.R18Q | Q96PM5 | protein_coding | tolerated(0.24) | benign(0) | TCGA-D8-A27G-01 | Breast | breast invasive carcinoma | Female | >=65 | I/II | Unknown | Unknown | SD |
| RCHY1 | SNV | Missense_Mutation | c.37C>G | p.Gln13Glu | p.Q13E | Q96PM5 | protein_coding | tolerated(1) | benign(0) | TCGA-GM-A2D9-01 | Breast | breast invasive carcinoma | Female | >=65 | I/II | Hormone Therapy | arimidex | SD | |
| RCHY1 | insertion | Nonsense_Mutation | novel | c.677_678insGAGACAACAGTGAACAATAAAGATAAAAGTCCTTGTCCTCAC | p.Asn226delinsLysArgGlnGlnTerThrIleLysIleLysValLeuValLeuThr | p.N226delinsKRQQ*TIKIKVLVLT | Q96PM5 | protein_coding | TCGA-A2-A0EO-01 | Breast | breast invasive carcinoma | Female | <65 | I/II | Hormone Therapy | tamoxiphen | SD | ||
| RCHY1 | SNV | Missense_Mutation | c.44N>A | p.Arg15Gln | p.R15Q | Q96PM5 | protein_coding | tolerated(0.5) | benign(0) | TCGA-C5-A1BI-01 | Cervix | cervical & endocervical cancer | Female | <65 | III/IV | Chemotherapy | cisplatin | SD | |
| RCHY1 | SNV | Missense_Mutation | novel | c.528N>A | p.Met176Ile | p.M176I | Q96PM5 | protein_coding | deleterious(0.01) | benign(0.012) | TCGA-EA-A410-01 | Cervix | cervical & endocervical cancer | Female | <65 | I/II | Unknown | Unknown | SD |
| RCHY1 | SNV | Missense_Mutation | novel | c.520N>A | p.Glu174Lys | p.E174K | Q96PM5 | protein_coding | tolerated(0.42) | benign(0.046) | TCGA-VS-A8EK-01 | Cervix | cervical & endocervical cancer | Female | >=65 | I/II | Chemotherapy | cisplatin | PD |
| RCHY1 | SNV | Missense_Mutation | novel | c.219G>C | p.Gln73His | p.Q73H | Q96PM5 | protein_coding | deleterious(0.01) | possibly_damaging(0.809) | TCGA-ZJ-AB0I-01 | Cervix | cervical & endocervical cancer | Female | <65 | I/II | Unknown | Unknown | SD |
| RCHY1 | deletion | Frame_Shift_Del | c.202delA | p.Ile68PhefsTer53 | p.I68Ffs*53 | Q96PM5 | protein_coding | TCGA-AA-3713-01 | Colorectum | colon adenocarcinoma | Male | >=65 | III/IV | Chemotherapy | 5-fluorouracil | PR | |||
| RCHY1 | SNV | Missense_Mutation | c.545N>A | p.Arg182Lys | p.R182K | Q96PM5 | protein_coding | tolerated(0.09) | benign(0.381) | TCGA-AP-A056-01 | Endometrium | uterine corpus endometrioid carcinoma | Female | <65 | I/II | Unknown | Unknown | SD |
| Page: 1 2 3 |
Top |
Related drugs of malignant transformation related genes |
| Identification of chemicals and drugs interact with genes involved in malignant transfromation |
| (DGIdb 4.0) |
| Entrez ID | Symbol | Category | Interaction Types | Drug Claim Name | Drug Name | PMIDs |
| Page: 1 |

Copyright 2023-Present -The University of Texas Health Science Center at Houston |