| Tissue | Expression Dynamics | Abbreviation |
| Esophagus |  | ESCC: Esophageal squamous cell carcinoma |
| HGIN: High-grade intraepithelial neoplasias |
| LGIN: Low-grade intraepithelial neoplasias |
| Liver |  | HCC: Hepatocellular carcinoma |
| NAFLD: Non-alcoholic fatty liver disease |
| Oral Cavity | 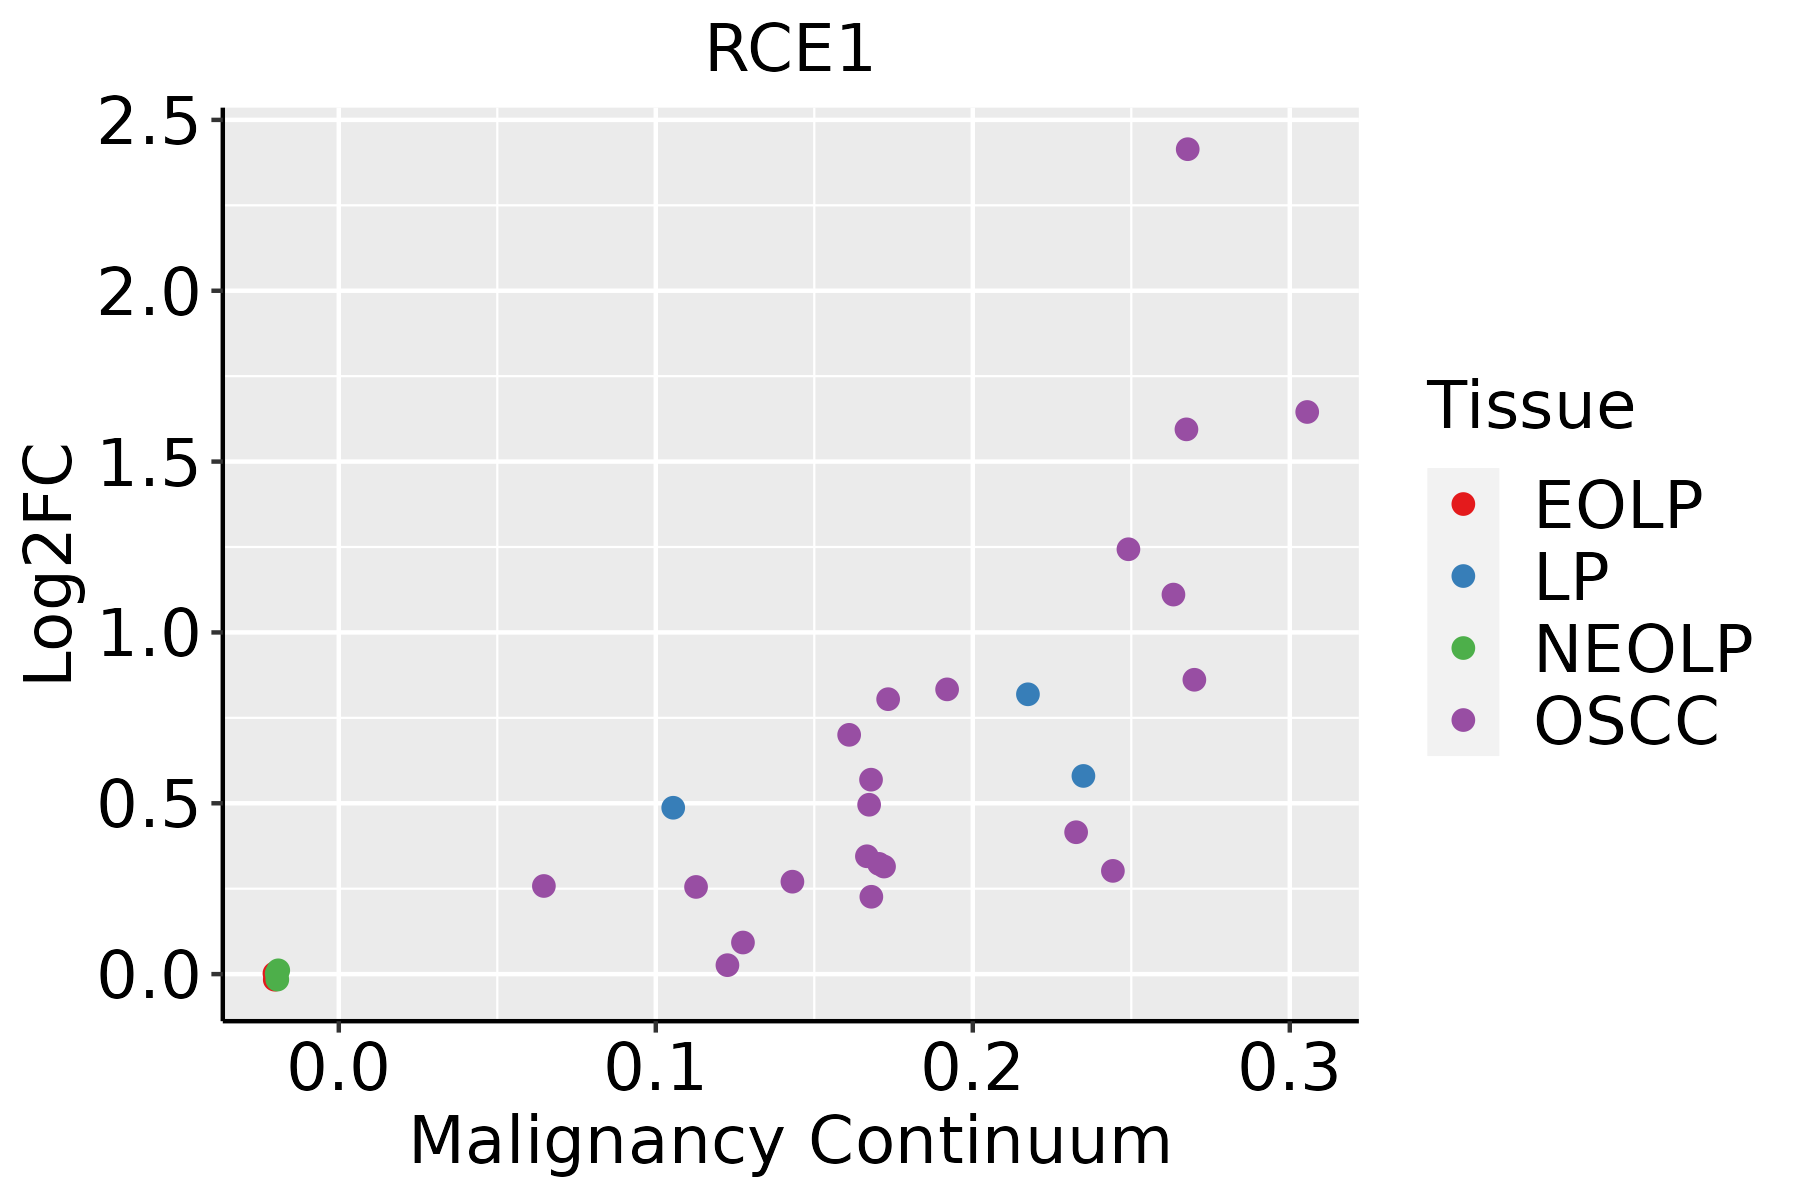 | EOLP: Erosive Oral lichen planus |
| LP: leukoplakia |
| NEOLP: Non-erosive oral lichen planus |
| OSCC: Oral squamous cell carcinoma |
| Skin | 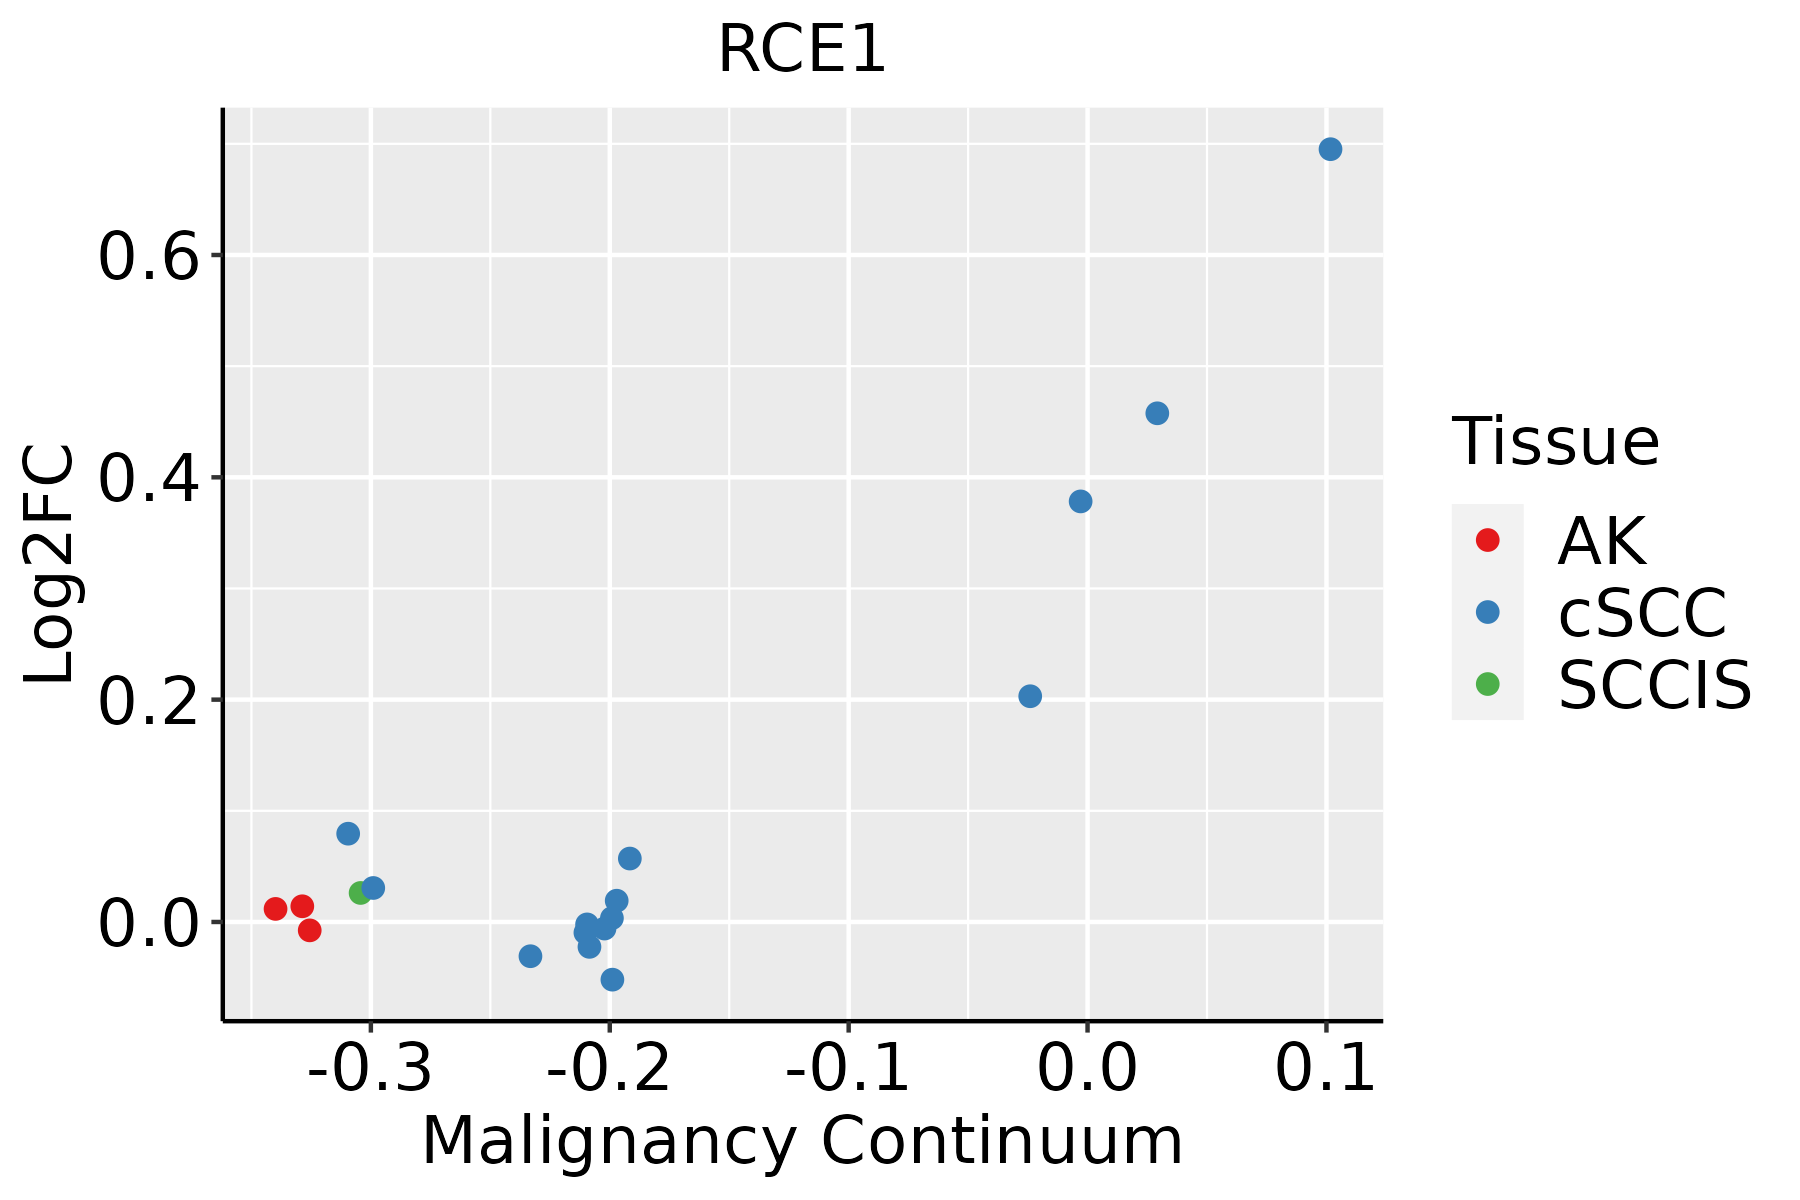 | AK: Actinic keratosis |
| cSCC: Cutaneous squamous cell carcinoma |
| SCCIS:squamous cell carcinoma in situ |
| GO ID | Tissue | Disease Stage | Description | Gene Ratio | Bg Ratio | pvalue | p.adjust | Count |
| GO:00224119 | Breast | Precancer | cellular component disassembly | 44/1080 | 443/18723 | 3.17e-04 | 4.51e-03 | 44 |
| GO:00329865 | Breast | Precancer | protein-DNA complex disassembly | 6/1080 | 20/18723 | 6.99e-04 | 8.43e-03 | 6 |
| GO:003298612 | Breast | IDC | protein-DNA complex disassembly | 6/1434 | 20/18723 | 3.03e-03 | 2.60e-02 | 6 |
| GO:003298621 | Breast | DCIS | protein-DNA complex disassembly | 6/1390 | 20/18723 | 2.59e-03 | 2.30e-02 | 6 |
| GO:002241113 | Breast | DCIS | cellular component disassembly | 48/1390 | 443/18723 | 5.35e-03 | 3.92e-02 | 48 |
| GO:0022411 | Colorectum | AD | cellular component disassembly | 147/3918 | 443/18723 | 8.53e-10 | 6.76e-08 | 147 |
| GO:0032984 | Colorectum | AD | protein-containing complex disassembly | 81/3918 | 224/18723 | 9.41e-08 | 4.65e-06 | 81 |
| GO:0006325 | Colorectum | AD | chromatin organization | 119/3918 | 409/18723 | 4.85e-05 | 8.33e-04 | 119 |
| GO:0032986 | Colorectum | AD | protein-DNA complex disassembly | 12/3918 | 20/18723 | 1.60e-04 | 2.21e-03 | 12 |
| GO:0031498 | Colorectum | AD | chromatin disassembly | 11/3918 | 20/18723 | 8.39e-04 | 8.21e-03 | 11 |
| GO:0006337 | Colorectum | AD | nucleosome disassembly | 10/3918 | 18/18723 | 1.31e-03 | 1.15e-02 | 10 |
| GO:0006338 | Colorectum | AD | chromatin remodeling | 70/3918 | 255/18723 | 7.44e-03 | 4.53e-02 | 70 |
| GO:00224111 | Colorectum | SER | cellular component disassembly | 114/2897 | 443/18723 | 1.17e-08 | 9.59e-07 | 114 |
| GO:00329841 | Colorectum | SER | protein-containing complex disassembly | 61/2897 | 224/18723 | 4.17e-06 | 1.60e-04 | 61 |
| GO:00063251 | Colorectum | SER | chromatin organization | 89/2897 | 409/18723 | 4.15e-04 | 6.17e-03 | 89 |
| GO:00314981 | Colorectum | SER | chromatin disassembly | 8/2897 | 20/18723 | 7.14e-03 | 4.99e-02 | 8 |
| GO:00329861 | Colorectum | SER | protein-DNA complex disassembly | 8/2897 | 20/18723 | 7.14e-03 | 4.99e-02 | 8 |
| GO:00224112 | Colorectum | MSS | cellular component disassembly | 130/3467 | 443/18723 | 1.44e-08 | 8.46e-07 | 130 |
| GO:00329842 | Colorectum | MSS | protein-containing complex disassembly | 69/3467 | 224/18723 | 5.61e-06 | 1.50e-04 | 69 |
| GO:00329862 | Colorectum | MSS | protein-DNA complex disassembly | 12/3467 | 20/18723 | 4.55e-05 | 8.35e-04 | 12 |
| Hugo Symbol | Variant Class | Variant Classification | dbSNP RS | HGVSc | HGVSp | HGVSp Short | SWISSPROT | BIOTYPE | SIFT | PolyPhen | Tumor Sample Barcode | Tissue | Histology | Sex | Age | Stage | Therapy Types | Drugs | Outcome |
| RCE1 | SNV | Missense_Mutation | rs367622666 | c.656G>A | p.Arg219His | p.R219H | Q9Y256 | protein_coding | tolerated(0.19) | benign(0.009) | TCGA-C8-A1HG-01 | Breast | breast invasive carcinoma | Female | <65 | I/II | Unknown | Unknown | SD |
| RCE1 | SNV | Missense_Mutation | rs201699815 | c.845N>A | p.Arg282Gln | p.R282Q | Q9Y256 | protein_coding | tolerated(0.3) | benign(0.019) | TCGA-2W-A8YY-01 | Cervix | cervical & endocervical cancer | Female | <65 | I/II | Chemotherapy | cisplatin | CR |
| RCE1 | SNV | Missense_Mutation | rs746725023 | c.844N>T | p.Arg282Trp | p.R282W | Q9Y256 | protein_coding | tolerated(0.19) | benign(0) | TCGA-AD-5900-01 | Colorectum | colon adenocarcinoma | Male | >=65 | I/II | Unknown | Unknown | SD |
| RCE1 | SNV | Missense_Mutation | | c.749G>A | p.Arg250His | p.R250H | Q9Y256 | protein_coding | deleterious(0) | possibly_damaging(0.78) | TCGA-D5-6530-01 | Colorectum | colon adenocarcinoma | Male | <65 | I/II | Unknown | Unknown | SD |
| RCE1 | SNV | Missense_Mutation | | c.946N>A | p.Leu316Ile | p.L316I | Q9Y256 | protein_coding | deleterious_low_confidence(0.01) | probably_damaging(0.981) | TCGA-AG-A002-01 | Colorectum | rectum adenocarcinoma | Male | <65 | I/II | Unknown | Unknown | SD |
| RCE1 | SNV | Missense_Mutation | novel | c.736N>G | p.Phe246Val | p.F246V | Q9Y256 | protein_coding | deleterious(0.01) | benign(0.092) | TCGA-A5-A0G2-01 | Endometrium | uterine corpus endometrioid carcinoma | Female | <65 | III/IV | Unknown | Unknown | SD |
| RCE1 | SNV | Missense_Mutation | novel | c.373N>G | p.Ile125Val | p.I125V | Q9Y256 | protein_coding | tolerated(1) | benign(0.003) | TCGA-A5-A2K5-01 | Endometrium | uterine corpus endometrioid carcinoma | Female | >=65 | I/II | Unknown | Unknown | SD |
| RCE1 | SNV | Missense_Mutation | novel | c.724G>A | p.Ala242Thr | p.A242T | Q9Y256 | protein_coding | deleterious(0.04) | possibly_damaging(0.723) | TCGA-AX-A0J1-01 | Endometrium | uterine corpus endometrioid carcinoma | Female | >=65 | I/II | Unknown | Unknown | SD |
| RCE1 | SNV | Missense_Mutation | novel | c.955N>T | p.Arg319Trp | p.R319W | Q9Y256 | protein_coding | deleterious_low_confidence(0.01) | benign(0.248) | TCGA-AX-A1C5-01 | Endometrium | uterine corpus endometrioid carcinoma | Female | <65 | III/IV | Unspecific | Carboplatin | SD |
| RCE1 | SNV | Missense_Mutation | novel | c.602N>T | p.Pro201Leu | p.P201L | Q9Y256 | protein_coding | deleterious(0) | probably_damaging(0.999) | TCGA-AX-A1CE-01 | Endometrium | uterine corpus endometrioid carcinoma | Female | <65 | I/II | Unspecific | Paclitaxel | SD |
| Entrez ID | Symbol | Category | Interaction Types | Drug Claim Name | Drug Name | PMIDs |
| 9986 | RCE1 | ENZYME, PROTEASE, DRUGGABLE GENOME | | NSC-37136 | CHEMBL1370674 | |
| 9986 | RCE1 | ENZYME, PROTEASE, DRUGGABLE GENOME | inhibitor | 252166757 | | |
| 9986 | RCE1 | ENZYME, PROTEASE, DRUGGABLE GENOME | | FLUNARIZINE DIHYDROCHLORIDE | FLUNARIZINE DIHYDROCHLORIDE | |
| 9986 | RCE1 | ENZYME, PROTEASE, DRUGGABLE GENOME | | HTS-9915 | CHEMBL512935 | |
| 9986 | RCE1 | ENZYME, PROTEASE, DRUGGABLE GENOME | | SJ000293754 | CHEMBL486706 | |
| 9986 | RCE1 | ENZYME, PROTEASE, DRUGGABLE GENOME | | LEVOFLOXACIN | LEVOFLOXACIN | |
| 9986 | RCE1 | ENZYME, PROTEASE, DRUGGABLE GENOME | inhibitor | 252166780 | | |
| 9986 | RCE1 | ENZYME, PROTEASE, DRUGGABLE GENOME | | ACRIDIN-1-YLAMINE | CHEMBL146525 | |
| 9986 | RCE1 | ENZYME, PROTEASE, DRUGGABLE GENOME | | GNF-PF-763 | CHEMBL1576338 | |


