
|
|||||
|
 | |
| |
| |
| |
| |
| |
|
Gene: RCCD1 |
Gene summary for RCCD1 |
| Gene information | Species | Human | Gene symbol | RCCD1 | Gene ID | 91433 |
| Gene name | RCC1 domain containing 1 | |
| Gene Alias | RCCD1 | |
| Cytomap | 15q26.1 | |
| Gene Type | protein-coding | GO ID | GO:0006325 | UniProtAcc | A0A024RC72 |
Top |
Malignant transformation analysis |
| Identification of the aberrant gene expression in precancerous and cancerous lesions by comparing the gene expression of stem-like cells in diseased tissues with normal stem cells |
| Entrez ID | Symbol | Replicates | Species | Organ | Tissue | Adj P-value | Log2FC | Malignancy |
| 91433 | RCCD1 | LZE4T | Human | Esophagus | ESCC | 1.21e-02 | 1.50e-01 | 0.0811 |
| 91433 | RCCD1 | LZE22T | Human | Esophagus | ESCC | 1.07e-02 | 2.00e-01 | 0.068 |
| 91433 | RCCD1 | LZE24T | Human | Esophagus | ESCC | 1.15e-04 | 1.42e-01 | 0.0596 |
| 91433 | RCCD1 | P1T-E | Human | Esophagus | ESCC | 1.32e-03 | 2.73e-01 | 0.0875 |
| 91433 | RCCD1 | P2T-E | Human | Esophagus | ESCC | 3.96e-14 | 3.01e-01 | 0.1177 |
| 91433 | RCCD1 | P4T-E | Human | Esophagus | ESCC | 7.67e-14 | 3.53e-01 | 0.1323 |
| 91433 | RCCD1 | P5T-E | Human | Esophagus | ESCC | 5.94e-11 | 2.42e-01 | 0.1327 |
| 91433 | RCCD1 | P8T-E | Human | Esophagus | ESCC | 4.09e-13 | 2.29e-01 | 0.0889 |
| 91433 | RCCD1 | P9T-E | Human | Esophagus | ESCC | 1.98e-07 | 1.93e-01 | 0.1131 |
| 91433 | RCCD1 | P10T-E | Human | Esophagus | ESCC | 1.72e-20 | 3.78e-01 | 0.116 |
| 91433 | RCCD1 | P11T-E | Human | Esophagus | ESCC | 2.65e-06 | 2.15e-01 | 0.1426 |
| 91433 | RCCD1 | P12T-E | Human | Esophagus | ESCC | 4.16e-12 | 2.13e-01 | 0.1122 |
| 91433 | RCCD1 | P15T-E | Human | Esophagus | ESCC | 2.74e-14 | 3.19e-01 | 0.1149 |
| 91433 | RCCD1 | P16T-E | Human | Esophagus | ESCC | 9.08e-12 | 3.12e-01 | 0.1153 |
| 91433 | RCCD1 | P20T-E | Human | Esophagus | ESCC | 2.23e-11 | 2.34e-01 | 0.1124 |
| 91433 | RCCD1 | P21T-E | Human | Esophagus | ESCC | 2.67e-03 | 1.22e-01 | 0.1617 |
| 91433 | RCCD1 | P22T-E | Human | Esophagus | ESCC | 8.83e-06 | 1.96e-01 | 0.1236 |
| 91433 | RCCD1 | P23T-E | Human | Esophagus | ESCC | 2.10e-14 | 3.47e-01 | 0.108 |
| 91433 | RCCD1 | P24T-E | Human | Esophagus | ESCC | 9.94e-15 | 2.63e-01 | 0.1287 |
| 91433 | RCCD1 | P26T-E | Human | Esophagus | ESCC | 5.11e-03 | 1.50e-01 | 0.1276 |
| Page: 1 2 3 4 |
| Tissue | Expression Dynamics | Abbreviation |
| Esophagus | 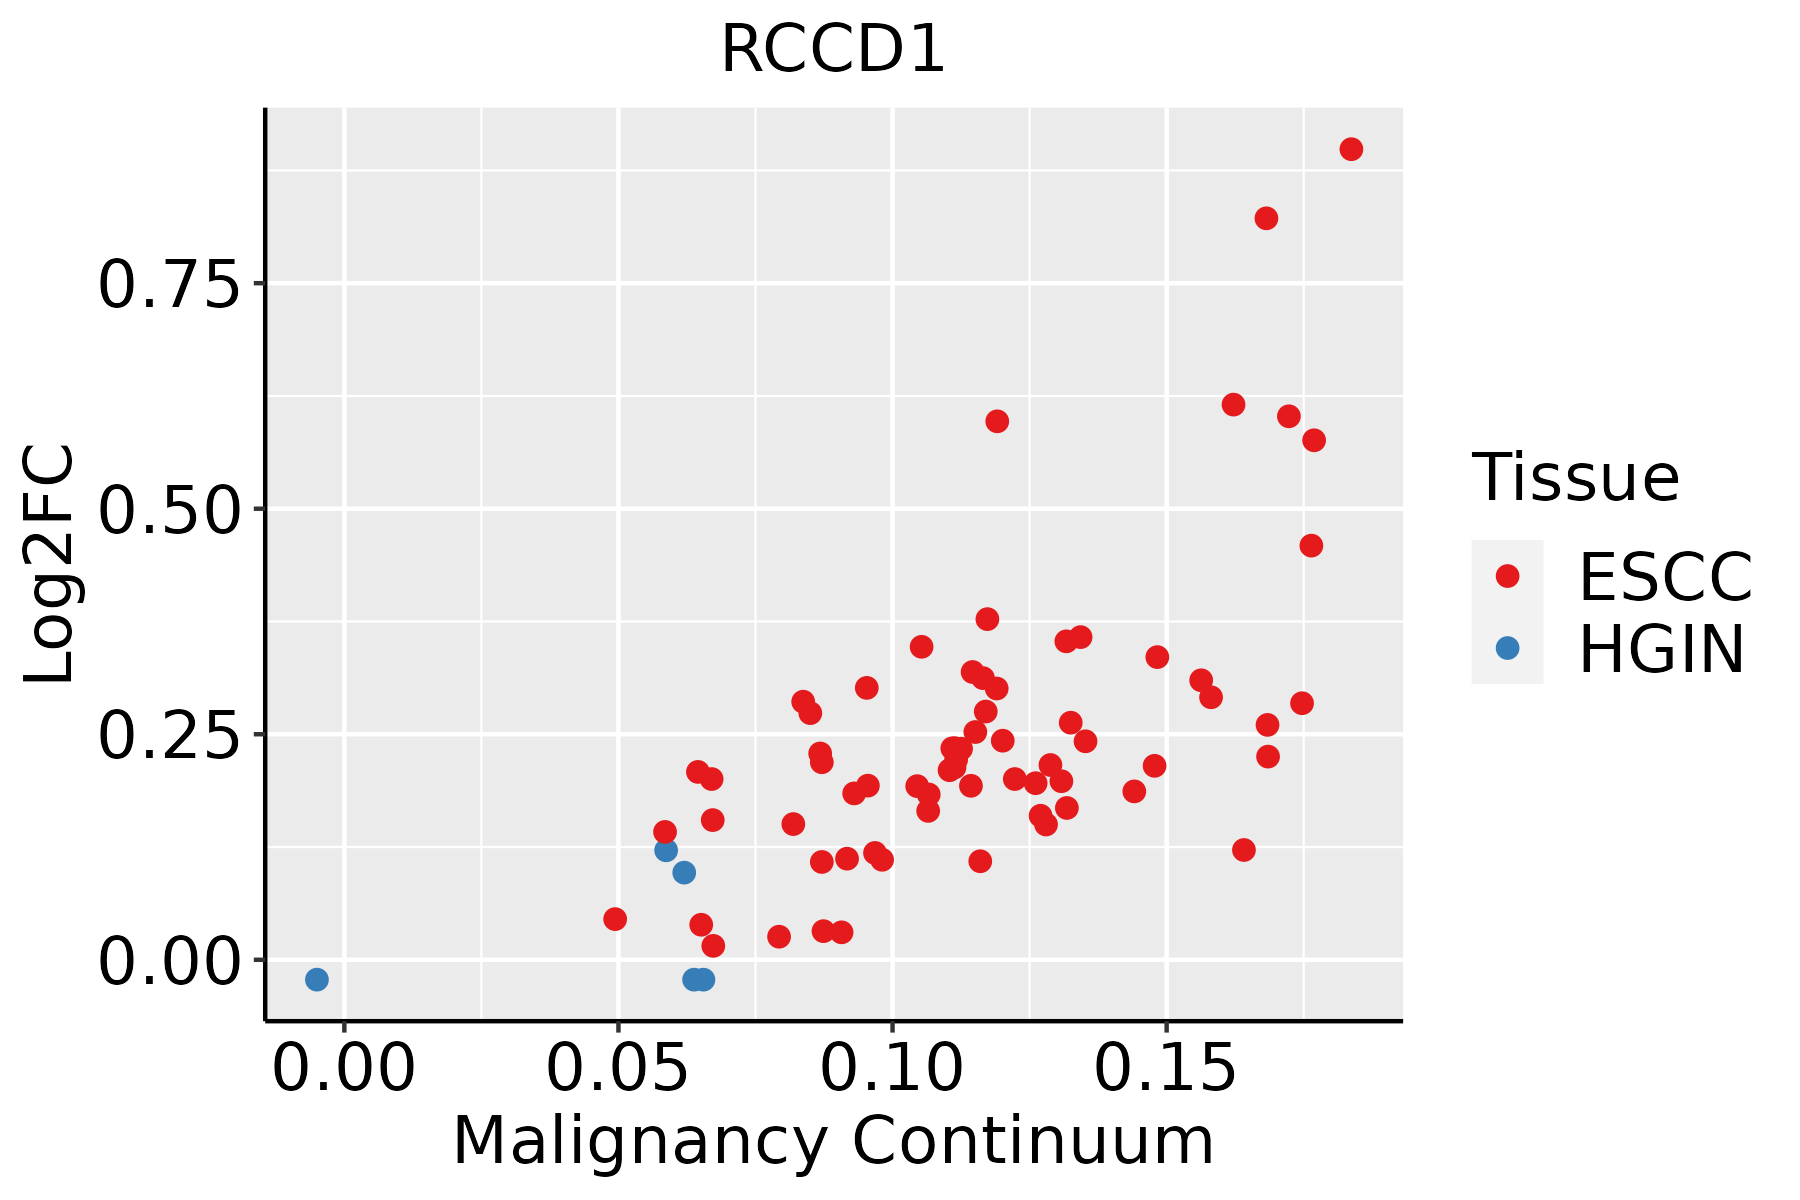 | ESCC: Esophageal squamous cell carcinoma |
| HGIN: High-grade intraepithelial neoplasias | ||
| LGIN: Low-grade intraepithelial neoplasias | ||
| Oral Cavity | 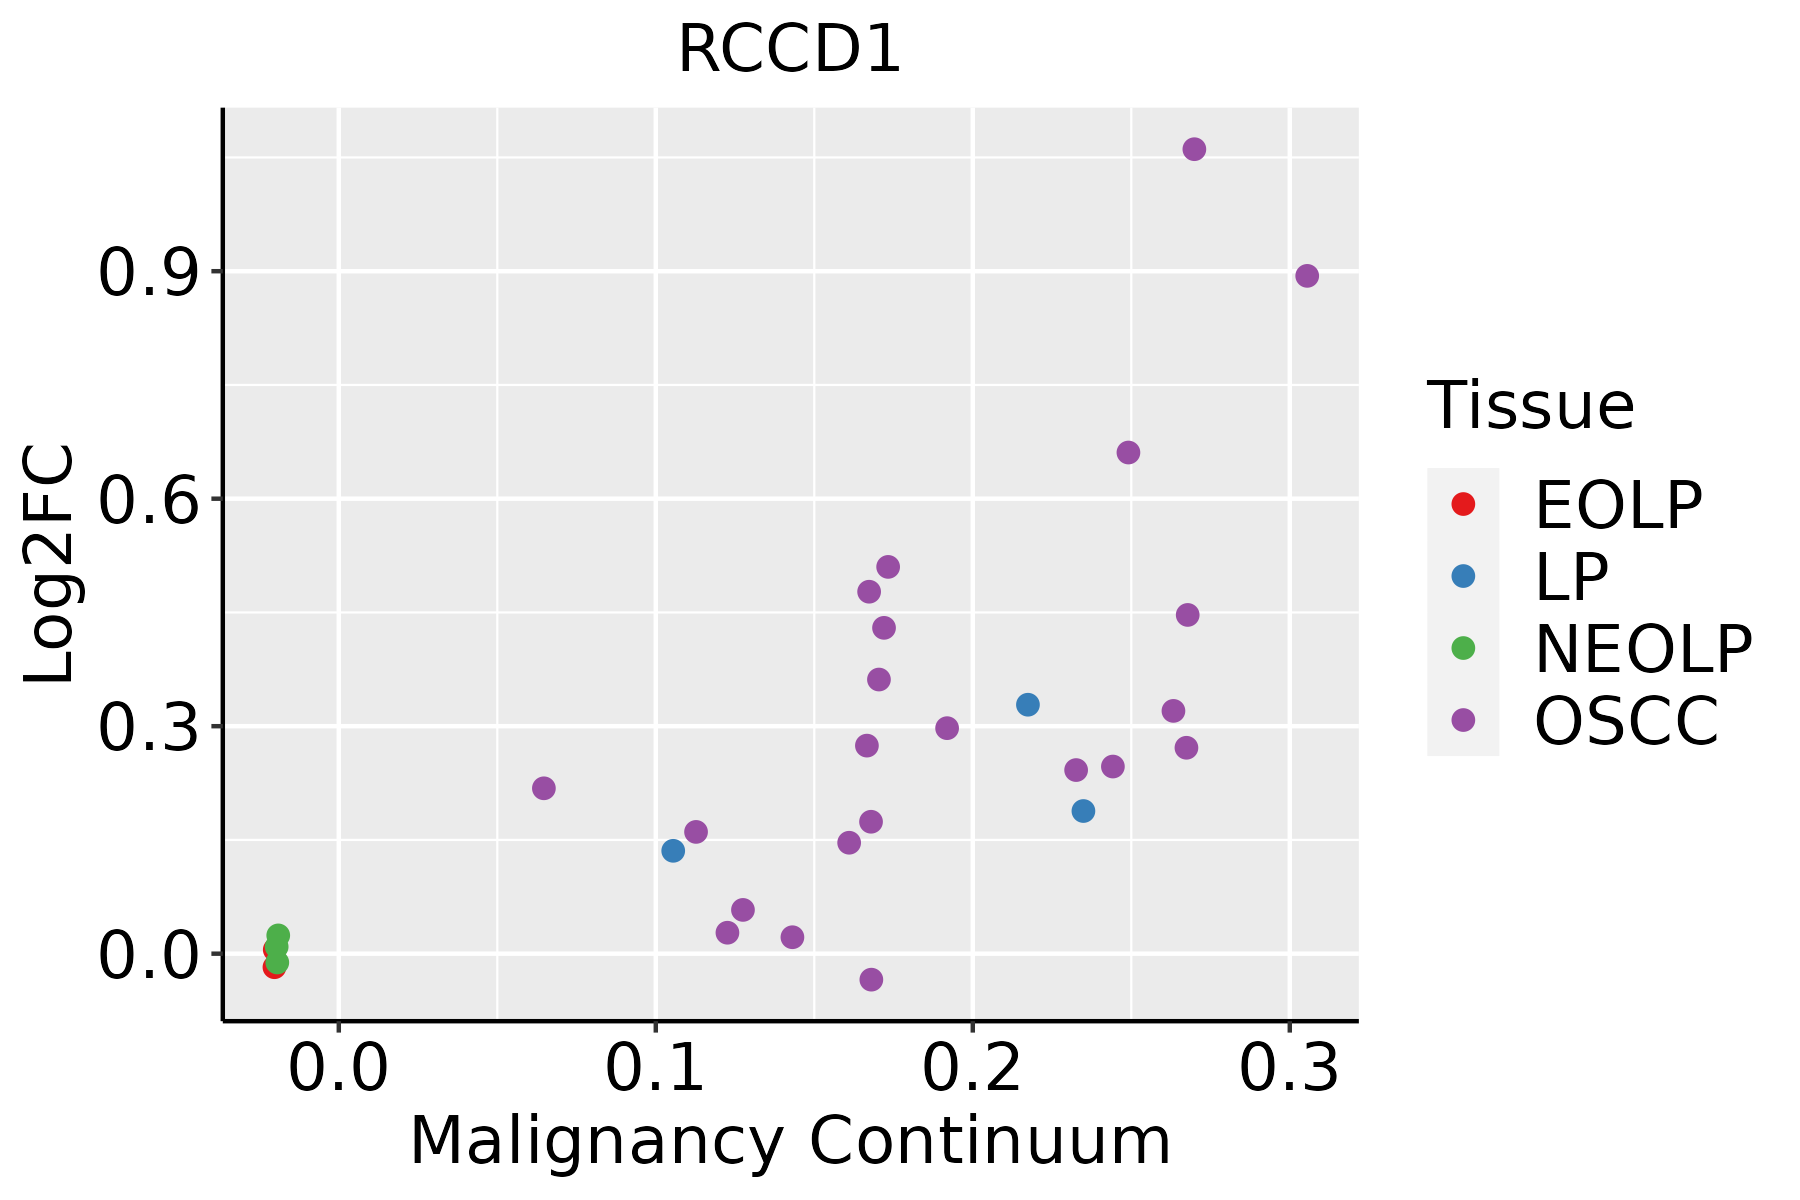 | EOLP: Erosive Oral lichen planus |
| LP: leukoplakia | ||
| NEOLP: Non-erosive oral lichen planus | ||
| OSCC: Oral squamous cell carcinoma |
| ∗log2FC in expression of this searched gene in stem-like cells from each diseased tissue sample relative to stem-like cells in normal samples in each tissue plotted against the malignancy continuum. Samples are colored based on if they are from different disease stage. |
Top |
Malignant transformation related pathway analysis |
| Find out the enriched GO biological processes and KEGG pathways involved in transition from healthy to precancer to cancer |
| Tissue | Disease Stage | Enriched GO biological Processes |
| Colorectum | AD |  |
| Colorectum | SER |  |
| Colorectum | MSS |  |
| Colorectum | MSI-H |  |
| Colorectum | FAP |  |
| ∗Top 15 enriched GO BP terms are showed in the bar plot of each disease state in each tissue. Each row represents a significant GO biological process which is colored according to the -log10(p.adjust). |
| Page: 1 2 3 4 5 6 7 8 9 |
| GO ID | Tissue | Disease Stage | Description | Gene Ratio | Bg Ratio | pvalue | p.adjust | Count |
| GO:000632517 | Esophagus | ESCC | chromatin organization | 240/8552 | 409/18723 | 6.52e-08 | 1.14e-06 | 240 |
| GO:000632510 | Oral cavity | OSCC | chromatin organization | 190/7305 | 409/18723 | 1.17e-03 | 5.97e-03 | 190 |
| Page: 1 |
| Pathway ID | Tissue | Disease Stage | Description | Gene Ratio | Bg Ratio | pvalue | p.adjust | qvalue | Count |
| Page: 1 |
Top |
Cell-cell communication analysis |
| Identification of potential cell-cell interactions between two cell types and their ligand-receptor pairs for different disease states |
| Ligand | Receptor | LRpair | Pathway | Tissue | Disease Stage |
| Page: 1 |
Top |
Single-cell gene regulatory network inference analysis |
| Find out the significant the regulons (TFs) and the target genes of each regulon across cell types for different disease states |
| TF | Cell Type | Tissue | Disease Stage | Target Gene | RSS | Regulon Activity |
| ∗The dot plots of a searched regulon are shown for all cell subpopulations in each disease state of each tissue based on the regulon specific score inferred using pySCENIC and by calculating the average expression. |
| Page: 1 |
Top |
Somatic mutation of malignant transformation related genes |
| Annotation of somatic variants for genes involved in malignant transformation |
| Hugo Symbol | Variant Class | Variant Classification | dbSNP RS | HGVSc | HGVSp | HGVSp Short | SWISSPROT | BIOTYPE | SIFT | PolyPhen | Tumor Sample Barcode | Tissue | Histology | Sex | Age | Stage | Therapy Types | Drugs | Outcome |
| RCCD1 | SNV | Missense_Mutation | c.1109C>T | p.Ala370Val | p.A370V | A6NED2 | protein_coding | tolerated(0.2) | benign(0.158) | TCGA-AO-A0JD-01 | Breast | breast invasive carcinoma | Female | <65 | III/IV | Chemotherapy | cyclophosphamide | SD | |
| RCCD1 | SNV | Missense_Mutation | c.956G>A | p.Gly319Glu | p.G319E | A6NED2 | protein_coding | deleterious(0) | probably_damaging(1) | TCGA-AA-3663-01 | Colorectum | colon adenocarcinoma | Male | <65 | I/II | Unknown | Unknown | SD | |
| RCCD1 | SNV | Missense_Mutation | c.1127G>A | p.Ser376Asn | p.S376N | A6NED2 | protein_coding | deleterious_low_confidence(0.01) | benign(0.055) | TCGA-AA-3994-01 | Colorectum | colon adenocarcinoma | Male | >=65 | III/IV | Chemotherapy | capecitabine | CR | |
| RCCD1 | SNV | Missense_Mutation | novel | c.815N>T | p.Arg272Ile | p.R272I | A6NED2 | protein_coding | tolerated(0.16) | benign(0.017) | TCGA-AG-A002-01 | Colorectum | rectum adenocarcinoma | Male | <65 | I/II | Unknown | Unknown | SD |
| RCCD1 | SNV | Missense_Mutation | rs747944046 | c.769G>A | p.Ala257Thr | p.A257T | A6NED2 | protein_coding | tolerated(0.59) | benign(0) | TCGA-AX-A1CE-01 | Endometrium | uterine corpus endometrioid carcinoma | Female | <65 | I/II | Unspecific | Paclitaxel | SD |
| RCCD1 | SNV | Missense_Mutation | novel | c.984N>C | p.Lys328Asn | p.K328N | A6NED2 | protein_coding | tolerated(0.06) | probably_damaging(0.966) | TCGA-EO-A22U-01 | Endometrium | uterine corpus endometrioid carcinoma | Female | >=65 | I/II | Unknown | Unknown | SD |
| RCCD1 | SNV | Missense_Mutation | novel | c.695N>G | p.Tyr232Cys | p.Y232C | A6NED2 | protein_coding | deleterious(0) | probably_damaging(0.998) | TCGA-FI-A2D5-01 | Endometrium | uterine corpus endometrioid carcinoma | Female | <65 | III/IV | Chemotherapy | carboplatinum | PD |
| RCCD1 | SNV | Missense_Mutation | novel | c.370N>C | p.Asp124His | p.D124H | A6NED2 | protein_coding | tolerated(0.13) | benign(0.164) | TCGA-DD-AAEA-01 | Liver | liver hepatocellular carcinoma | Male | >=65 | I/II | Unknown | Unknown | SD |
| RCCD1 | SNV | Missense_Mutation | novel | c.820N>T | p.Gly274Cys | p.G274C | A6NED2 | protein_coding | deleterious(0.01) | benign(0.088) | TCGA-34-8455-01 | Lung | lung squamous cell carcinoma | Male | >=65 | III/IV | Unknown | Unknown | PD |
| RCCD1 | SNV | Missense_Mutation | novel | c.872N>A | p.Pro291Gln | p.P291Q | A6NED2 | protein_coding | deleterious(0) | probably_damaging(1) | TCGA-IQ-7632-01 | Oral cavity | head & neck squamous cell carcinoma | Female | >=65 | I/II | Unknown | Unknown | SD |
| Page: 1 2 |
Top |
Related drugs of malignant transformation related genes |
| Identification of chemicals and drugs interact with genes involved in malignant transfromation |
| (DGIdb 4.0) |
| Entrez ID | Symbol | Category | Interaction Types | Drug Claim Name | Drug Name | PMIDs |
| Page: 1 |

Copyright 2023-Present -The University of Texas Health Science Center at Houston |