
|
|||||
|
 | |
| |
| |
| |
| |
| |
|
Gene: RCC1L |
Gene summary for RCC1L |
| Gene information | Species | Human | Gene symbol | RCC1L | Gene ID | 81554 |
| Gene name | RCC1 like | |
| Gene Alias | WBSCR16 | |
| Cytomap | 7q11.23 | |
| Gene Type | protein-coding | GO ID | GO:0006412 | UniProtAcc | Q96I51 |
Top |
Malignant transformation analysis |
| Identification of the aberrant gene expression in precancerous and cancerous lesions by comparing the gene expression of stem-like cells in diseased tissues with normal stem cells |
| Entrez ID | Symbol | Replicates | Species | Organ | Tissue | Adj P-value | Log2FC | Malignancy |
| 81554 | RCC1L | HCC2 | Human | Liver | HCC | 4.96e-13 | 3.53e+00 | 0.5341 |
| 81554 | RCC1L | S014 | Human | Liver | HCC | 6.11e-26 | 7.27e-01 | 0.2254 |
| 81554 | RCC1L | S015 | Human | Liver | HCC | 3.69e-20 | 7.99e-01 | 0.2375 |
| 81554 | RCC1L | S016 | Human | Liver | HCC | 1.48e-22 | 6.11e-01 | 0.2243 |
| 81554 | RCC1L | S027 | Human | Liver | HCC | 8.24e-05 | 5.60e-01 | 0.2446 |
| 81554 | RCC1L | S028 | Human | Liver | HCC | 1.18e-16 | 6.13e-01 | 0.2503 |
| 81554 | RCC1L | S029 | Human | Liver | HCC | 4.45e-18 | 6.56e-01 | 0.2581 |
| 81554 | RCC1L | male-WTA | Human | Thyroid | PTC | 1.30e-07 | 7.72e-02 | 0.1037 |
| 81554 | RCC1L | PTC01 | Human | Thyroid | PTC | 8.84e-06 | 1.83e-01 | 0.1899 |
| 81554 | RCC1L | PTC04 | Human | Thyroid | PTC | 4.05e-12 | 1.82e-01 | 0.1927 |
| 81554 | RCC1L | PTC05 | Human | Thyroid | PTC | 3.89e-19 | 5.96e-01 | 0.2065 |
| 81554 | RCC1L | PTC06 | Human | Thyroid | PTC | 5.55e-26 | 4.98e-01 | 0.2057 |
| 81554 | RCC1L | PTC07 | Human | Thyroid | PTC | 2.82e-19 | 4.00e-01 | 0.2044 |
| 81554 | RCC1L | ATC12 | Human | Thyroid | ATC | 5.17e-12 | 2.52e-01 | 0.34 |
| 81554 | RCC1L | ATC13 | Human | Thyroid | ATC | 5.14e-16 | 3.81e-01 | 0.34 |
| 81554 | RCC1L | ATC2 | Human | Thyroid | ATC | 5.19e-10 | 6.77e-01 | 0.34 |
| 81554 | RCC1L | ATC4 | Human | Thyroid | ATC | 3.49e-12 | 3.06e-01 | 0.34 |
| 81554 | RCC1L | ATC5 | Human | Thyroid | ATC | 2.73e-17 | 4.22e-01 | 0.34 |
| Page: 1 |
| Tissue | Expression Dynamics | Abbreviation |
| Liver | 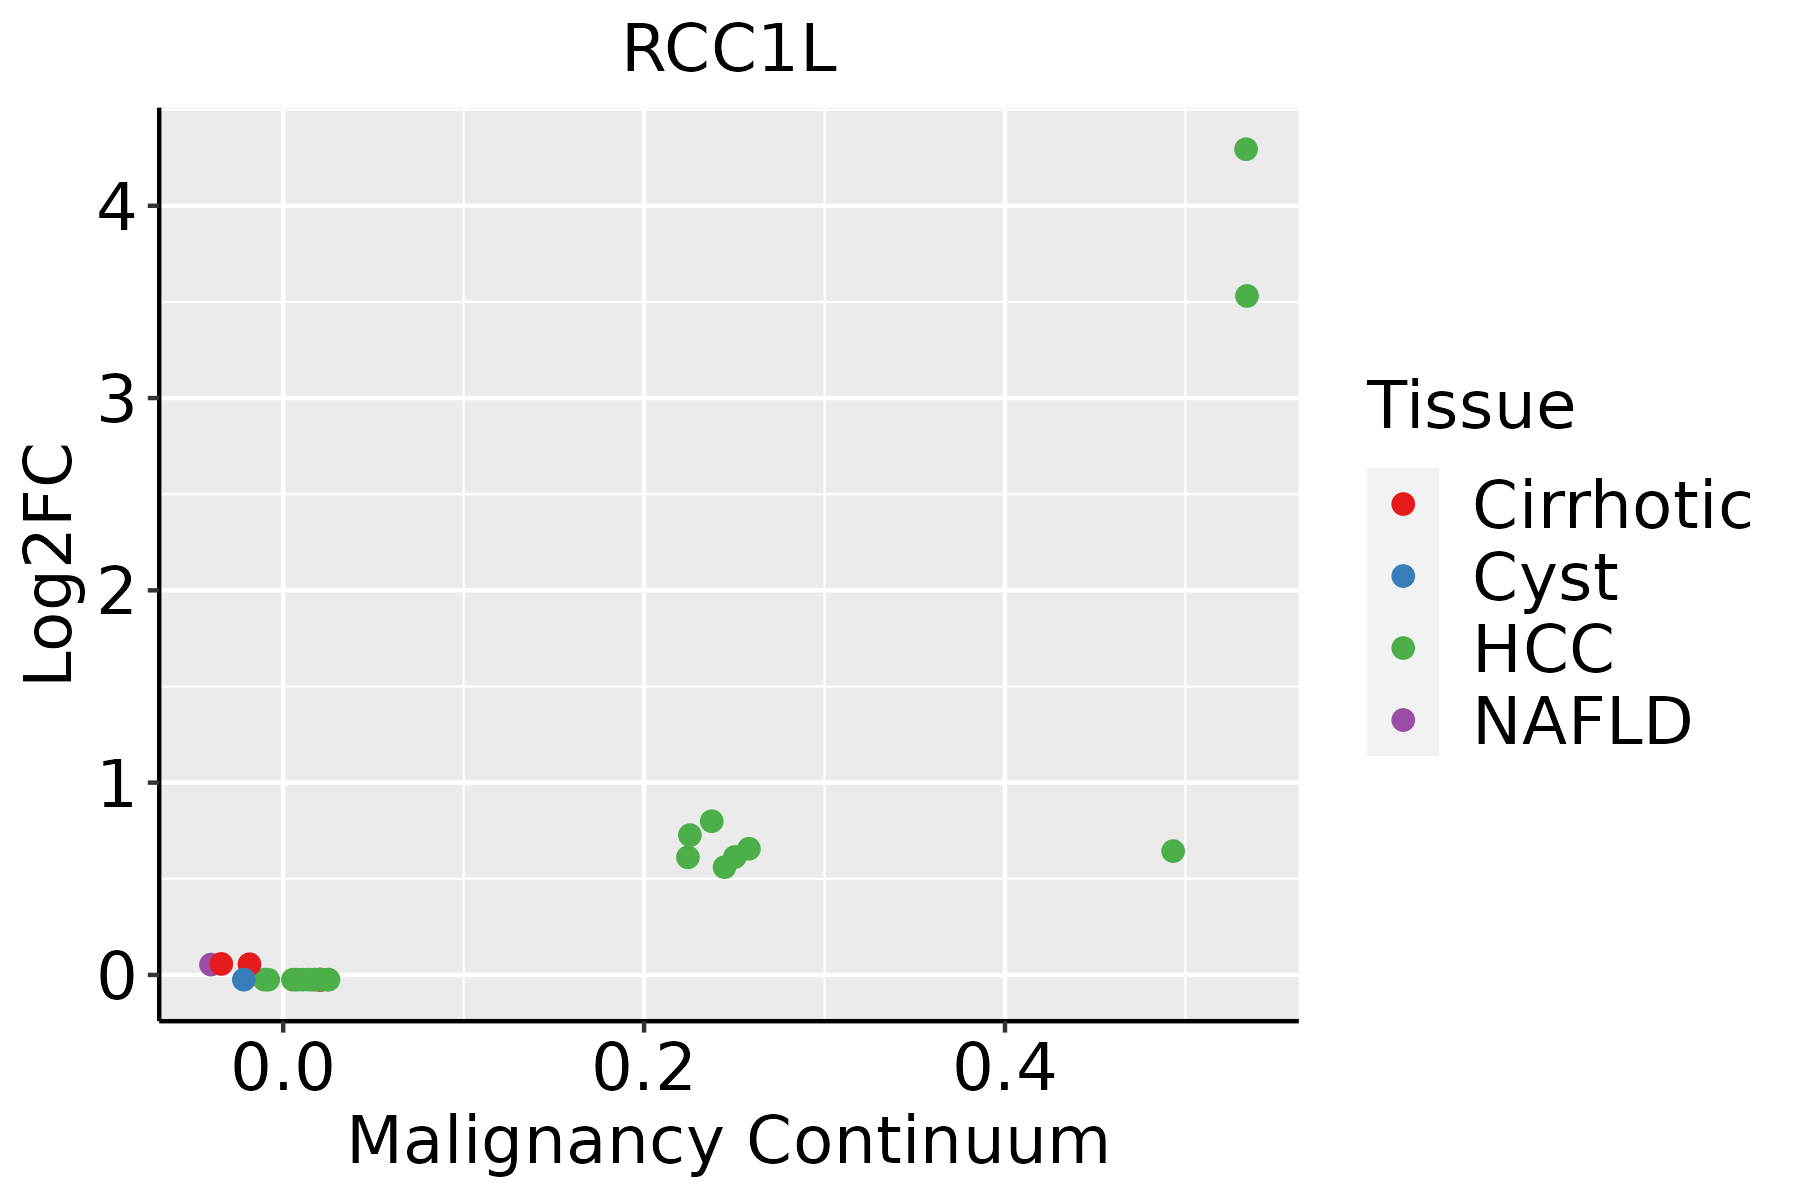 | HCC: Hepatocellular carcinoma |
| NAFLD: Non-alcoholic fatty liver disease | ||
| Thyroid |  | ATC: Anaplastic thyroid cancer |
| HT: Hashimoto's thyroiditis | ||
| PTC: Papillary thyroid cancer |
| ∗log2FC in expression of this searched gene in stem-like cells from each diseased tissue sample relative to stem-like cells in normal samples in each tissue plotted against the malignancy continuum. Samples are colored based on if they are from different disease stage. |
Top |
Malignant transformation related pathway analysis |
| Find out the enriched GO biological processes and KEGG pathways involved in transition from healthy to precancer to cancer |
| Tissue | Disease Stage | Enriched GO biological Processes |
| Colorectum | AD |  |
| Colorectum | SER |  |
| Colorectum | MSS |  |
| Colorectum | MSI-H |  |
| Colorectum | FAP |  |
| ∗Top 15 enriched GO BP terms are showed in the bar plot of each disease state in each tissue. Each row represents a significant GO biological process which is colored according to the -log10(p.adjust). |
| Page: 1 2 3 4 5 6 7 8 9 |
| GO ID | Tissue | Disease Stage | Description | Gene Ratio | Bg Ratio | pvalue | p.adjust | Count |
| GO:000641722 | Liver | HCC | regulation of translation | 287/7958 | 468/18723 | 8.79e-17 | 8.08e-15 | 287 |
| GO:01400531 | Liver | HCC | mitochondrial gene expression | 82/7958 | 108/18723 | 1.49e-12 | 7.20e-11 | 82 |
| GO:00325431 | Liver | HCC | mitochondrial translation | 62/7958 | 76/18723 | 2.95e-12 | 1.34e-10 | 62 |
| GO:004572712 | Liver | HCC | positive regulation of translation | 97/7958 | 136/18723 | 8.51e-12 | 3.55e-10 | 97 |
| GO:003425022 | Liver | HCC | positive regulation of cellular amide metabolic process | 110/7958 | 162/18723 | 5.14e-11 | 1.92e-09 | 110 |
| GO:000700612 | Liver | HCC | mitochondrial membrane organization | 80/7958 | 116/18723 | 7.09e-09 | 1.81e-07 | 80 |
| GO:004828411 | Liver | HCC | organelle fusion | 84/7958 | 141/18723 | 3.13e-05 | 3.20e-04 | 84 |
| GO:0070129 | Liver | HCC | regulation of mitochondrial translation | 19/7958 | 24/18723 | 2.80e-04 | 2.02e-03 | 19 |
| GO:0062125 | Liver | HCC | regulation of mitochondrial gene expression | 21/7958 | 28/18723 | 4.94e-04 | 3.23e-03 | 21 |
| GO:00901741 | Liver | HCC | organelle membrane fusion | 63/7958 | 110/18723 | 1.24e-03 | 6.85e-03 | 63 |
| GO:0061025 | Liver | HCC | membrane fusion | 88/7958 | 163/18723 | 1.98e-03 | 1.00e-02 | 88 |
| GO:0070131 | Liver | HCC | positive regulation of mitochondrial translation | 12/7958 | 15/18723 | 3.56e-03 | 1.59e-02 | 12 |
| GO:0006417113 | Thyroid | PTC | regulation of translation | 236/5968 | 468/18723 | 2.70e-17 | 2.52e-15 | 236 |
| GO:0034250113 | Thyroid | PTC | positive regulation of cellular amide metabolic process | 98/5968 | 162/18723 | 5.26e-14 | 3.04e-12 | 98 |
| GO:0045727113 | Thyroid | PTC | positive regulation of translation | 84/5968 | 136/18723 | 6.52e-13 | 3.08e-11 | 84 |
| GO:000700624 | Thyroid | PTC | mitochondrial membrane organization | 68/5968 | 116/18723 | 2.47e-09 | 6.88e-08 | 68 |
| GO:00482846 | Thyroid | PTC | organelle fusion | 71/5968 | 141/18723 | 3.68e-06 | 4.70e-05 | 71 |
| GO:00610256 | Thyroid | PTC | membrane fusion | 77/5968 | 163/18723 | 2.86e-05 | 2.78e-04 | 77 |
| GO:00901745 | Thyroid | PTC | organelle membrane fusion | 55/5968 | 110/18723 | 5.64e-05 | 4.99e-04 | 55 |
| GO:01400536 | Thyroid | PTC | mitochondrial gene expression | 51/5968 | 108/18723 | 6.04e-04 | 3.83e-03 | 51 |
| Page: 1 2 |
| Pathway ID | Tissue | Disease Stage | Description | Gene Ratio | Bg Ratio | pvalue | p.adjust | qvalue | Count |
| Page: 1 |
Top |
Cell-cell communication analysis |
| Identification of potential cell-cell interactions between two cell types and their ligand-receptor pairs for different disease states |
| Ligand | Receptor | LRpair | Pathway | Tissue | Disease Stage |
| Page: 1 |
Top |
Single-cell gene regulatory network inference analysis |
| Find out the significant the regulons (TFs) and the target genes of each regulon across cell types for different disease states |
| TF | Cell Type | Tissue | Disease Stage | Target Gene | RSS | Regulon Activity |
| ∗The dot plots of a searched regulon are shown for all cell subpopulations in each disease state of each tissue based on the regulon specific score inferred using pySCENIC and by calculating the average expression. |
| Page: 1 |
Top |
Somatic mutation of malignant transformation related genes |
| Annotation of somatic variants for genes involved in malignant transformation |
| Hugo Symbol | Variant Class | Variant Classification | dbSNP RS | HGVSc | HGVSp | HGVSp Short | SWISSPROT | BIOTYPE | SIFT | PolyPhen | Tumor Sample Barcode | Tissue | Histology | Sex | Age | Stage | Therapy Types | Drugs | Outcome |
| RCC1L | SNV | Missense_Mutation | novel | c.526N>T | p.Val176Leu | p.V176L | Q96I51 | protein_coding | deleterious(0.04) | benign(0.331) | TCGA-A8-A099-01 | Breast | breast invasive carcinoma | Female | >=65 | III/IV | Hormone Therapy | exemestane | SD |
| RCC1L | SNV | Missense_Mutation | novel | c.1222N>T | p.Ala408Ser | p.A408S | Q96I51 | protein_coding | deleterious(0) | probably_damaging(0.996) | TCGA-C5-A905-01 | Cervix | cervical & endocervical cancer | Female | <65 | I/II | Unknown | Unknown | SD |
| RCC1L | SNV | Missense_Mutation | novel | c.1375N>A | p.Leu459Met | p.L459M | Q96I51 | protein_coding | tolerated(0.15) | benign(0.23) | TCGA-A6-2686-01 | Colorectum | colon adenocarcinoma | Female | >=65 | I/II | Unknown | Unknown | SD |
| RCC1L | SNV | Missense_Mutation | novel | c.874N>A | p.Gly292Ser | p.G292S | Q96I51 | protein_coding | tolerated(0.09) | possibly_damaging(0.611) | TCGA-A6-6781-01 | Colorectum | colon adenocarcinoma | Male | <65 | III/IV | Chemotherapy | oxaliplatin | SD |
| RCC1L | SNV | Missense_Mutation | novel | c.737N>T | p.Thr246Met | p.T246M | Q96I51 | protein_coding | deleterious(0.03) | probably_damaging(0.942) | TCGA-AA-A022-01 | Colorectum | colon adenocarcinoma | Female | >=65 | I/II | Unknown | Unknown | SD |
| RCC1L | SNV | Missense_Mutation | novel | c.706N>A | p.Ala236Thr | p.A236T | Q96I51 | protein_coding | tolerated(0.24) | benign(0.058) | TCGA-G4-6586-01 | Colorectum | colon adenocarcinoma | Female | >=65 | I/II | Unknown | Unknown | SD |
| RCC1L | insertion | In_Frame_Ins | novel | c.570_571insCACTCTCTTGTGTTGACT | p.His185_Thr190dup | p.H185_T190dup | Q96I51 | protein_coding | TCGA-F4-6809-01 | Colorectum | colon adenocarcinoma | Female | <65 | I/II | Unknown | Unknown | PD | ||
| RCC1L | SNV | Missense_Mutation | novel | c.548G>A | p.Arg183Gln | p.R183Q | Q96I51 | protein_coding | deleterious(0) | probably_damaging(0.998) | TCGA-A5-A0G2-01 | Endometrium | uterine corpus endometrioid carcinoma | Female | <65 | III/IV | Unknown | Unknown | SD |
| RCC1L | SNV | Missense_Mutation | novel | c.480N>T | p.Glu160Asp | p.E160D | Q96I51 | protein_coding | deleterious(0.02) | probably_damaging(0.948) | TCGA-AP-A0LM-01 | Endometrium | uterine corpus endometrioid carcinoma | Female | <65 | III/IV | Chemotherapy | cisplatin | SD |
| RCC1L | SNV | Missense_Mutation | rs372749501 | c.524N>A | p.Arg175Gln | p.R175Q | Q96I51 | protein_coding | tolerated(0.22) | benign(0.033) | TCGA-AP-A1DK-01 | Endometrium | uterine corpus endometrioid carcinoma | Female | <65 | I/II | Unknown | Unknown | SD |
| Page: 1 2 3 |
Top |
Related drugs of malignant transformation related genes |
| Identification of chemicals and drugs interact with genes involved in malignant transfromation |
| (DGIdb 4.0) |
| Entrez ID | Symbol | Category | Interaction Types | Drug Claim Name | Drug Name | PMIDs |
| Page: 1 |

Copyright 2023-Present -The University of Texas Health Science Center at Houston |