
|
|||||
|
 | |
| |
| |
| |
| |
| |
|
Gene: RCAN2 |
Gene summary for RCAN2 |
| Gene information | Species | Human | Gene symbol | RCAN2 | Gene ID | 10231 |
| Gene name | regulator of calcineurin 2 | |
| Gene Alias | CSP2 | |
| Cytomap | 6p12.3 | |
| Gene Type | protein-coding | GO ID | GO:0007154 | UniProtAcc | Q14206 |
Top |
Malignant transformation analysis |
| Identification of the aberrant gene expression in precancerous and cancerous lesions by comparing the gene expression of stem-like cells in diseased tissues with normal stem cells |
| Entrez ID | Symbol | Replicates | Species | Organ | Tissue | Adj P-value | Log2FC | Malignancy |
| 10231 | RCAN2 | HTA11_6818_2000001011 | Human | Colorectum | AD | 3.78e-35 | 1.74e+00 | 0.0112 |
| 10231 | RCAN2 | RNA-P10T2-P10T2-1 | Human | Lung | AAH | 1.96e-04 | 9.06e-01 | -0.1271 |
| 10231 | RCAN2 | RNA-P10T2-P10T2-2 | Human | Lung | AAH | 4.15e-02 | 7.47e-01 | -0.1406 |
| 10231 | RCAN2 | RNA-P10T2-P10T2-3 | Human | Lung | AAH | 4.92e-07 | 1.10e+00 | -0.1408 |
| 10231 | RCAN2 | RNA-P10T2-P10T2-4 | Human | Lung | AAH | 5.72e-05 | 9.54e-01 | -0.138 |
| 10231 | RCAN2 | RNA-P25T1-P25T1-1 | Human | Lung | AIS | 5.24e-15 | 9.32e-01 | -0.2116 |
| 10231 | RCAN2 | RNA-P25T1-P25T1-2 | Human | Lung | AIS | 3.24e-05 | 8.30e-01 | -0.1941 |
| 10231 | RCAN2 | RNA-P25T1-P25T1-3 | Human | Lung | AIS | 2.40e-05 | 7.52e-01 | -0.2107 |
| 10231 | RCAN2 | RNA-P25T1-P25T1-4 | Human | Lung | AIS | 3.33e-13 | 8.31e-01 | -0.2119 |
| 10231 | RCAN2 | RNA-P7T1-P7T1-1 | Human | Lung | AIS | 1.06e-03 | 8.00e-01 | -0.0961 |
| 10231 | RCAN2 | RNA-P7T1-P7T1-2 | Human | Lung | AIS | 2.09e-03 | 6.19e-01 | -0.0876 |
| 10231 | RCAN2 | RNA-P7T1-P7T1-3 | Human | Lung | AIS | 1.11e-02 | 6.83e-01 | -0.0822 |
| 10231 | RCAN2 | RNA-P7T1-P7T1-4 | Human | Lung | AIS | 9.38e-04 | 6.53e-01 | -0.0809 |
| 10231 | RCAN2 | HTA12-15-2 | Human | Pancreas | PDAC | 5.19e-07 | 5.72e-01 | 0.2315 |
| 10231 | RCAN2 | HTA12-23-1 | Human | Pancreas | PDAC | 1.92e-07 | 8.33e-01 | 0.3405 |
| 10231 | RCAN2 | HTA12-25-1 | Human | Pancreas | PDAC | 3.65e-06 | 5.98e-01 | 0.313 |
| 10231 | RCAN2 | HTA12-26-1 | Human | Pancreas | PDAC | 6.49e-26 | 1.07e+00 | 0.3728 |
| 10231 | RCAN2 | HTA12-29-1 | Human | Pancreas | PDAC | 1.81e-43 | 9.50e-01 | 0.3722 |
| 10231 | RCAN2 | HTA12-30-1 | Human | Pancreas | PDAC | 4.59e-02 | 9.27e-01 | 0.3671 |
| Page: 1 |
| Tissue | Expression Dynamics | Abbreviation |
| Colorectum (GSE201348) | 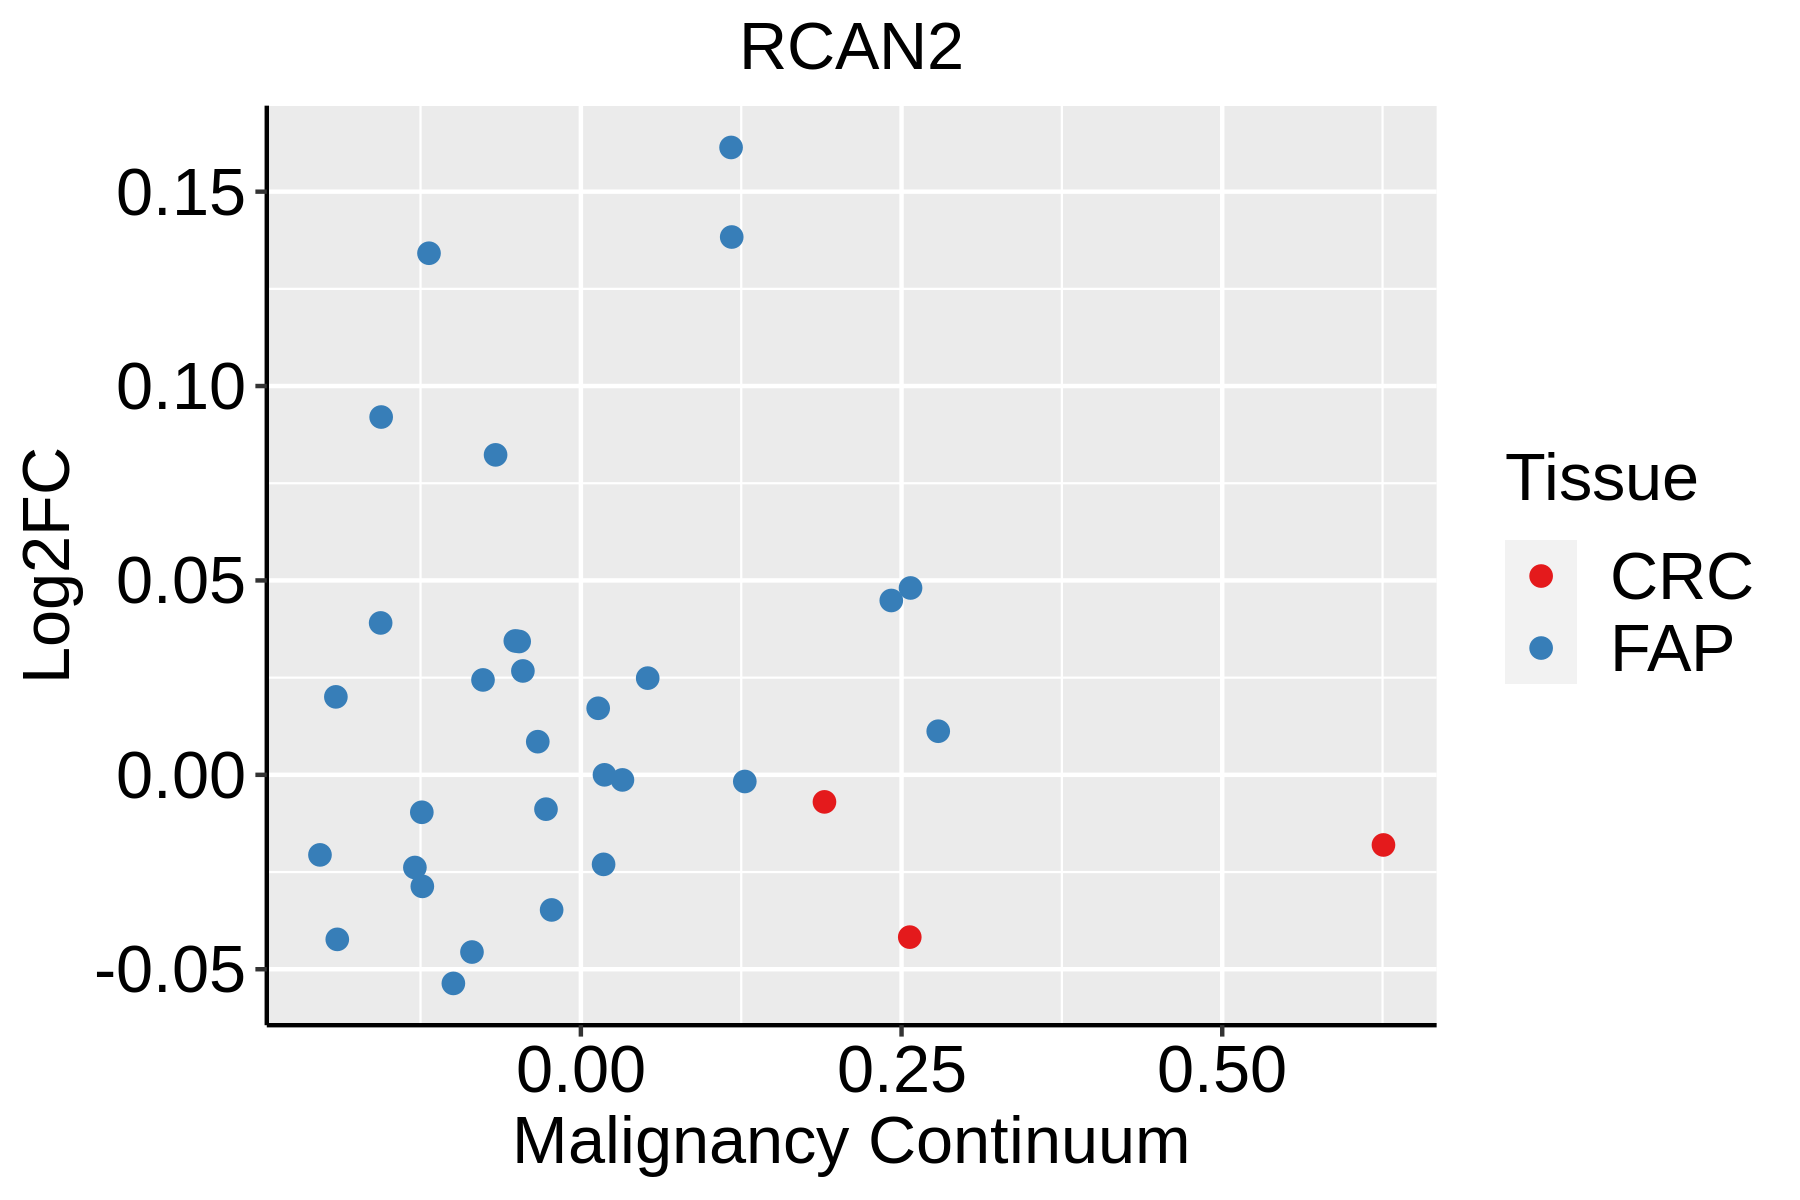 | FAP: Familial adenomatous polyposis |
| CRC: Colorectal cancer | ||
| Colorectum (HTA11) |  | AD: Adenomas |
| SER: Sessile serrated lesions | ||
| MSI-H: Microsatellite-high colorectal cancer | ||
| MSS: Microsatellite stable colorectal cancer | ||
| Lung | 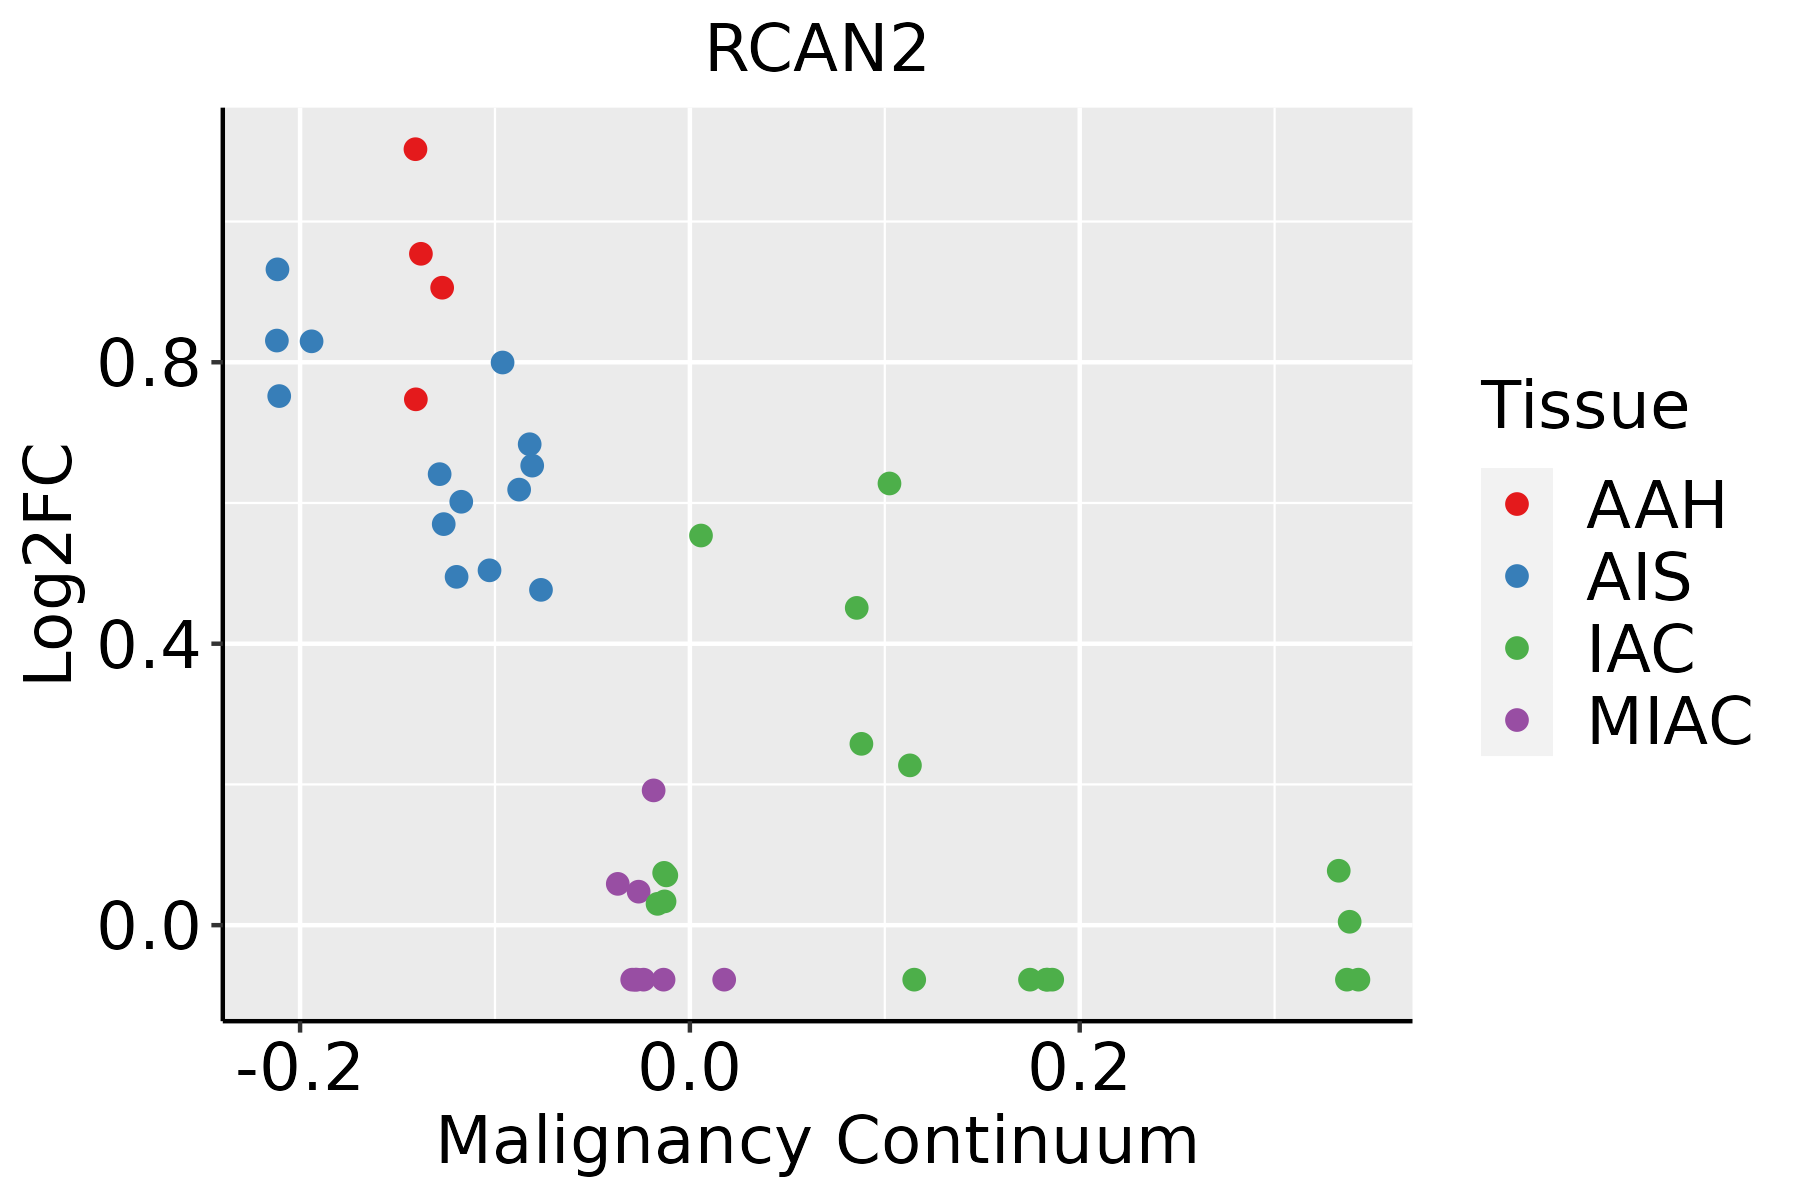 | AAH: Atypical adenomatous hyperplasia |
| AIS: Adenocarcinoma in situ | ||
| IAC: Invasive lung adenocarcinoma | ||
| MIA: Minimally invasive adenocarcinoma |
| ∗log2FC in expression of this searched gene in stem-like cells from each diseased tissue sample relative to stem-like cells in normal samples in each tissue plotted against the malignancy continuum. Samples are colored based on if they are from different disease stage. |
Top |
Malignant transformation related pathway analysis |
| Find out the enriched GO biological processes and KEGG pathways involved in transition from healthy to precancer to cancer |
| Tissue | Disease Stage | Enriched GO biological Processes |
| Colorectum | AD |  |
| Colorectum | SER |  |
| Colorectum | MSS |  |
| Colorectum | MSI-H |  |
| Colorectum | FAP |  |
| ∗Top 15 enriched GO BP terms are showed in the bar plot of each disease state in each tissue. Each row represents a significant GO biological process which is colored according to the -log10(p.adjust). |
| Page: 1 2 3 4 5 6 7 8 9 |
| GO ID | Tissue | Disease Stage | Description | Gene Ratio | Bg Ratio | pvalue | p.adjust | Count |
| GO:0019932 | Lung | AIS | second-messenger-mediated signaling | 46/1849 | 312/18723 | 3.79e-03 | 3.52e-02 | 46 |
| Page: 1 |
| Pathway ID | Tissue | Disease Stage | Description | Gene Ratio | Bg Ratio | pvalue | p.adjust | qvalue | Count |
| hsa0491921 | Lung | AIS | Thyroid hormone signaling pathway | 27/961 | 121/8465 | 3.92e-04 | 3.85e-03 | 2.47e-03 | 27 |
| hsa0491931 | Lung | AIS | Thyroid hormone signaling pathway | 27/961 | 121/8465 | 3.92e-04 | 3.85e-03 | 2.47e-03 | 27 |
| Page: 1 |
Top |
Cell-cell communication analysis |
| Identification of potential cell-cell interactions between two cell types and their ligand-receptor pairs for different disease states |
| Ligand | Receptor | LRpair | Pathway | Tissue | Disease Stage |
| Page: 1 |
Top |
Single-cell gene regulatory network inference analysis |
| Find out the significant the regulons (TFs) and the target genes of each regulon across cell types for different disease states |
| TF | Cell Type | Tissue | Disease Stage | Target Gene | RSS | Regulon Activity |
| ∗The dot plots of a searched regulon are shown for all cell subpopulations in each disease state of each tissue based on the regulon specific score inferred using pySCENIC and by calculating the average expression. |
| Page: 1 |
Top |
Somatic mutation of malignant transformation related genes |
| Annotation of somatic variants for genes involved in malignant transformation |
| Hugo Symbol | Variant Class | Variant Classification | dbSNP RS | HGVSc | HGVSp | HGVSp Short | SWISSPROT | BIOTYPE | SIFT | PolyPhen | Tumor Sample Barcode | Tissue | Histology | Sex | Age | Stage | Therapy Types | Drugs | Outcome |
| RCAN2 | SNV | Missense_Mutation | c.538G>T | p.Asp180Tyr | p.D180Y | Q14206 | protein_coding | deleterious(0) | probably_damaging(0.992) | TCGA-BH-A0C7-01 | Breast | breast invasive carcinoma | Female | <65 | I/II | Chemotherapy | adriamycin | CR | |
| RCAN2 | SNV | Missense_Mutation | c.366C>G | p.Phe122Leu | p.F122L | Q14206 | protein_coding | deleterious(0.02) | probably_damaging(0.999) | TCGA-C8-A1HJ-01 | Breast | breast invasive carcinoma | Female | <65 | I/II | Unknown | Unknown | SD | |
| RCAN2 | SNV | Missense_Mutation | novel | c.157A>G | p.Asn53Asp | p.N53D | Q14206 | protein_coding | tolerated(0.39) | benign(0.133) | TCGA-2W-A8YY-01 | Cervix | cervical & endocervical cancer | Female | <65 | I/II | Chemotherapy | cisplatin | CR |
| RCAN2 | SNV | Missense_Mutation | c.466N>A | p.Leu156Ile | p.L156I | Q14206 | protein_coding | deleterious(0) | probably_damaging(0.944) | TCGA-FU-A3HZ-01 | Cervix | cervical & endocervical cancer | Female | <65 | I/II | Chemotherapy | cisplatin | CR | |
| RCAN2 | SNV | Missense_Mutation | novel | c.296G>A | p.Arg99His | p.R99H | Q14206 | protein_coding | deleterious(0.01) | benign(0.208) | TCGA-AA-3950-01 | Colorectum | colon adenocarcinoma | Female | >=65 | I/II | Unknown | Unknown | SD |
| RCAN2 | SNV | Missense_Mutation | c.265N>A | p.Val89Met | p.V89M | Q14206 | protein_coding | deleterious(0) | possibly_damaging(0.839) | TCGA-AZ-4313-01 | Colorectum | colon adenocarcinoma | Female | <65 | I/II | Unknown | Unknown | SD | |
| RCAN2 | SNV | Missense_Mutation | rs770255594 | c.700C>T | p.Arg234Cys | p.R234C | Q14206 | protein_coding | tolerated(0.16) | probably_damaging(0.998) | TCGA-D5-6930-01 | Colorectum | colon adenocarcinoma | Male | >=65 | I/II | Unknown | Unknown | SD |
| RCAN2 | SNV | Missense_Mutation | c.440N>A | p.Ala147Asp | p.A147D | Q14206 | protein_coding | tolerated(0.15) | possibly_damaging(0.798) | TCGA-AP-A051-01 | Endometrium | uterine corpus endometrioid carcinoma | Female | >=65 | I/II | Unknown | Unknown | SD | |
| RCAN2 | SNV | Missense_Mutation | novel | c.666N>T | p.Lys222Asn | p.K222N | Q14206 | protein_coding | tolerated(0.15) | probably_damaging(0.976) | TCGA-AP-A0LM-01 | Endometrium | uterine corpus endometrioid carcinoma | Female | <65 | III/IV | Chemotherapy | cisplatin | SD |
| RCAN2 | SNV | Missense_Mutation | c.399N>T | p.Gln133His | p.Q133H | Q14206 | protein_coding | deleterious(0) | probably_damaging(0.959) | TCGA-AX-A06F-01 | Endometrium | uterine corpus endometrioid carcinoma | Female | <65 | III/IV | Chemotherapy | carboplatin | SD |
| Page: 1 2 3 |
Top |
Related drugs of malignant transformation related genes |
| Identification of chemicals and drugs interact with genes involved in malignant transfromation |
| (DGIdb 4.0) |
| Entrez ID | Symbol | Category | Interaction Types | Drug Claim Name | Drug Name | PMIDs |
| Page: 1 |

Copyright 2023-Present -The University of Texas Health Science Center at Houston |