Schematic overview of the cellular and molecular mechanisms involved in the cancer progression, including the proposed cellular and molecular mechanisms in cancer cells trajectory. AT1: alveolar type 1 cells; AT2: alveolar type 2 cells; AAH: atypical adenomatous hyperplasia; AIS: adenocarcinoma in situ; MIA: minimally invasive adenocarcinoma; IA: invasive adenocarcinoma; EMT: epithelial-mesenchymal transition

Home

Download

Statistics

Help

Contact

Center for Computational Systems Medicine
leaf

Gene summary

leaf

Malignant transformation analysis

leaf

Malignant transformation related pathway analysis

leaf

Cell-cell communication analysis

leaf

Single-cell gene regulatory network inference analysis

leaf

Somatic mutation of malignant transformation related genes

leaf

Related drugs of malignant transformation related genes

Gene: RC3H2

Gene summary for RC3H2

check button Gene summary.

Gene informationSpeciesHuman
Gene symbol

RC3H2

Gene ID

54542

Gene namering finger and CCCH-type domains 2
Gene AliasMNAB
Cytomap9q33.2
Gene Typeprotein-coding
GO ID

GO:0000209

UniProtAcc

A0A024R899


Top

Malignant transformation analysis

check button Identification of the aberrant gene expression in precancerous and cancerous lesions by comparing the gene expression of stem-like cells in diseased tissues with normal stem cells
check button Malignant transformation involving gene list.
Entrez IDSymbolReplicatesSpeciesOrganTissueAdj P-valueLog2FCMalignancy
54542RC3H2CCI_1HumanCervixCC5.64e-045.02e-010.528
54542RC3H2CCI_2HumanCervixCC1.93e-101.16e+000.5249
54542RC3H2CCI_3HumanCervixCC6.11e-097.17e-010.516
54542RC3H2LZE4THumanEsophagusESCC1.74e-093.12e-010.0811
54542RC3H2LZE5THumanEsophagusESCC8.16e-054.14e-010.0514
54542RC3H2LZE7THumanEsophagusESCC2.07e-054.73e-010.0667
54542RC3H2LZE20THumanEsophagusESCC8.89e-042.55e-010.0662
54542RC3H2LZE24THumanEsophagusESCC4.15e-183.79e-010.0596
54542RC3H2LZE21THumanEsophagusESCC1.63e-042.23e-010.0655
54542RC3H2P1T-EHumanEsophagusESCC3.58e-053.38e-010.0875
54542RC3H2P2T-EHumanEsophagusESCC5.18e-254.76e-010.1177
54542RC3H2P4T-EHumanEsophagusESCC5.59e-183.55e-010.1323
54542RC3H2P5T-EHumanEsophagusESCC1.72e-081.14e-010.1327
54542RC3H2P8T-EHumanEsophagusESCC2.04e-162.48e-010.0889
54542RC3H2P9T-EHumanEsophagusESCC1.53e-122.67e-010.1131
54542RC3H2P10T-EHumanEsophagusESCC1.62e-214.13e-010.116
54542RC3H2P11T-EHumanEsophagusESCC4.99e-033.51e-010.1426
54542RC3H2P12T-EHumanEsophagusESCC1.30e-172.83e-010.1122
54542RC3H2P15T-EHumanEsophagusESCC4.59e-102.99e-010.1149
54542RC3H2P16T-EHumanEsophagusESCC1.17e-131.76e-010.1153
Page: 1 2 3 4 5 6 

check button Transcriptomic changes along malignancy continuum.
TissueExpression DynamicsAbbreviation
CervixThe image shows the transcriptomic changes along malignancy continuum.log2FC in expression of this searched gene in stem-like cells from each diseased tissue sample relative to stem-like cells in normal samples in each tissue plotted against the malignancy continuum. Samples are colored based on if they are from different disease stage.CC: Cervix cancer
HSIL_HPV: HPV-infected high-grade squamous intraepithelial lesions
N_HPV: HPV-infected normal cervix
EsophagusThe image shows the transcriptomic changes along malignancy continuum.log2FC in expression of this searched gene in stem-like cells from each diseased tissue sample relative to stem-like cells in normal samples in each tissue plotted against the malignancy continuum. Samples are colored based on if they are from different disease stage.
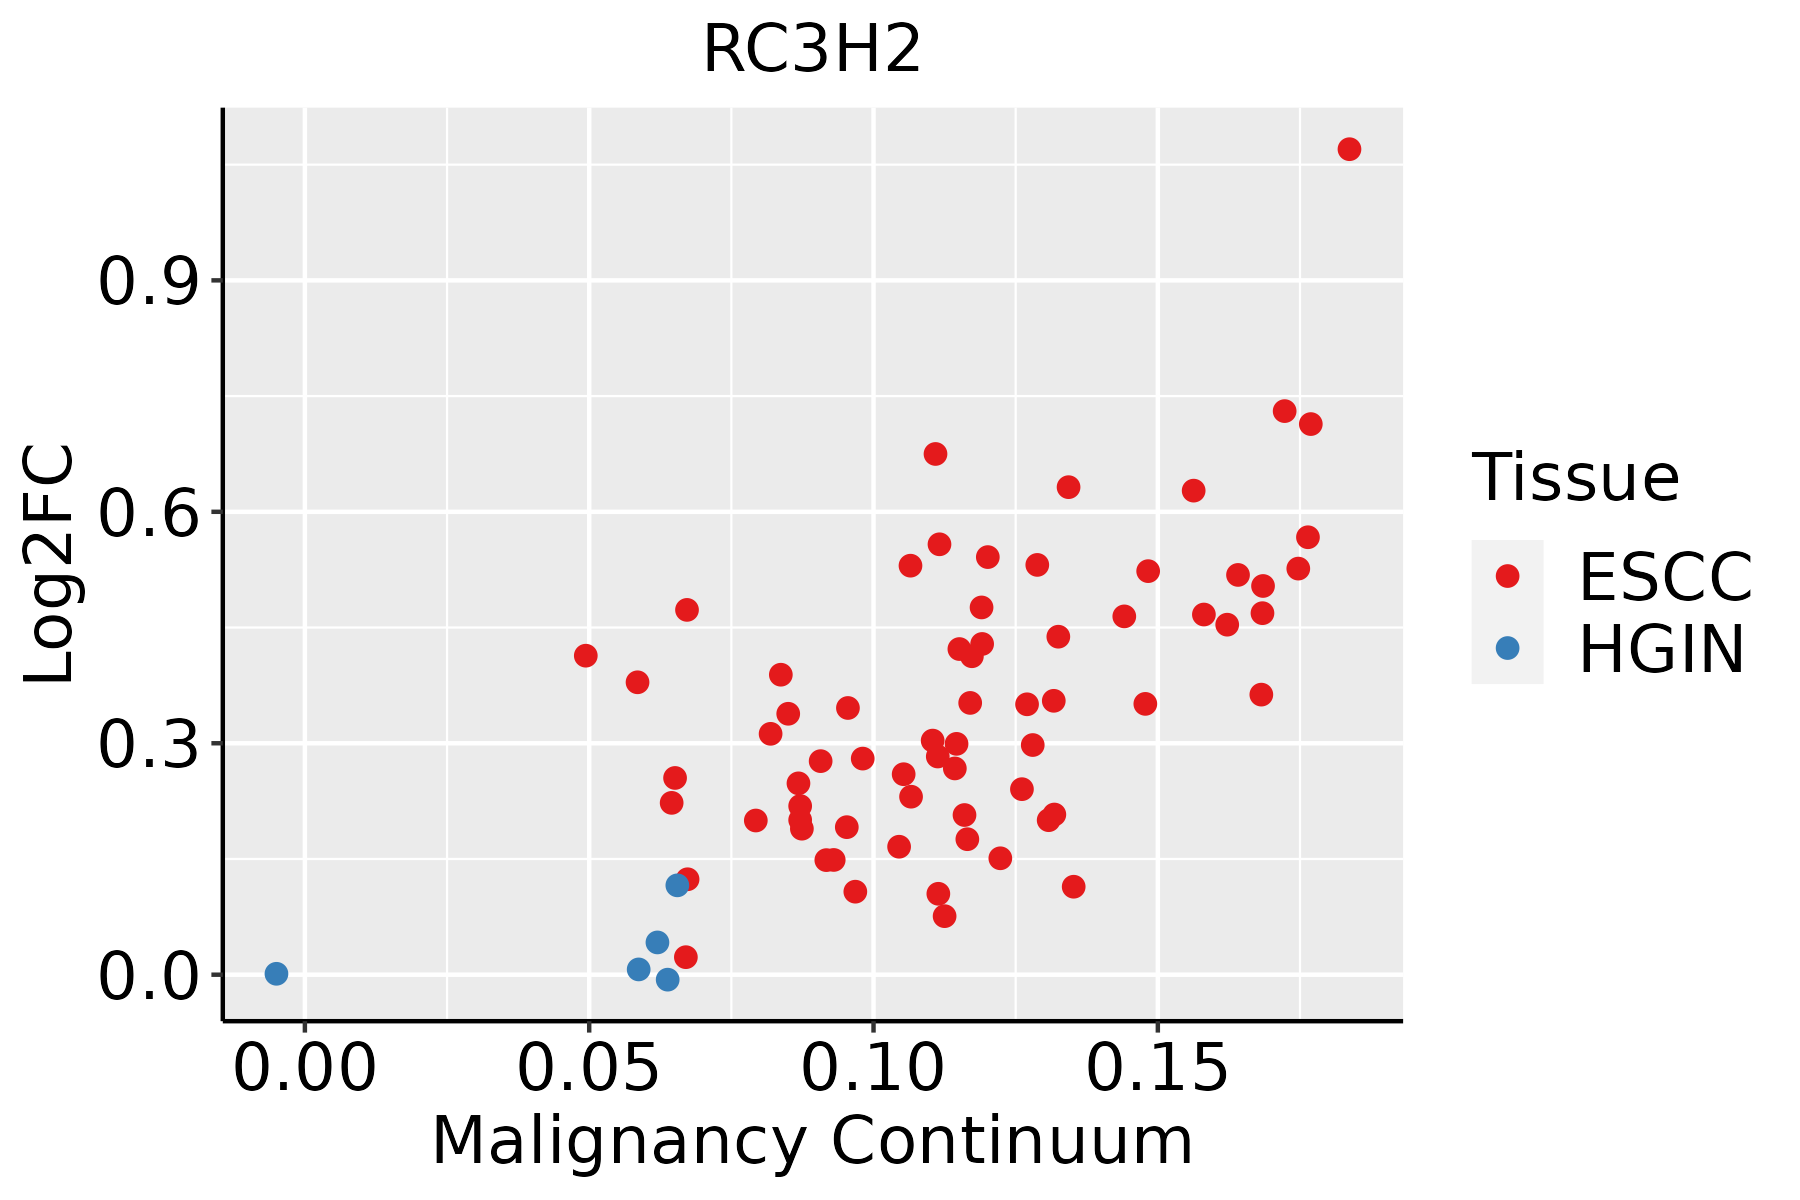
ESCC: Esophageal squamous cell carcinoma
HGIN: High-grade intraepithelial neoplasias
LGIN: Low-grade intraepithelial neoplasias
LiverThe image shows the transcriptomic changes along malignancy continuum.log2FC in expression of this searched gene in stem-like cells from each diseased tissue sample relative to stem-like cells in normal samples in each tissue plotted against the malignancy continuum. Samples are colored based on if they are from different disease stage.HCC: Hepatocellular carcinoma
NAFLD: Non-alcoholic fatty liver disease
Oral CavityThe image shows the transcriptomic changes along malignancy continuum.log2FC in expression of this searched gene in stem-like cells from each diseased tissue sample relative to stem-like cells in normal samples in each tissue plotted against the malignancy continuum. Samples are colored based on if they are from different disease stage.EOLP: Erosive Oral lichen planus
LP: leukoplakia
NEOLP: Non-erosive oral lichen planus
OSCC: Oral squamous cell carcinoma
SkinThe image shows the transcriptomic changes along malignancy continuum.log2FC in expression of this searched gene in stem-like cells from each diseased tissue sample relative to stem-like cells in normal samples in each tissue plotted against the malignancy continuum. Samples are colored based on if they are from different disease stage.AK: Actinic keratosis
cSCC: Cutaneous squamous cell carcinoma
SCCIS:squamous cell carcinoma in situ
ThyroidThe image shows the transcriptomic changes along malignancy continuum.log2FC in expression of this searched gene in stem-like cells from each diseased tissue sample relative to stem-like cells in normal samples in each tissue plotted against the malignancy continuum. Samples are colored based on if they are from different disease stage.ATC: Anaplastic thyroid cancer
HT: Hashimoto's thyroiditis
PTC: Papillary thyroid cancer
∗log2FC in expression of this searched gene in stem-like cells from each diseased tissue sample relative to stem-like cells in normal samples in each tissue plotted against the malignancy continuum. Samples are colored based on if they are from different disease stage.

Top

Malignant transformation related pathway analysis

check buttonFind out the enriched GO biological processes and KEGG pathways involved in transition from healthy to precancer to cancer
check button Figure of enriched GO biological processes.
TissueDisease StageEnriched GO biological Processes
ColorectumADGO analysis - Figure of enriched GO biological processes: Top 15 enriched GO BP terms are showed in the bar plot of each disease state in each tissue. Each row represents a significant GO biological process which is colored according to the -log10(p.adjust).
ColorectumSERGO analysis - Figure of enriched GO biological processes: Top 15 enriched GO BP terms are showed in the bar plot of each disease state in each tissue. Each row represents a significant GO biological process which is colored according to the -log10(p.adjust).
ColorectumMSSGO analysis - Figure of enriched GO biological processes: Top 15 enriched GO BP terms are showed in the bar plot of each disease state in each tissue. Each row represents a significant GO biological process which is colored according to the -log10(p.adjust).
ColorectumMSI-HGO analysis - Figure of enriched GO biological processes: Top 15 enriched GO BP terms are showed in the bar plot of each disease state in each tissue. Each row represents a significant GO biological process which is colored according to the -log10(p.adjust).
ColorectumFAPGO analysis - Figure of enriched GO biological processes: Top 15 enriched GO BP terms are showed in the bar plot of each disease state in each tissue. Each row represents a significant GO biological process which is colored according to the -log10(p.adjust).
∗Top 15 enriched GO BP terms are showed in the bar plot of each disease state in each tissue. Each row represents a significant GO biological process which is colored according to the -log10(p.adjust).
Page: 1 2 3 4 5 6 7 8 9 

check button Enriched GO biological processes.
GO IDTissueDisease StageDescriptionGene RatioBg Ratiopvaluep.adjustCount
GO:002240710CervixCCregulation of cell-cell adhesion103/2311448/187231.78e-102.87e-08103
GO:000989610CervixCCpositive regulation of catabolic process109/2311492/187235.26e-106.99e-08109
GO:00421108CervixCCT cell activation107/2311487/187231.24e-091.46e-07107
GO:00508638CervixCCregulation of T cell activation80/2311329/187231.28e-091.47e-0780
GO:00071598CervixCCleukocyte cell-cell adhesion85/2311371/187238.27e-097.07e-0785
GO:00071626CervixCCnegative regulation of cell adhesion72/2311303/187232.36e-081.70e-0672
GO:00026837CervixCCnegative regulation of immune system process94/2311434/187232.63e-081.87e-0694
GO:19030378CervixCCregulation of leukocyte cell-cell adhesion77/2311336/187234.08e-082.54e-0677
GO:003133110CervixCCpositive regulation of cellular catabolic process91/2311427/187239.64e-085.25e-0691
GO:00027644CervixCCimmune response-regulating signaling pathway97/2311468/187231.49e-077.07e-0697
GO:00002097CervixCCprotein polyubiquitination58/2311236/187231.57e-077.41e-0658
GO:190370610CervixCCregulation of hemopoiesis80/2311367/187232.14e-079.55e-0680
GO:00064029CervixCCmRNA catabolic process56/2311232/187234.81e-071.83e-0556
GO:00420988CervixCCT cell proliferation49/2311199/187231.32e-064.49e-0549
GO:19033119CervixCCregulation of mRNA metabolic process64/2311288/187231.71e-065.64e-0564
GO:00224084CervixCCnegative regulation of cell-cell adhesion48/2311196/187231.99e-066.18e-0548
GO:004887210CervixCChomeostasis of number of cells61/2311272/187232.17e-066.55e-0561
GO:00064019CervixCCRNA catabolic process62/2311278/187232.18e-066.56e-0562
GO:19021056CervixCCregulation of leukocyte differentiation61/2311279/187235.16e-061.29e-0461
GO:19021064CervixCCnegative regulation of leukocyte differentiation29/2311102/187231.02e-052.29e-0429
Page: 1 2 3 4 5 6 7 8 9 10 11 12 13 14 15 16 17 18 19 20 21 22 

check button Enriched KEGG pathways.
Pathway IDTissueDisease StageDescriptionGene RatioBg Ratiopvaluep.adjustqvalueCount
Page: 1 

Top

Cell-cell communication analysis

check buttonIdentification of potential cell-cell interactions between two cell types and their ligand-receptor pairs for different disease states
LigandReceptorLRpairPathwayTissueDisease Stage
Page: 1 

Top

Single-cell gene regulatory network inference analysis

check buttonFind out the significant the regulons (TFs) and the target genes of each regulon across cell types for different disease states
TFCell TypeTissueDisease StageTarget GeneRSSRegulon Activity
∗The dot plots of a searched regulon are shown for all cell subpopulations in each disease state of each tissue based on the regulon specific score inferred using pySCENIC and by calculating the average expression.
Page: 1 

Top

Somatic mutation of malignant transformation related genes

check buttonAnnotation of somatic variants for genes involved in malignant transformation
Hugo SymbolVariant ClassVariant ClassificationdbSNP RSHGVScHGVSpHGVSp ShortSWISSPROTBIOTYPESIFTPolyPhenTumor Sample BarcodeTissueHistologySexAgeStageTherapy TypesDrugsOutcome
RC3H2SNVMissense_Mutationnovelc.464N>Ap.Ala155Aspp.A155DQ9HBD1protein_codingdeleterious(0)possibly_damaging(0.72)TCGA-AC-A8OS-01Breastbreast invasive carcinomaFemale>=65I/IIUnknownUnknownSD
RC3H2SNVMissense_Mutationc.1393G>Tp.Val465Leup.V465LQ9HBD1protein_codingtolerated(0.5)possibly_damaging(0.785)TCGA-B6-A0RU-01Breastbreast invasive carcinomaFemale<65I/IIUnknownUnknownPD
RC3H2SNVMissense_Mutationc.2117A>Gp.Tyr706Cysp.Y706CQ9HBD1protein_codingdeleterious(0.01)probably_damaging(0.984)TCGA-D8-A140-01Breastbreast invasive carcinomaFemale<65I/IIChemotherapydoxorubicin+cyclophosphamidSD
RC3H2SNVMissense_Mutationnovelc.2009N>Tp.Ser670Phep.S670FQ9HBD1protein_codingtolerated(0.1)benign(0.445)TCGA-D8-A27G-01Breastbreast invasive carcinomaFemale>=65I/IIUnknownUnknownSD
RC3H2SNVMissense_Mutationc.1768C>Gp.Pro590Alap.P590AQ9HBD1protein_codingdeleterious(0.01)probably_damaging(0.956)TCGA-E2-A10C-01Breastbreast invasive carcinomaFemale<65I/IIChemotherapycytoxanSD
RC3H2SNVMissense_Mutationc.2123N>Ap.Arg708Glnp.R708QQ9HBD1protein_codingdeleterious(0.02)possibly_damaging(0.885)TCGA-EW-A1OV-01Breastbreast invasive carcinomaFemale<65I/IIChemotherapyepirubicinSD
RC3H2insertionNonsense_Mutationnovelc.2499_2500insCCCAAGTAGCTGGGATTATAGACATGCACCACCp.Leu833_Ser834insProLysTerLeuGlyLeuTerThrCysThrThrp.L833_S834insPK*LGL*TCTTQ9HBD1protein_codingTCGA-A2-A0EX-01Breastbreast invasive carcinomaFemale<65I/IIHormone TherapytamoxiphenSD
RC3H2SNVMissense_Mutationrs370277433c.2792N>Tp.Ala931Valp.A931VQ9HBD1protein_codingdeleterious(0.05)benign(0.018)TCGA-2W-A8YY-01Cervixcervical & endocervical cancerFemale<65I/IIChemotherapycisplatinCR
RC3H2SNVMissense_Mutationc.2737N>Tp.Arg913Cysp.R913CQ9HBD1protein_codingdeleterious(0)probably_damaging(0.973)TCGA-EA-A50E-01Cervixcervical & endocervical cancerFemale<65I/IIUnknownUnknownPD
RC3H2SNVMissense_Mutationc.1259N>Cp.Arg420Prop.R420PQ9HBD1protein_codingdeleterious(0.01)possibly_damaging(0.89)TCGA-IR-A3LA-01Cervixcervical & endocervical cancerFemale<65I/IIChemotherapycisplatinCR
Page: 1 2 3 4 5 6 7 8 9 10 11 12 13 

Top

Related drugs of malignant transformation related genes

check buttonIdentification of chemicals and drugs interact with genes involved in malignant transfromation
(DGIdb 4.0)
Entrez IDSymbolCategoryInteraction TypesDrug Claim NameDrug NamePMIDs
Page: 1