| Tissue | Expression Dynamics | Abbreviation |
| Cervix | 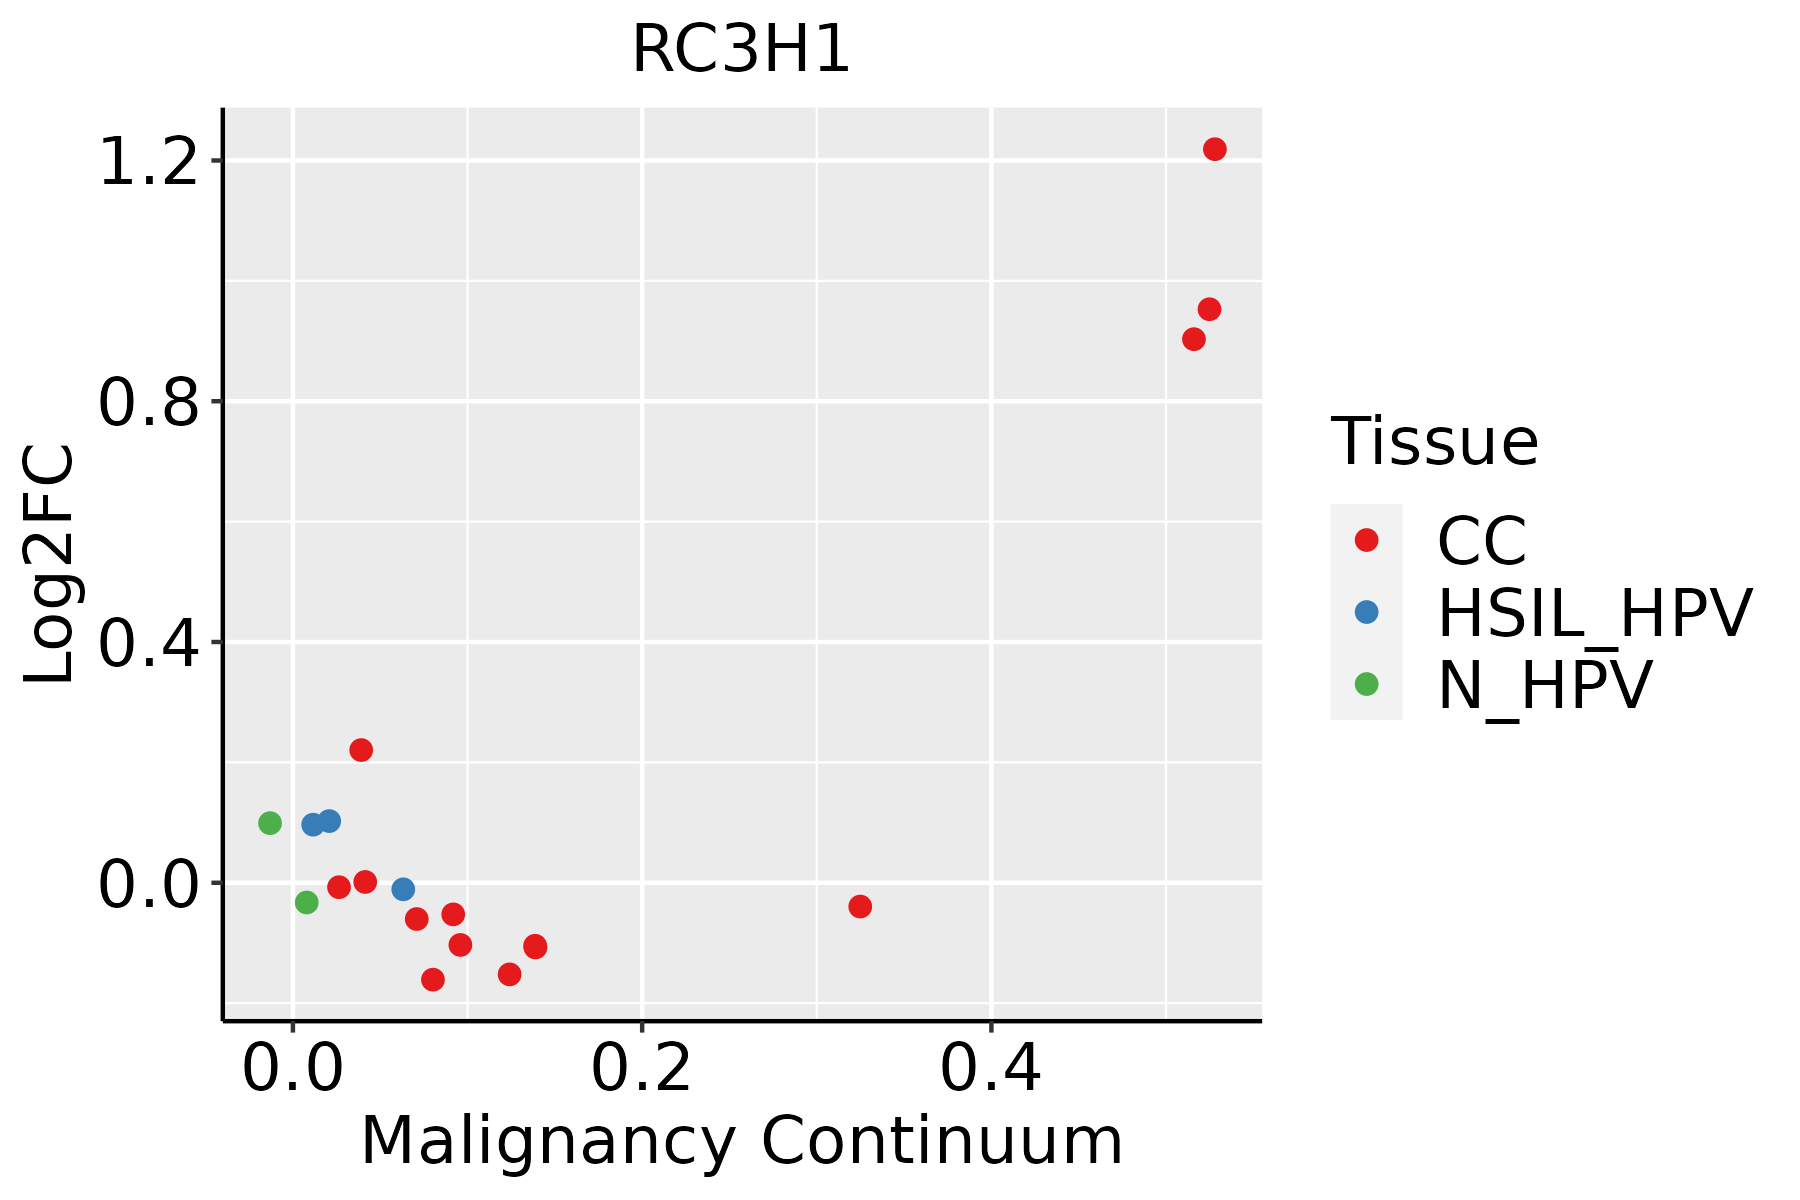 | CC: Cervix cancer |
| HSIL_HPV: HPV-infected high-grade squamous intraepithelial lesions |
| N_HPV: HPV-infected normal cervix |
| Colorectum (GSE201348) |  | FAP: Familial adenomatous polyposis |
| CRC: Colorectal cancer |
| Colorectum (HTA11) |  | AD: Adenomas |
| SER: Sessile serrated lesions |
| MSI-H: Microsatellite-high colorectal cancer |
| MSS: Microsatellite stable colorectal cancer |
| Endometrium | 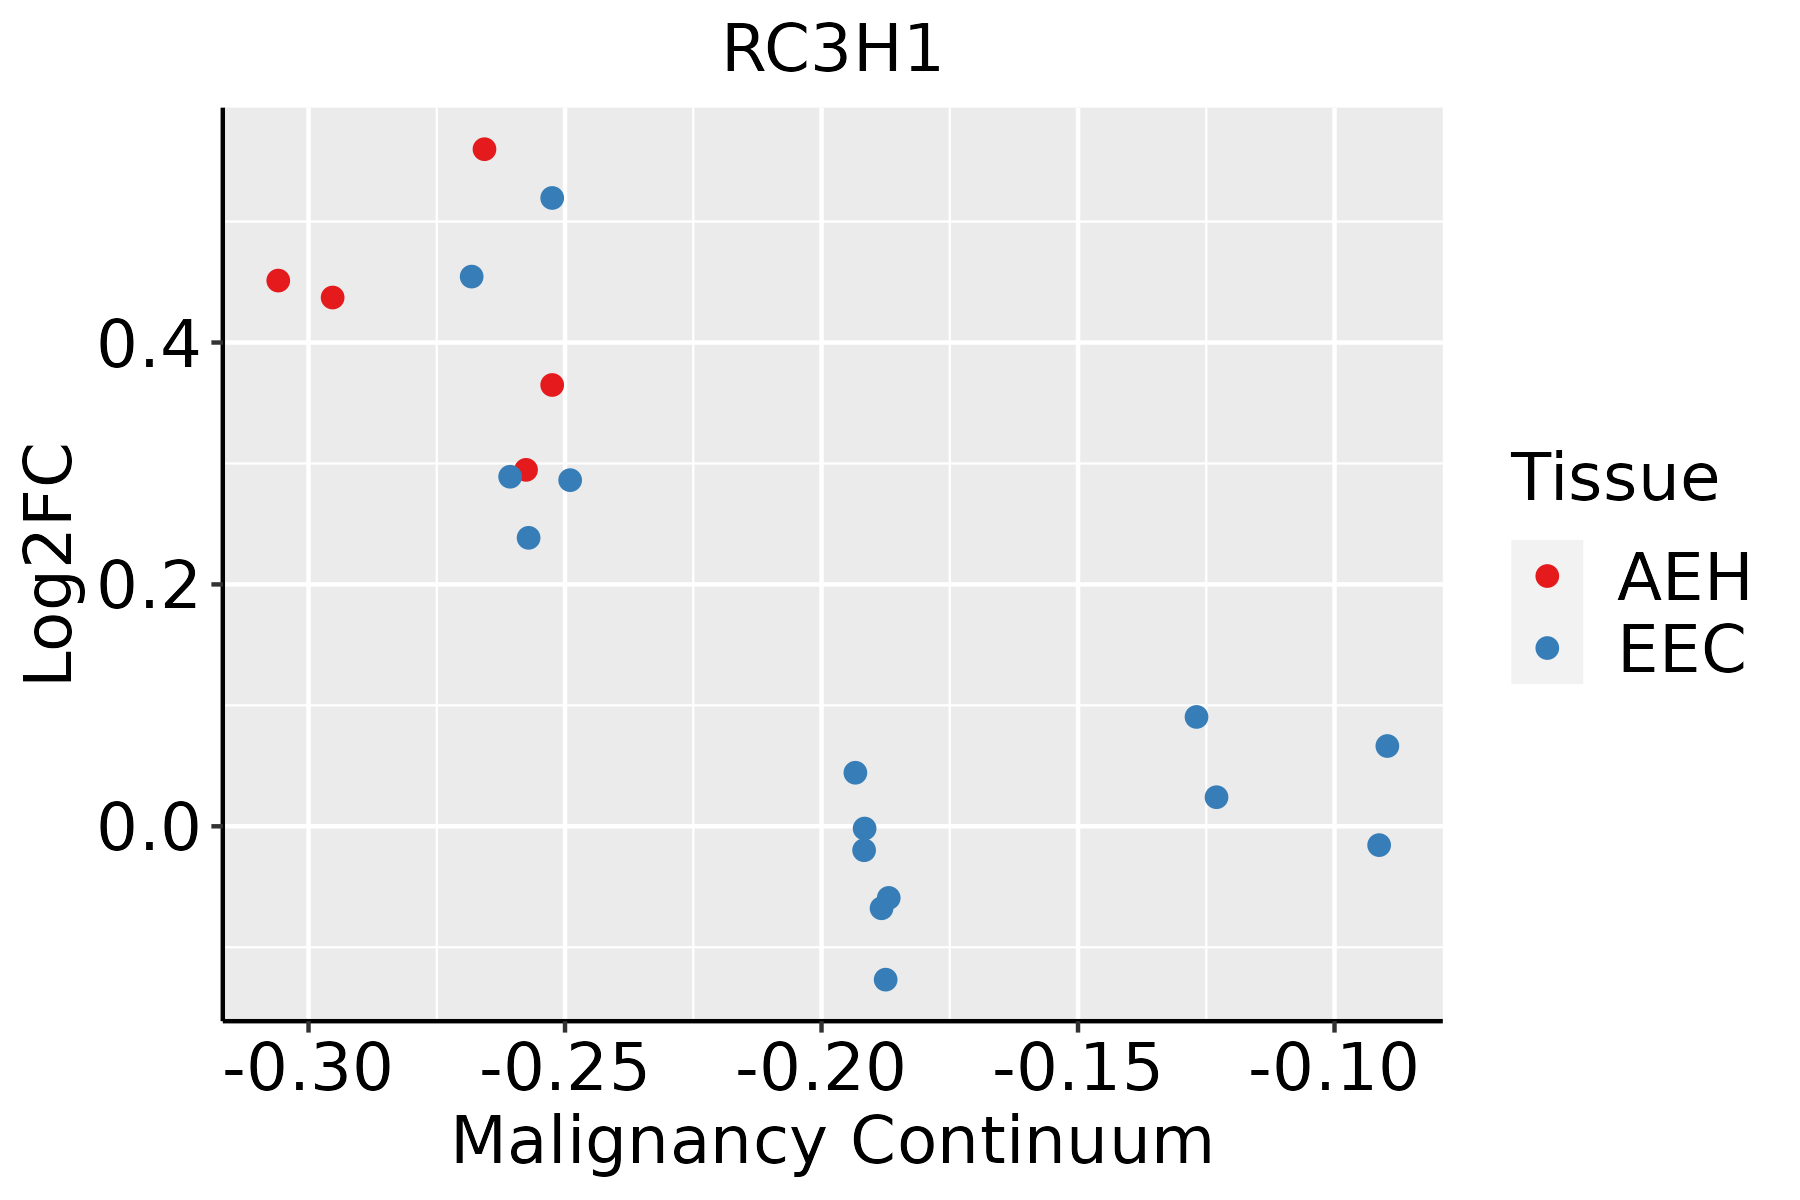 | AEH: Atypical endometrial hyperplasia |
| EEC: Endometrioid Cancer |
| Esophagus | 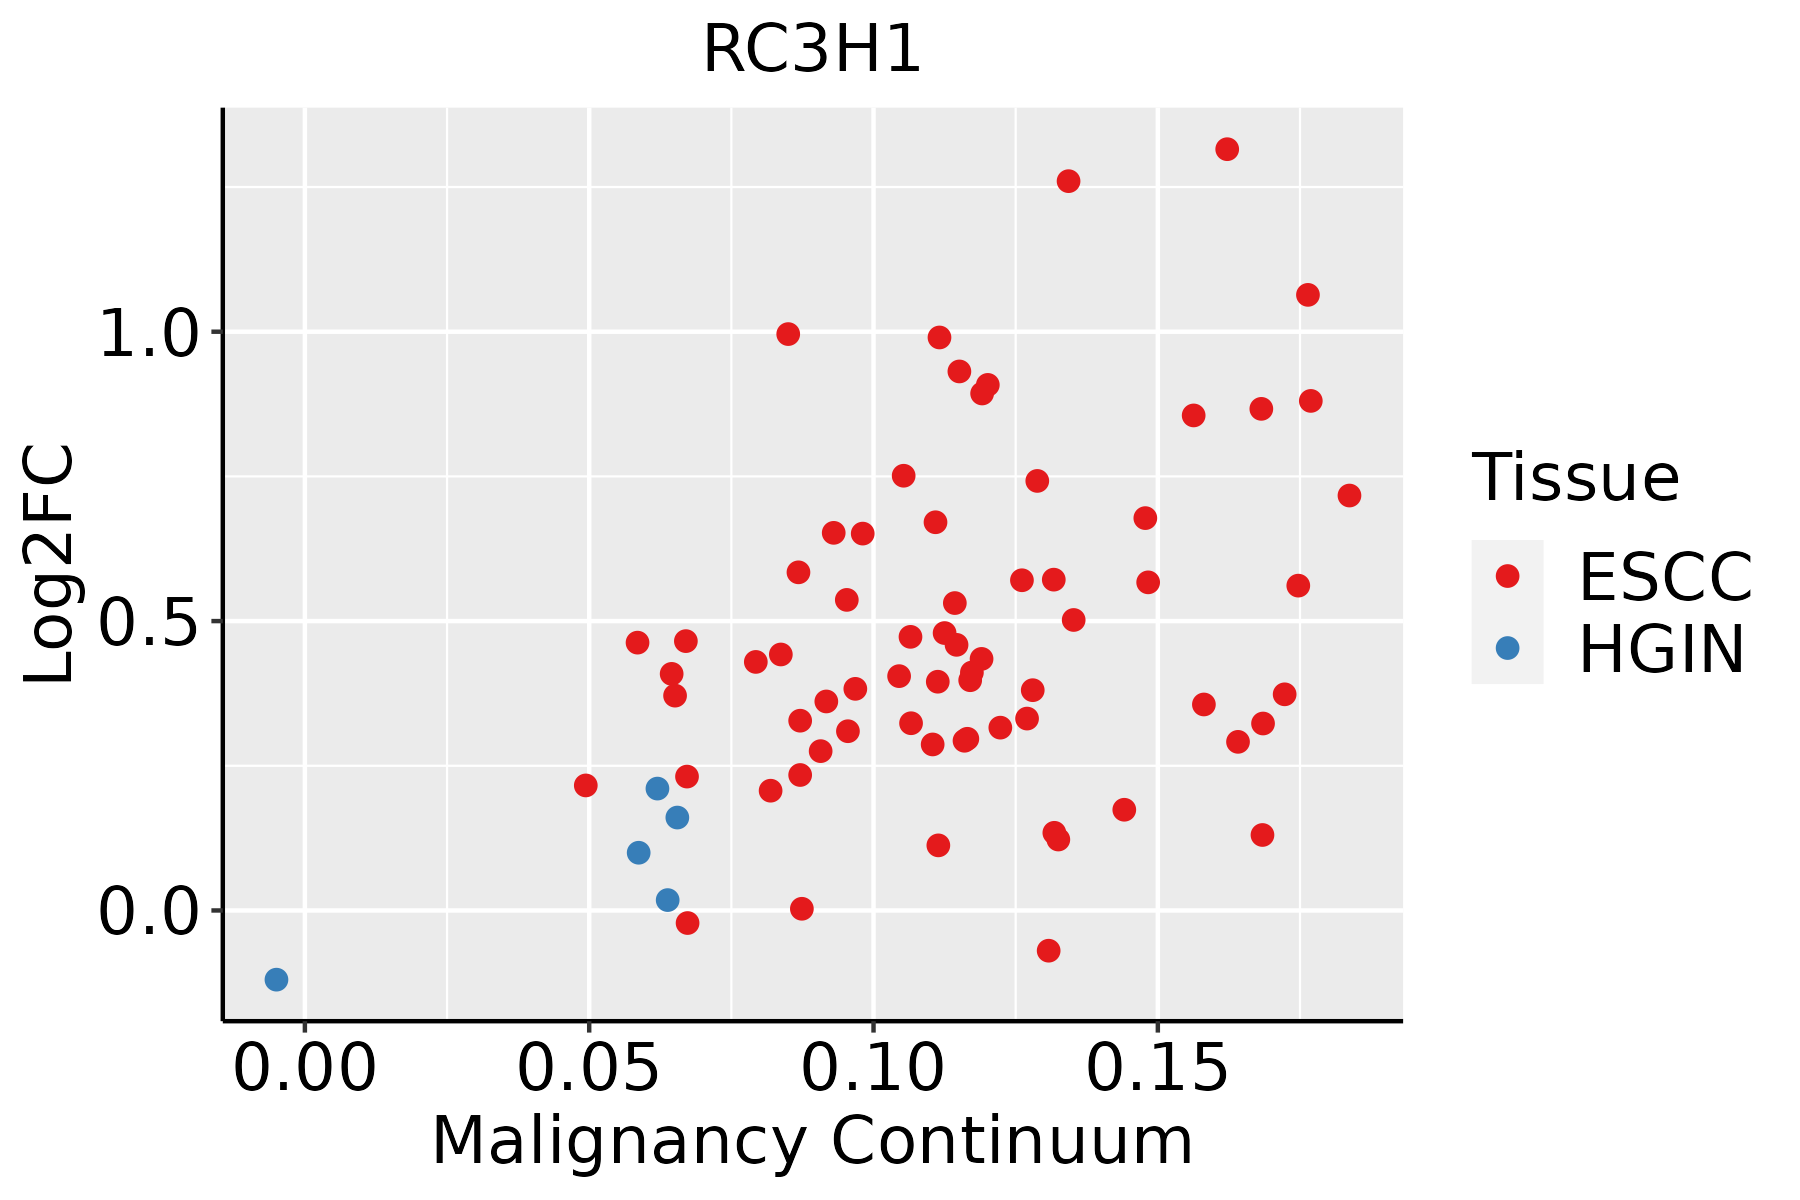 | ESCC: Esophageal squamous cell carcinoma |
| HGIN: High-grade intraepithelial neoplasias |
| LGIN: Low-grade intraepithelial neoplasias |
| Liver | 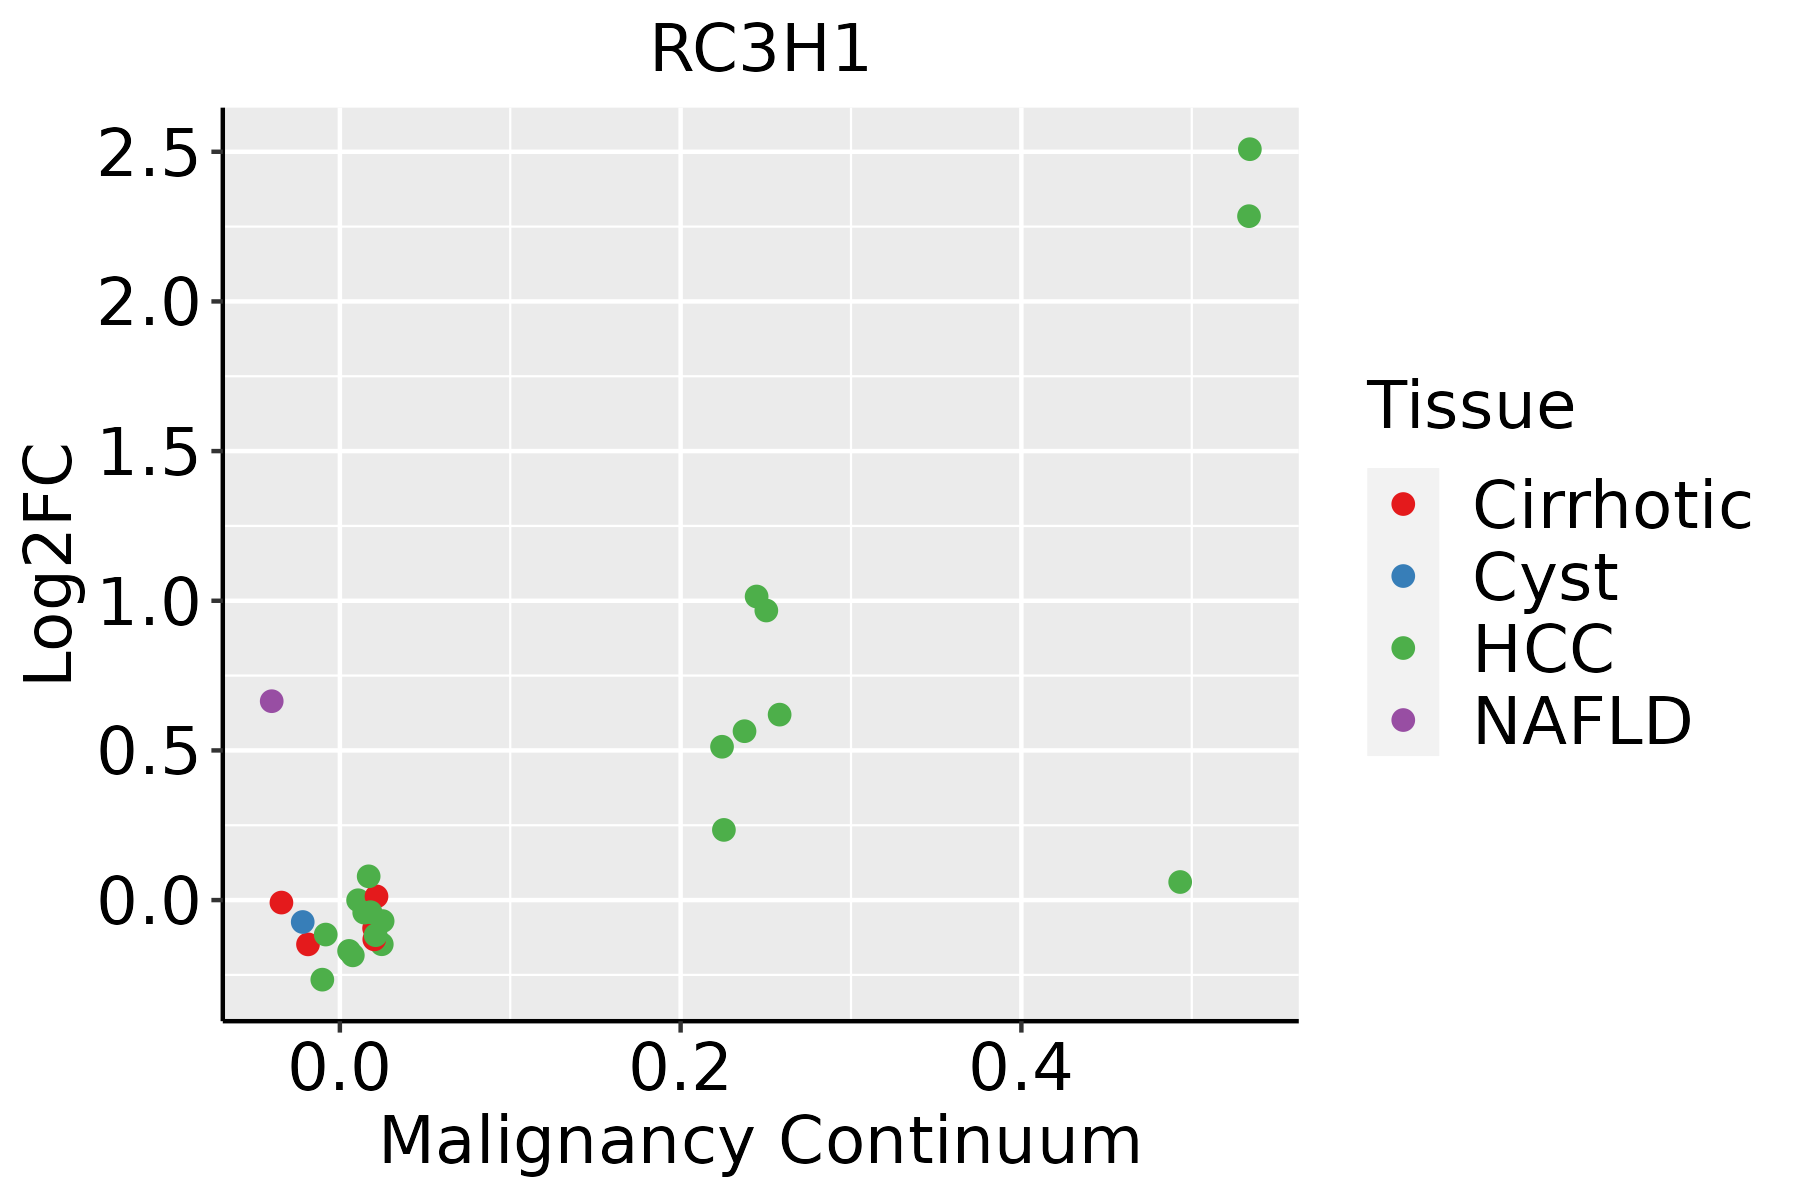 | HCC: Hepatocellular carcinoma |
| NAFLD: Non-alcoholic fatty liver disease |
| Lung |  | AAH: Atypical adenomatous hyperplasia |
| AIS: Adenocarcinoma in situ |
| IAC: Invasive lung adenocarcinoma |
| MIA: Minimally invasive adenocarcinoma |
| Prostate | 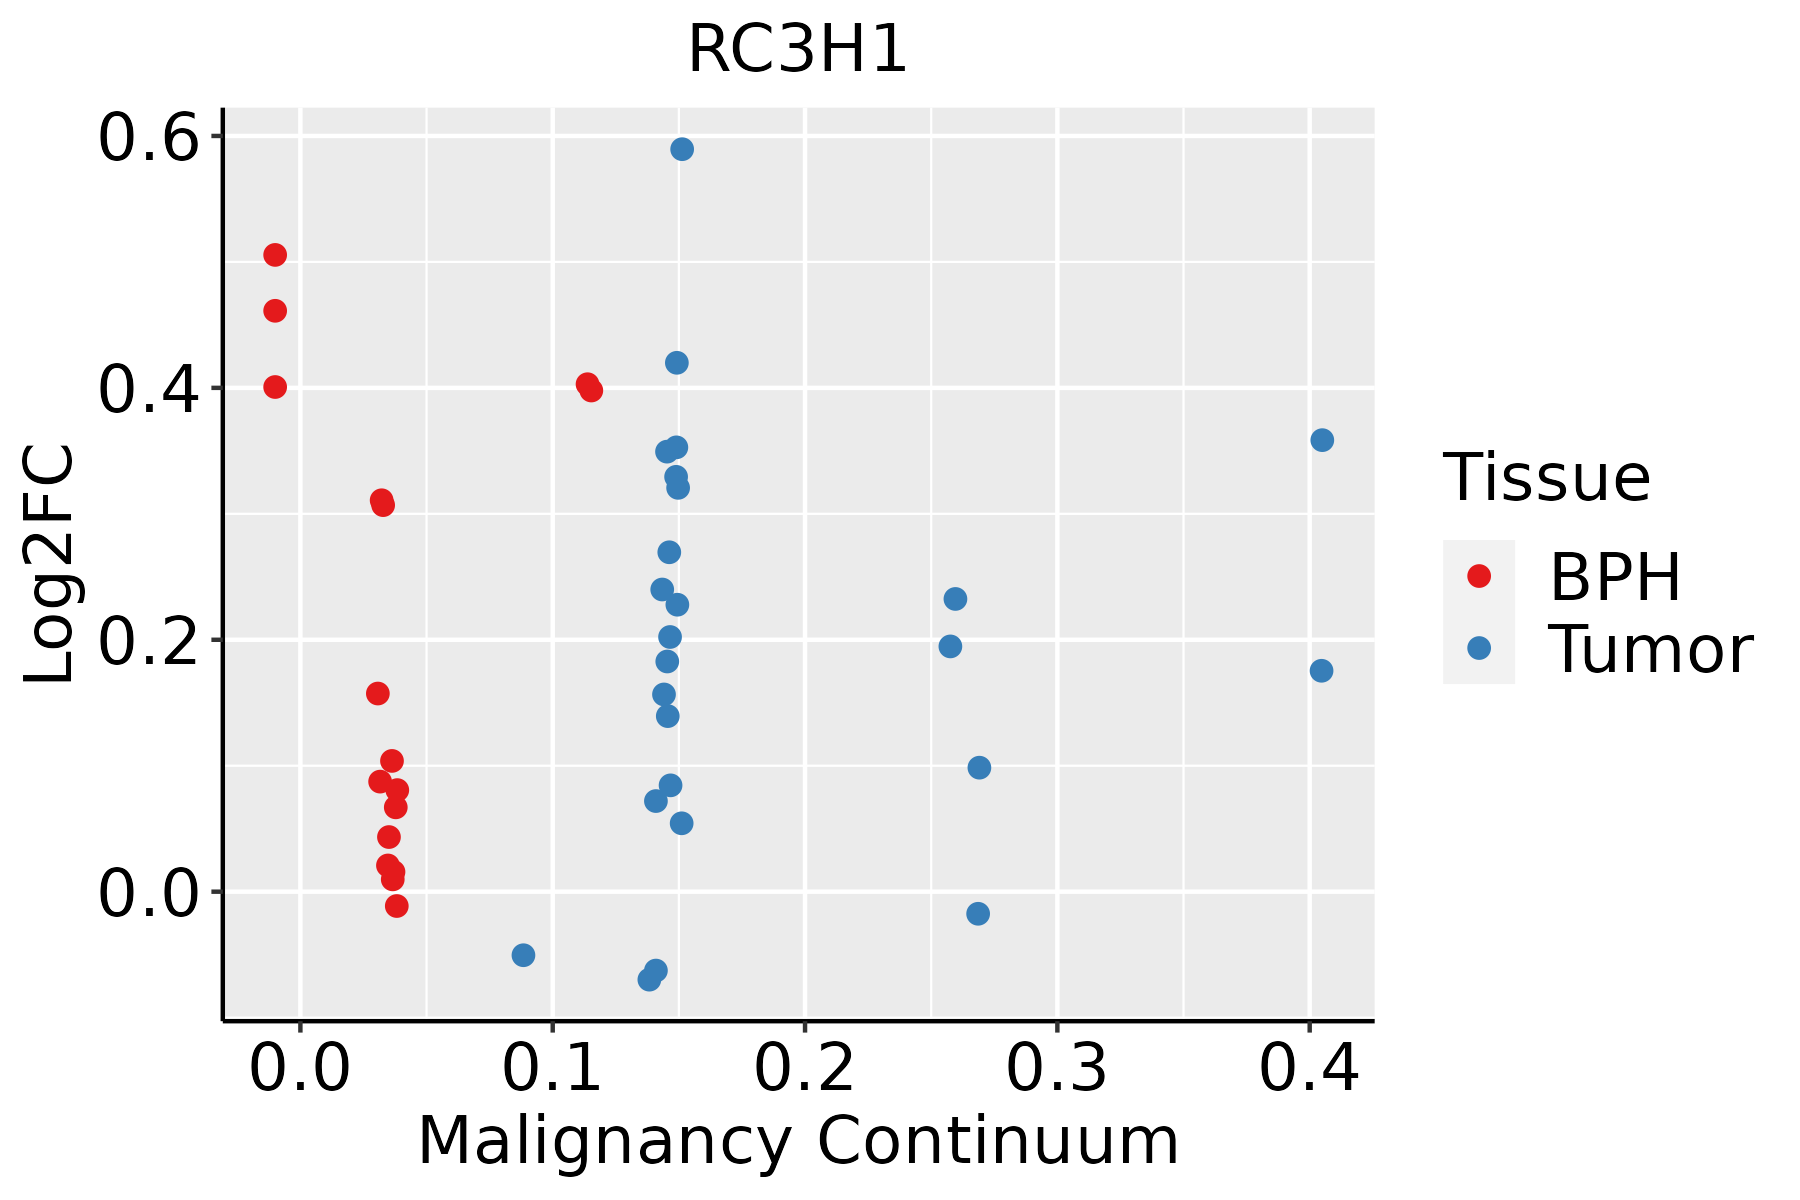 | BPH: Benign Prostatic Hyperplasia |
| Thyroid | 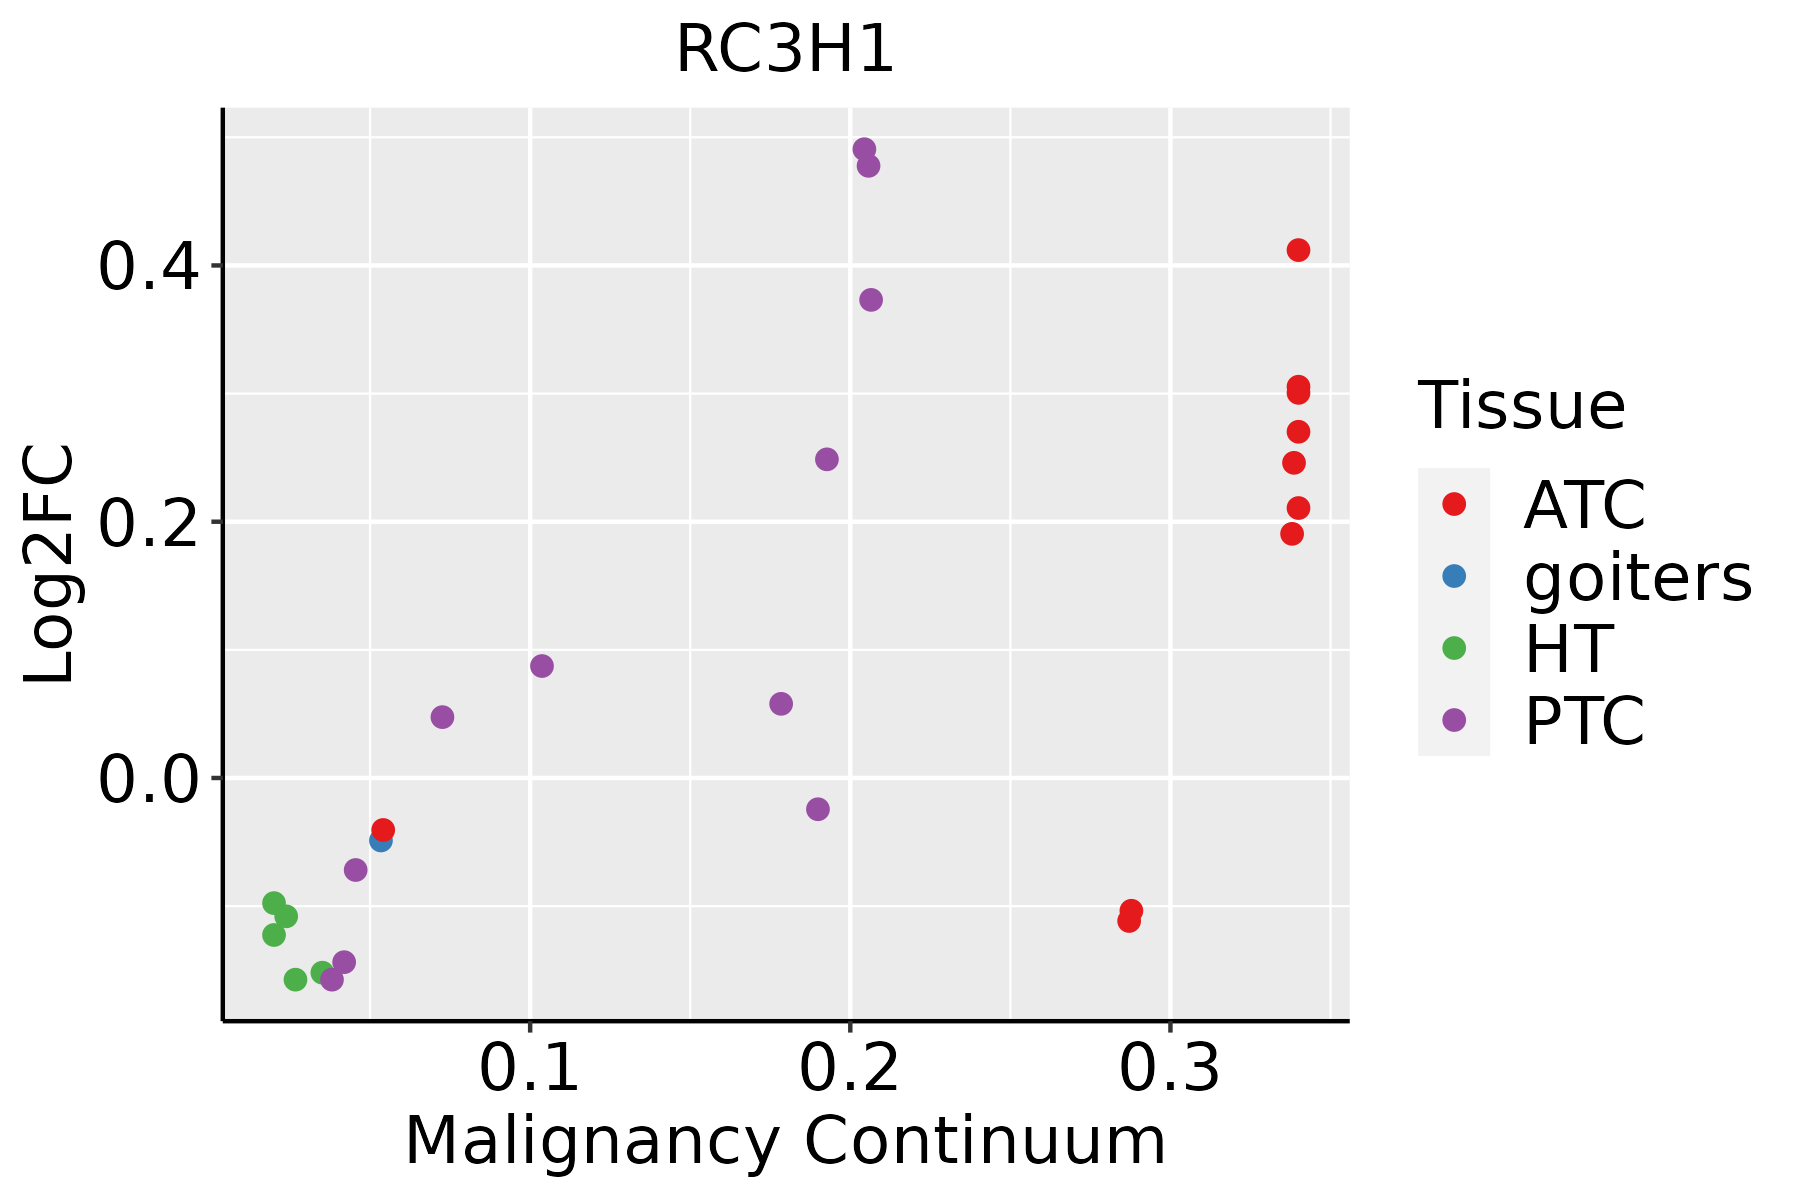 | ATC: Anaplastic thyroid cancer |
| HT: Hashimoto's thyroiditis |
| PTC: Papillary thyroid cancer |
| GO ID | Tissue | Disease Stage | Description | Gene Ratio | Bg Ratio | pvalue | p.adjust | Count |
| GO:002240710 | Cervix | CC | regulation of cell-cell adhesion | 103/2311 | 448/18723 | 1.78e-10 | 2.87e-08 | 103 |
| GO:000989610 | Cervix | CC | positive regulation of catabolic process | 109/2311 | 492/18723 | 5.26e-10 | 6.99e-08 | 109 |
| GO:00421108 | Cervix | CC | T cell activation | 107/2311 | 487/18723 | 1.24e-09 | 1.46e-07 | 107 |
| GO:00508638 | Cervix | CC | regulation of T cell activation | 80/2311 | 329/18723 | 1.28e-09 | 1.47e-07 | 80 |
| GO:00071598 | Cervix | CC | leukocyte cell-cell adhesion | 85/2311 | 371/18723 | 8.27e-09 | 7.07e-07 | 85 |
| GO:00071626 | Cervix | CC | negative regulation of cell adhesion | 72/2311 | 303/18723 | 2.36e-08 | 1.70e-06 | 72 |
| GO:00026837 | Cervix | CC | negative regulation of immune system process | 94/2311 | 434/18723 | 2.63e-08 | 1.87e-06 | 94 |
| GO:19030378 | Cervix | CC | regulation of leukocyte cell-cell adhesion | 77/2311 | 336/18723 | 4.08e-08 | 2.54e-06 | 77 |
| GO:003133110 | Cervix | CC | positive regulation of cellular catabolic process | 91/2311 | 427/18723 | 9.64e-08 | 5.25e-06 | 91 |
| GO:00027644 | Cervix | CC | immune response-regulating signaling pathway | 97/2311 | 468/18723 | 1.49e-07 | 7.07e-06 | 97 |
| GO:00002097 | Cervix | CC | protein polyubiquitination | 58/2311 | 236/18723 | 1.57e-07 | 7.41e-06 | 58 |
| GO:190370610 | Cervix | CC | regulation of hemopoiesis | 80/2311 | 367/18723 | 2.14e-07 | 9.55e-06 | 80 |
| GO:00064029 | Cervix | CC | mRNA catabolic process | 56/2311 | 232/18723 | 4.81e-07 | 1.83e-05 | 56 |
| GO:00420988 | Cervix | CC | T cell proliferation | 49/2311 | 199/18723 | 1.32e-06 | 4.49e-05 | 49 |
| GO:19001517 | Cervix | CC | regulation of nuclear-transcribed mRNA catabolic process, deadenylation-dependent decay | 11/2311 | 18/18723 | 1.37e-06 | 4.55e-05 | 11 |
| GO:19033119 | Cervix | CC | regulation of mRNA metabolic process | 64/2311 | 288/18723 | 1.71e-06 | 5.64e-05 | 64 |
| GO:00224084 | Cervix | CC | negative regulation of cell-cell adhesion | 48/2311 | 196/18723 | 1.99e-06 | 6.18e-05 | 48 |
| GO:004887210 | Cervix | CC | homeostasis of number of cells | 61/2311 | 272/18723 | 2.17e-06 | 6.55e-05 | 61 |
| GO:00064019 | Cervix | CC | RNA catabolic process | 62/2311 | 278/18723 | 2.18e-06 | 6.56e-05 | 62 |
| GO:00421297 | Cervix | CC | regulation of T cell proliferation | 43/2311 | 171/18723 | 3.21e-06 | 8.77e-05 | 43 |
| Hugo Symbol | Variant Class | Variant Classification | dbSNP RS | HGVSc | HGVSp | HGVSp Short | SWISSPROT | BIOTYPE | SIFT | PolyPhen | Tumor Sample Barcode | Tissue | Histology | Sex | Age | Stage | Therapy Types | Drugs | Outcome |
| RC3H1 | SNV | Missense_Mutation | | c.2156N>G | p.Tyr719Cys | p.Y719C | Q5TC82 | protein_coding | tolerated(0.14) | benign(0.005) | TCGA-A8-A06T-01 | Breast | breast invasive carcinoma | Female | >=65 | III/IV | Hormone Therapy | anastrozole | SD |
| RC3H1 | SNV | Missense_Mutation | | c.1324N>A | p.Glu442Lys | p.E442K | Q5TC82 | protein_coding | deleterious(0) | possibly_damaging(0.824) | TCGA-A8-A08B-01 | Breast | breast invasive carcinoma | Female | <65 | I/II | Chemotherapy | 5-fluorouracil | CR |
| RC3H1 | SNV | Missense_Mutation | | c.2083G>A | p.Glu695Lys | p.E695K | Q5TC82 | protein_coding | deleterious(0.01) | benign(0.021) | TCGA-AC-A23H-01 | Breast | breast invasive carcinoma | Female | >=65 | I/II | Unknown | Unknown | PD |
| RC3H1 | SNV | Missense_Mutation | | c.392G>A | p.Arg131His | p.R131H | Q5TC82 | protein_coding | deleterious(0) | probably_damaging(0.999) | TCGA-AN-A046-01 | Breast | breast invasive carcinoma | Female | >=65 | I/II | Unknown | Unknown | SD |
| RC3H1 | SNV | Missense_Mutation | novel | c.1426N>G | p.Ile476Val | p.I476V | Q5TC82 | protein_coding | tolerated(1) | benign(0.028) | TCGA-AO-A03O-01 | Breast | breast invasive carcinoma | Female | >=65 | I/II | Chemotherapy | doxorubicin | SD |
| RC3H1 | SNV | Missense_Mutation | | c.937N>G | p.His313Asp | p.H313D | Q5TC82 | protein_coding | deleterious(0) | probably_damaging(0.997) | TCGA-BH-A0HP-01 | Breast | breast invasive carcinoma | Female | >=65 | III/IV | Chemotherapy | doxorubicin | SD |
| RC3H1 | SNV | Missense_Mutation | | c.26N>A | p.Thr9Lys | p.T9K | Q5TC82 | protein_coding | deleterious(0) | probably_damaging(0.998) | TCGA-D8-A1XK-01 | Breast | breast invasive carcinoma | Female | <65 | I/II | Chemotherapy | doxorubicine+cyclophosphamide | SD |
| RC3H1 | SNV | Missense_Mutation | | c.2668T>C | p.Tyr890His | p.Y890H | Q5TC82 | protein_coding | deleterious(0) | possibly_damaging(0.897) | TCGA-D8-A1XQ-01 | Breast | breast invasive carcinoma | Female | >=65 | I/II | Unknown | Unknown | SD |
| RC3H1 | SNV | Missense_Mutation | | c.1825N>G | p.Gln609Glu | p.Q609E | Q5TC82 | protein_coding | tolerated(0.56) | benign(0.005) | TCGA-E2-A1LA-01 | Breast | breast invasive carcinoma | Female | <65 | I/II | Hormone Therapy | arimidex | SD |
| RC3H1 | SNV | Missense_Mutation | | c.835C>G | p.Leu279Val | p.L279V | Q5TC82 | protein_coding | deleterious(0) | probably_damaging(0.996) | TCGA-E9-A1NC-01 | Breast | breast invasive carcinoma | Female | <65 | I/II | Chemotherapy | doxorubicin | CR |


