
|
|||||
|
 | |
| |
| |
| |
| |
| |
|
Gene: RBSN |
Gene summary for RBSN |
| Gene information | Species | Human | Gene symbol | RBSN | Gene ID | 64145 |
| Gene name | rabenosyn, RAB effector | |
| Gene Alias | Rabenosyn-5 | |
| Cytomap | 3p25.1 | |
| Gene Type | protein-coding | GO ID | GO:0006810 | UniProtAcc | A0A024R2H4 |
Top |
Malignant transformation analysis |
| Identification of the aberrant gene expression in precancerous and cancerous lesions by comparing the gene expression of stem-like cells in diseased tissues with normal stem cells |
| Entrez ID | Symbol | Replicates | Species | Organ | Tissue | Adj P-value | Log2FC | Malignancy |
| 64145 | RBSN | HCC1_Meng | Human | Liver | HCC | 6.85e-31 | 2.87e-02 | 0.0246 |
| 64145 | RBSN | HCC1 | Human | Liver | HCC | 1.06e-15 | 3.38e+00 | 0.5336 |
| 64145 | RBSN | HCC2 | Human | Liver | HCC | 5.16e-21 | 3.01e+00 | 0.5341 |
| 64145 | RBSN | HCC5 | Human | Liver | HCC | 1.32e-12 | 2.33e+00 | 0.4932 |
| 64145 | RBSN | S014 | Human | Liver | HCC | 1.24e-04 | 3.38e-01 | 0.2254 |
| 64145 | RBSN | S016 | Human | Liver | HCC | 7.02e-05 | 2.88e-01 | 0.2243 |
| 64145 | RBSN | S027 | Human | Liver | HCC | 2.44e-04 | 4.98e-01 | 0.2446 |
| 64145 | RBSN | S028 | Human | Liver | HCC | 4.99e-09 | 4.40e-01 | 0.2503 |
| 64145 | RBSN | S029 | Human | Liver | HCC | 1.00e-05 | 4.36e-01 | 0.2581 |
| Page: 1 |
| Tissue | Expression Dynamics | Abbreviation |
| Liver | 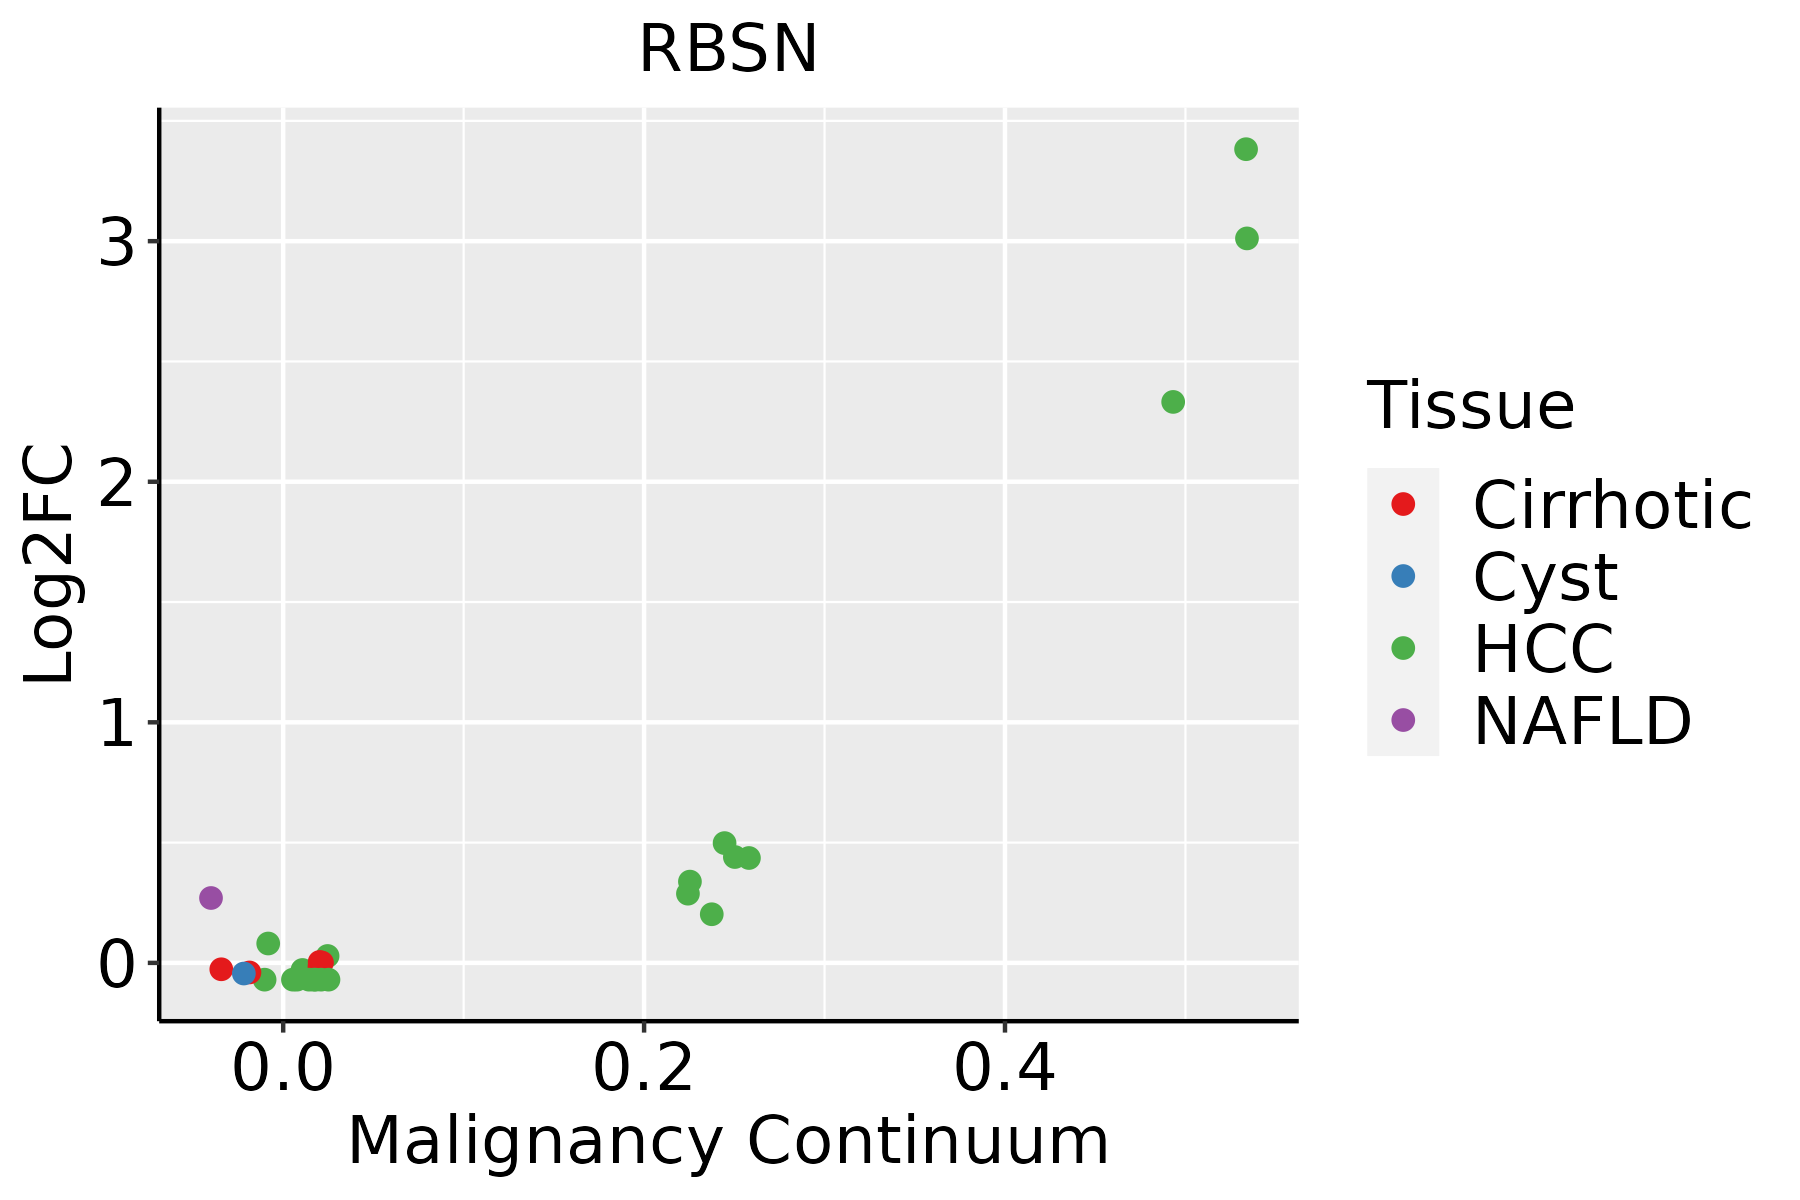 | HCC: Hepatocellular carcinoma |
| NAFLD: Non-alcoholic fatty liver disease |
| ∗log2FC in expression of this searched gene in stem-like cells from each diseased tissue sample relative to stem-like cells in normal samples in each tissue plotted against the malignancy continuum. Samples are colored based on if they are from different disease stage. |
Top |
Malignant transformation related pathway analysis |
| Find out the enriched GO biological processes and KEGG pathways involved in transition from healthy to precancer to cancer |
| Tissue | Disease Stage | Enriched GO biological Processes |
| Colorectum | AD |  |
| Colorectum | SER |  |
| Colorectum | MSS |  |
| Colorectum | MSI-H |  |
| Colorectum | FAP |  |
| ∗Top 15 enriched GO BP terms are showed in the bar plot of each disease state in each tissue. Each row represents a significant GO biological process which is colored according to the -log10(p.adjust). |
| Page: 1 2 3 4 5 6 7 8 9 |
| GO ID | Tissue | Disease Stage | Description | Gene Ratio | Bg Ratio | pvalue | p.adjust | Count |
| GO:004819321 | Liver | HCC | Golgi vesicle transport | 217/7958 | 296/18723 | 2.58e-27 | 1.02e-24 | 217 |
| GO:001619721 | Liver | HCC | endosomal transport | 154/7958 | 230/18723 | 4.74e-14 | 2.95e-12 | 154 |
| GO:001648221 | Liver | HCC | cytosolic transport | 117/7958 | 168/18723 | 8.83e-13 | 4.48e-11 | 117 |
| GO:000703421 | Liver | HCC | vacuolar transport | 108/7958 | 157/18723 | 2.22e-11 | 8.69e-10 | 108 |
| GO:000689221 | Liver | HCC | post-Golgi vesicle-mediated transport | 77/7958 | 104/18723 | 6.14e-11 | 2.24e-09 | 77 |
| GO:00070302 | Liver | HCC | Golgi organization | 99/7958 | 157/18723 | 1.54e-07 | 2.85e-06 | 99 |
| GO:000704121 | Liver | HCC | lysosomal transport | 76/7958 | 114/18723 | 1.56e-07 | 2.88e-06 | 76 |
| GO:004214721 | Liver | HCC | retrograde transport, endosome to Golgi | 61/7958 | 91/18723 | 1.94e-06 | 2.68e-05 | 61 |
| GO:0006896 | Liver | HCC | Golgi to vacuole transport | 15/7958 | 20/18723 | 3.31e-03 | 1.51e-02 | 15 |
| GO:19033582 | Liver | HCC | regulation of Golgi organization | 13/7958 | 17/18723 | 4.77e-03 | 2.02e-02 | 13 |
| GO:00901601 | Liver | HCC | Golgi to lysosome transport | 9/7958 | 11/18723 | 9.51e-03 | 3.60e-02 | 9 |
| Page: 1 |
| Pathway ID | Tissue | Disease Stage | Description | Gene Ratio | Bg Ratio | pvalue | p.adjust | qvalue | Count |
| hsa0414422 | Liver | HCC | Endocytosis | 178/4020 | 251/8465 | 2.03e-14 | 5.22e-13 | 2.91e-13 | 178 |
| hsa0414432 | Liver | HCC | Endocytosis | 178/4020 | 251/8465 | 2.03e-14 | 5.22e-13 | 2.91e-13 | 178 |
| Page: 1 |
Top |
Cell-cell communication analysis |
| Identification of potential cell-cell interactions between two cell types and their ligand-receptor pairs for different disease states |
| Ligand | Receptor | LRpair | Pathway | Tissue | Disease Stage |
| Page: 1 |
Top |
Single-cell gene regulatory network inference analysis |
| Find out the significant the regulons (TFs) and the target genes of each regulon across cell types for different disease states |
| TF | Cell Type | Tissue | Disease Stage | Target Gene | RSS | Regulon Activity |
| ∗The dot plots of a searched regulon are shown for all cell subpopulations in each disease state of each tissue based on the regulon specific score inferred using pySCENIC and by calculating the average expression. |
| Page: 1 |
Top |
Somatic mutation of malignant transformation related genes |
| Annotation of somatic variants for genes involved in malignant transformation |
| Hugo Symbol | Variant Class | Variant Classification | dbSNP RS | HGVSc | HGVSp | HGVSp Short | SWISSPROT | BIOTYPE | SIFT | PolyPhen | Tumor Sample Barcode | Tissue | Histology | Sex | Age | Stage | Therapy Types | Drugs | Outcome |
| RBSN | SNV | Missense_Mutation | c.1690N>C | p.Glu564Gln | p.E564Q | Q9H1K0 | protein_coding | tolerated_low_confidence(0.12) | benign(0.007) | TCGA-AC-A23H-01 | Breast | breast invasive carcinoma | Female | >=65 | I/II | Unknown | Unknown | PD | |
| RBSN | SNV | Missense_Mutation | novel | c.677N>A | p.Ser226Tyr | p.S226Y | Q9H1K0 | protein_coding | deleterious(0.03) | probably_damaging(0.967) | TCGA-AC-A3W7-01 | Breast | breast invasive carcinoma | Female | >=65 | I/II | Hormone Therapy | femara | SD |
| RBSN | SNV | Missense_Mutation | c.434N>C | p.Arg145Pro | p.R145P | Q9H1K0 | protein_coding | deleterious(0) | probably_damaging(0.941) | TCGA-D8-A1JA-01 | Breast | breast invasive carcinoma | Female | <65 | III/IV | Chemotherapy | adriamycin | PD | |
| RBSN | SNV | Missense_Mutation | c.112N>G | p.Ser38Ala | p.S38A | Q9H1K0 | protein_coding | tolerated(0.07) | benign(0.003) | TCGA-D8-A1XK-01 | Breast | breast invasive carcinoma | Female | <65 | I/II | Chemotherapy | doxorubicine+cyclophosphamide | SD | |
| RBSN | insertion | In_Frame_Ins | novel | c.1329_1330insTGTTTCATCCCTAGC | p.Trp443_Leu444insCysPheIleProSer | p.W443_L444insCFIPS | Q9H1K0 | protein_coding | TCGA-BH-A0AY-01 | Breast | breast invasive carcinoma | Female | <65 | I/II | Chemotherapy | SD | |||
| RBSN | insertion | Frame_Shift_Ins | novel | c.1327_1328insCTAATGTGGAATGG | p.Trp443SerfsTer138 | p.W443Sfs*138 | Q9H1K0 | protein_coding | TCGA-BH-A0AY-01 | Breast | breast invasive carcinoma | Female | <65 | I/II | Chemotherapy | SD | |||
| RBSN | insertion | Nonsense_Mutation | novel | c.114_115insACCTGGTGATACCAGTGGGTAGAGAGGTTAGAGAATGTTCCCG | p.Gly39ThrfsTer3 | p.G39Tfs*3 | Q9H1K0 | protein_coding | TCGA-BH-A0HF-01 | Breast | breast invasive carcinoma | Female | >=65 | I/II | Hormone Therapy | arimidex | SD | ||
| RBSN | SNV | Missense_Mutation | rs749630021 | c.1555C>T | p.Arg519Trp | p.R519W | Q9H1K0 | protein_coding | deleterious_low_confidence(0.02) | possibly_damaging(0.803) | TCGA-2W-A8YY-01 | Cervix | cervical & endocervical cancer | Female | <65 | I/II | Chemotherapy | cisplatin | CR |
| RBSN | SNV | Missense_Mutation | c.214N>A | p.Glu72Lys | p.E72K | Q9H1K0 | protein_coding | deleterious(0.03) | benign(0.272) | TCGA-DR-A0ZM-01 | Cervix | cervical & endocervical cancer | Female | <65 | III/IV | Unspecific | Cisplatin | SD | |
| RBSN | SNV | Missense_Mutation | c.1483G>A | p.Glu495Lys | p.E495K | Q9H1K0 | protein_coding | deleterious(0) | possibly_damaging(0.7) | TCGA-IR-A3LA-01 | Cervix | cervical & endocervical cancer | Female | <65 | I/II | Chemotherapy | cisplatin | CR |
| Page: 1 2 3 4 5 6 7 8 9 10 11 |
Top |
Related drugs of malignant transformation related genes |
| Identification of chemicals and drugs interact with genes involved in malignant transfromation |
| (DGIdb 4.0) |
| Entrez ID | Symbol | Category | Interaction Types | Drug Claim Name | Drug Name | PMIDs |
| Page: 1 |

Copyright 2023-Present -The University of Texas Health Science Center at Houston |