| Tissue | Expression Dynamics | Abbreviation |
| Cervix | 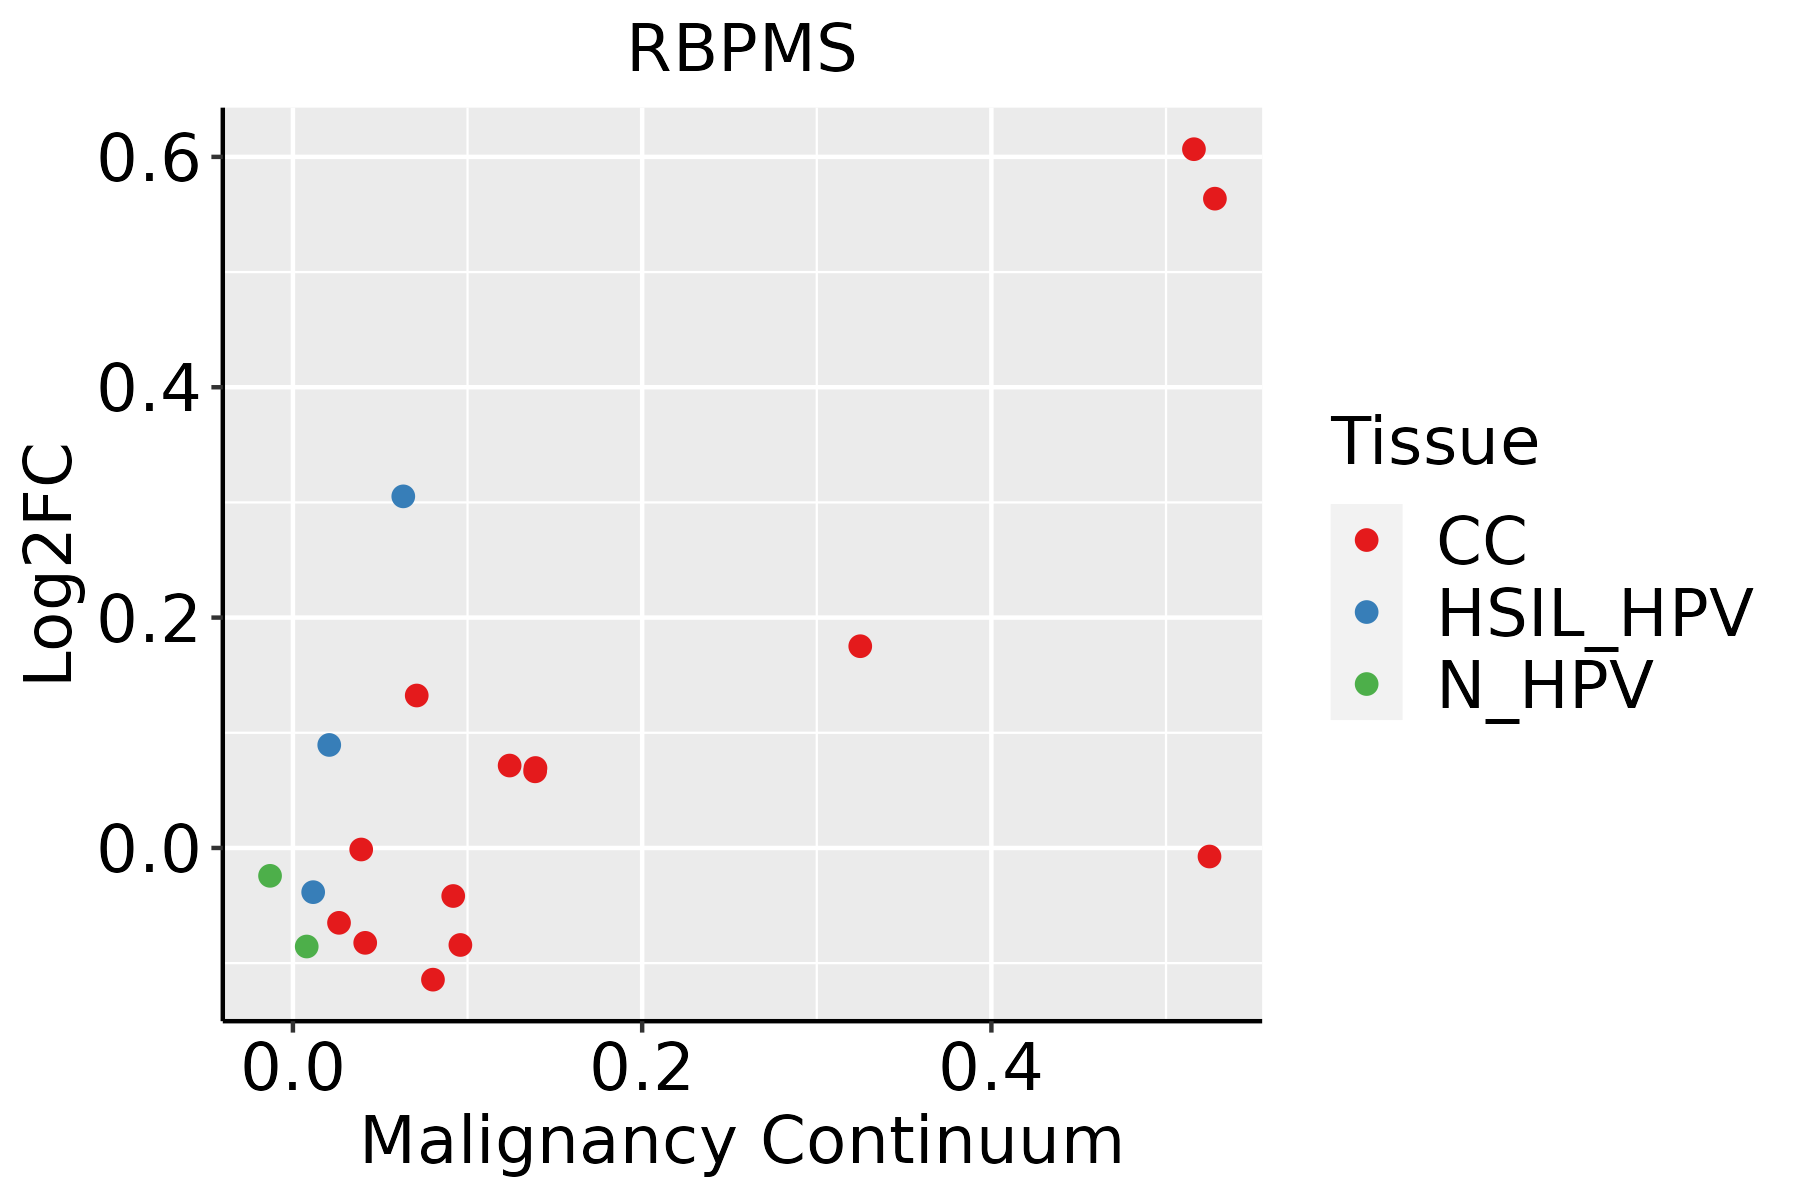 | CC: Cervix cancer |
| HSIL_HPV: HPV-infected high-grade squamous intraepithelial lesions |
| N_HPV: HPV-infected normal cervix |
| Colorectum (GSE201348) |  | FAP: Familial adenomatous polyposis |
| CRC: Colorectal cancer |
| Colorectum (HTA11) |  | AD: Adenomas |
| SER: Sessile serrated lesions |
| MSI-H: Microsatellite-high colorectal cancer |
| MSS: Microsatellite stable colorectal cancer |
| Endometrium | 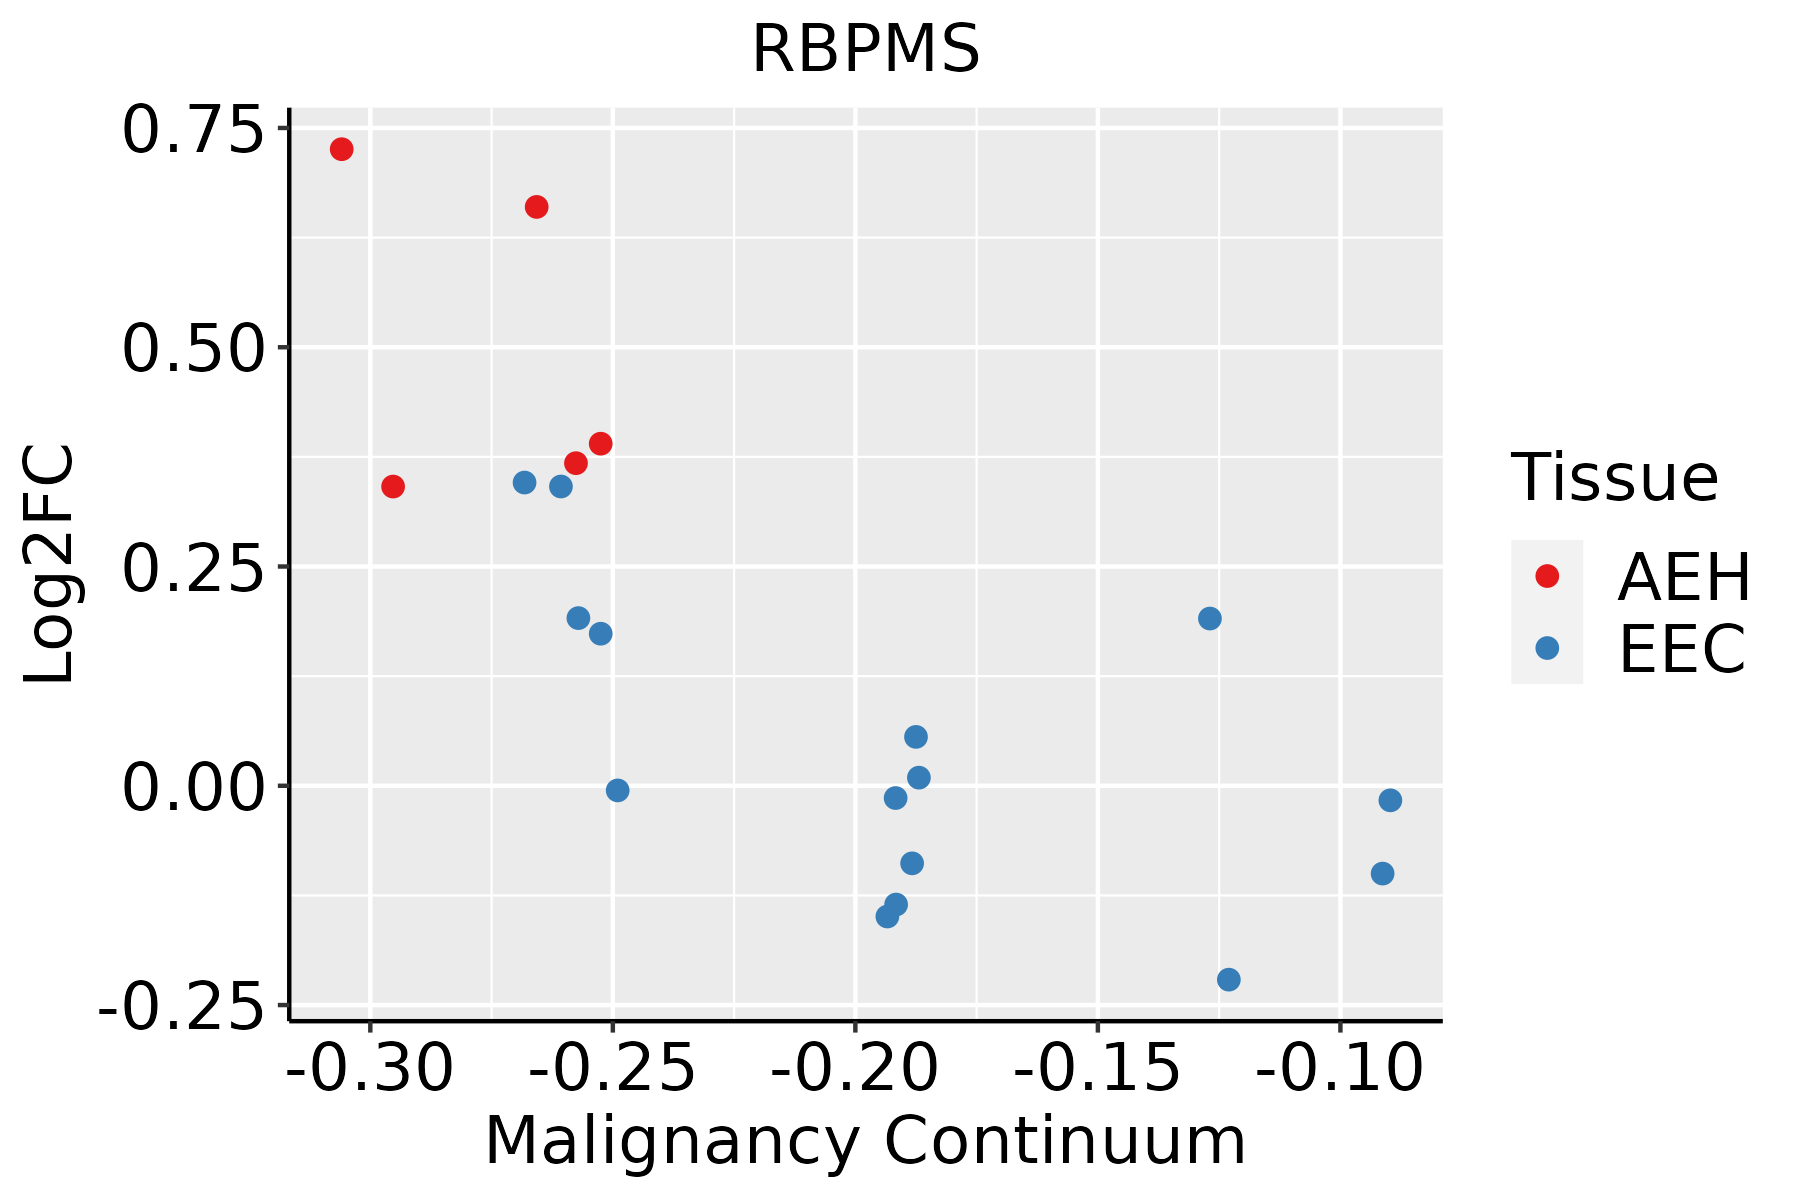 | AEH: Atypical endometrial hyperplasia |
| EEC: Endometrioid Cancer |
| Esophagus | 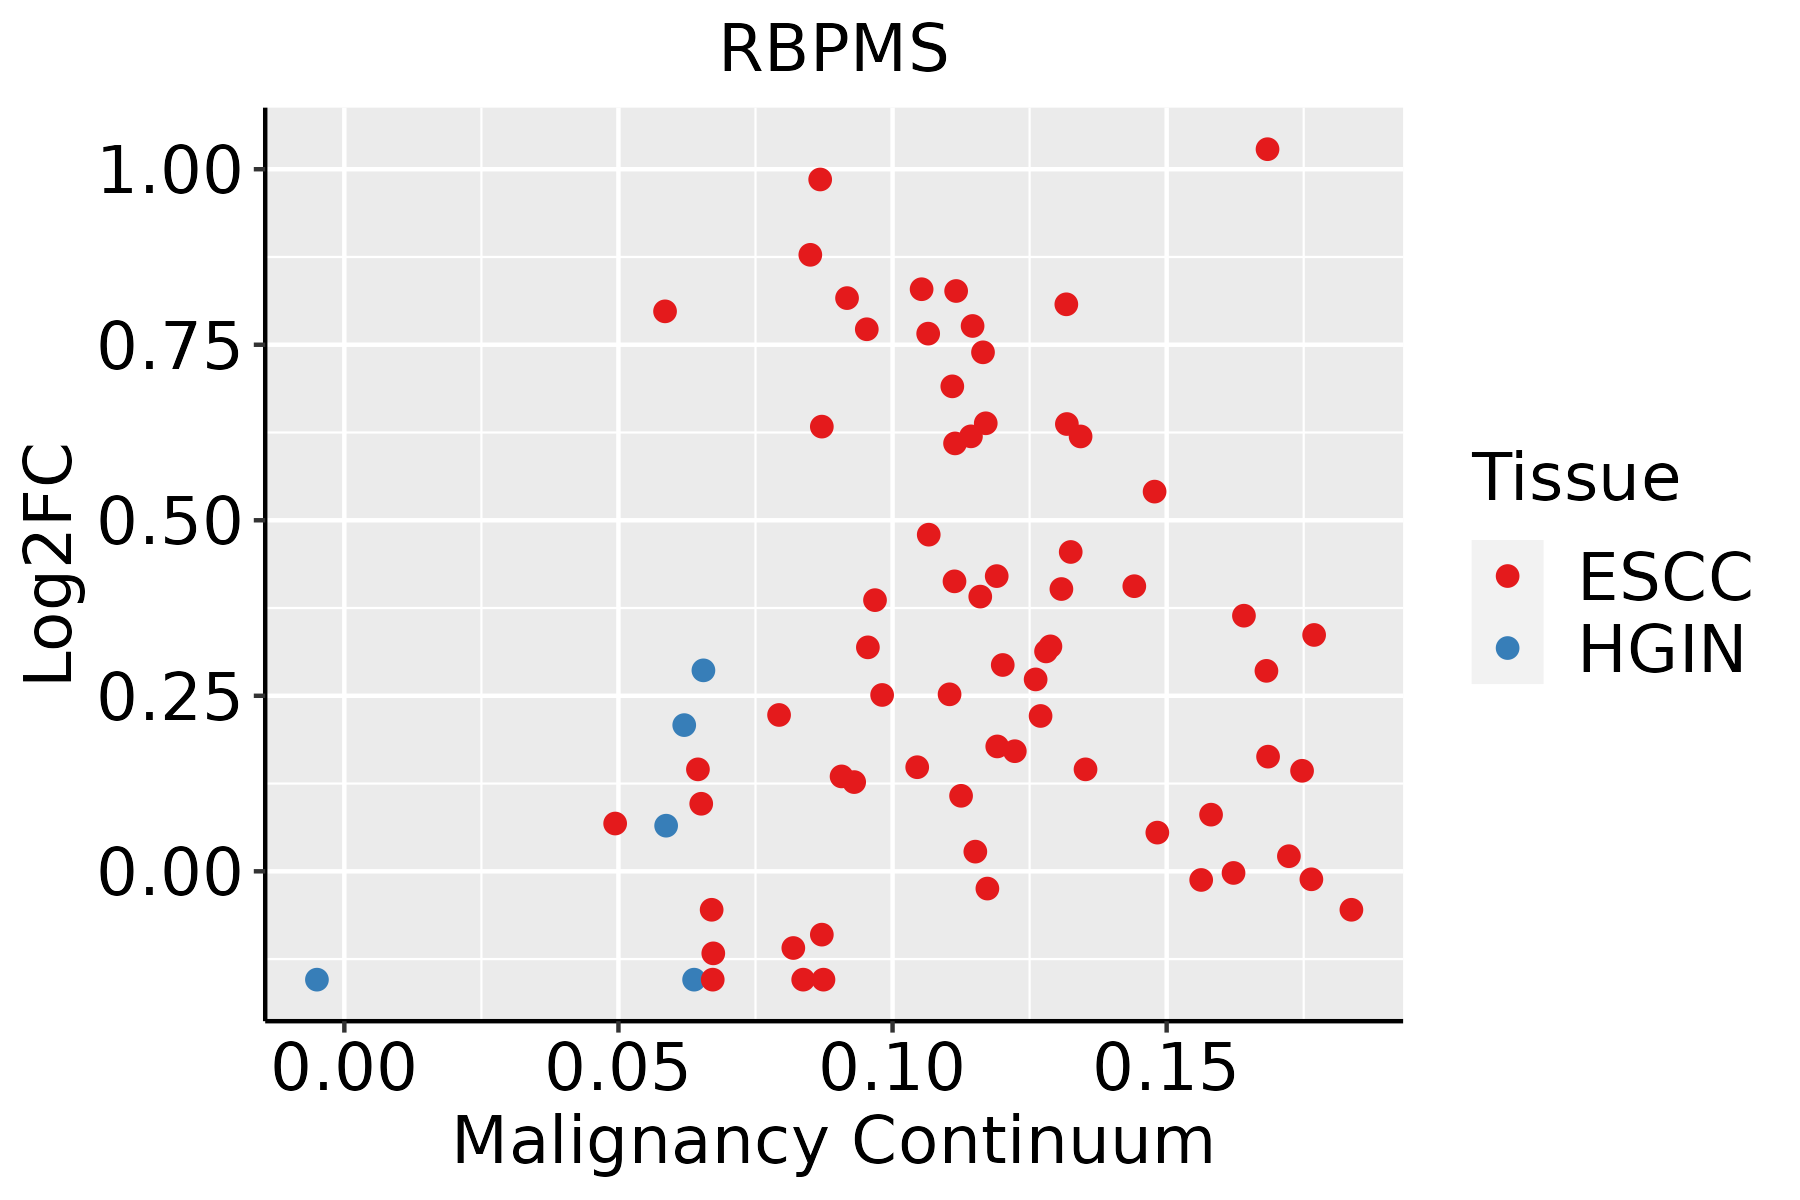 | ESCC: Esophageal squamous cell carcinoma |
| HGIN: High-grade intraepithelial neoplasias |
| LGIN: Low-grade intraepithelial neoplasias |
| Liver | 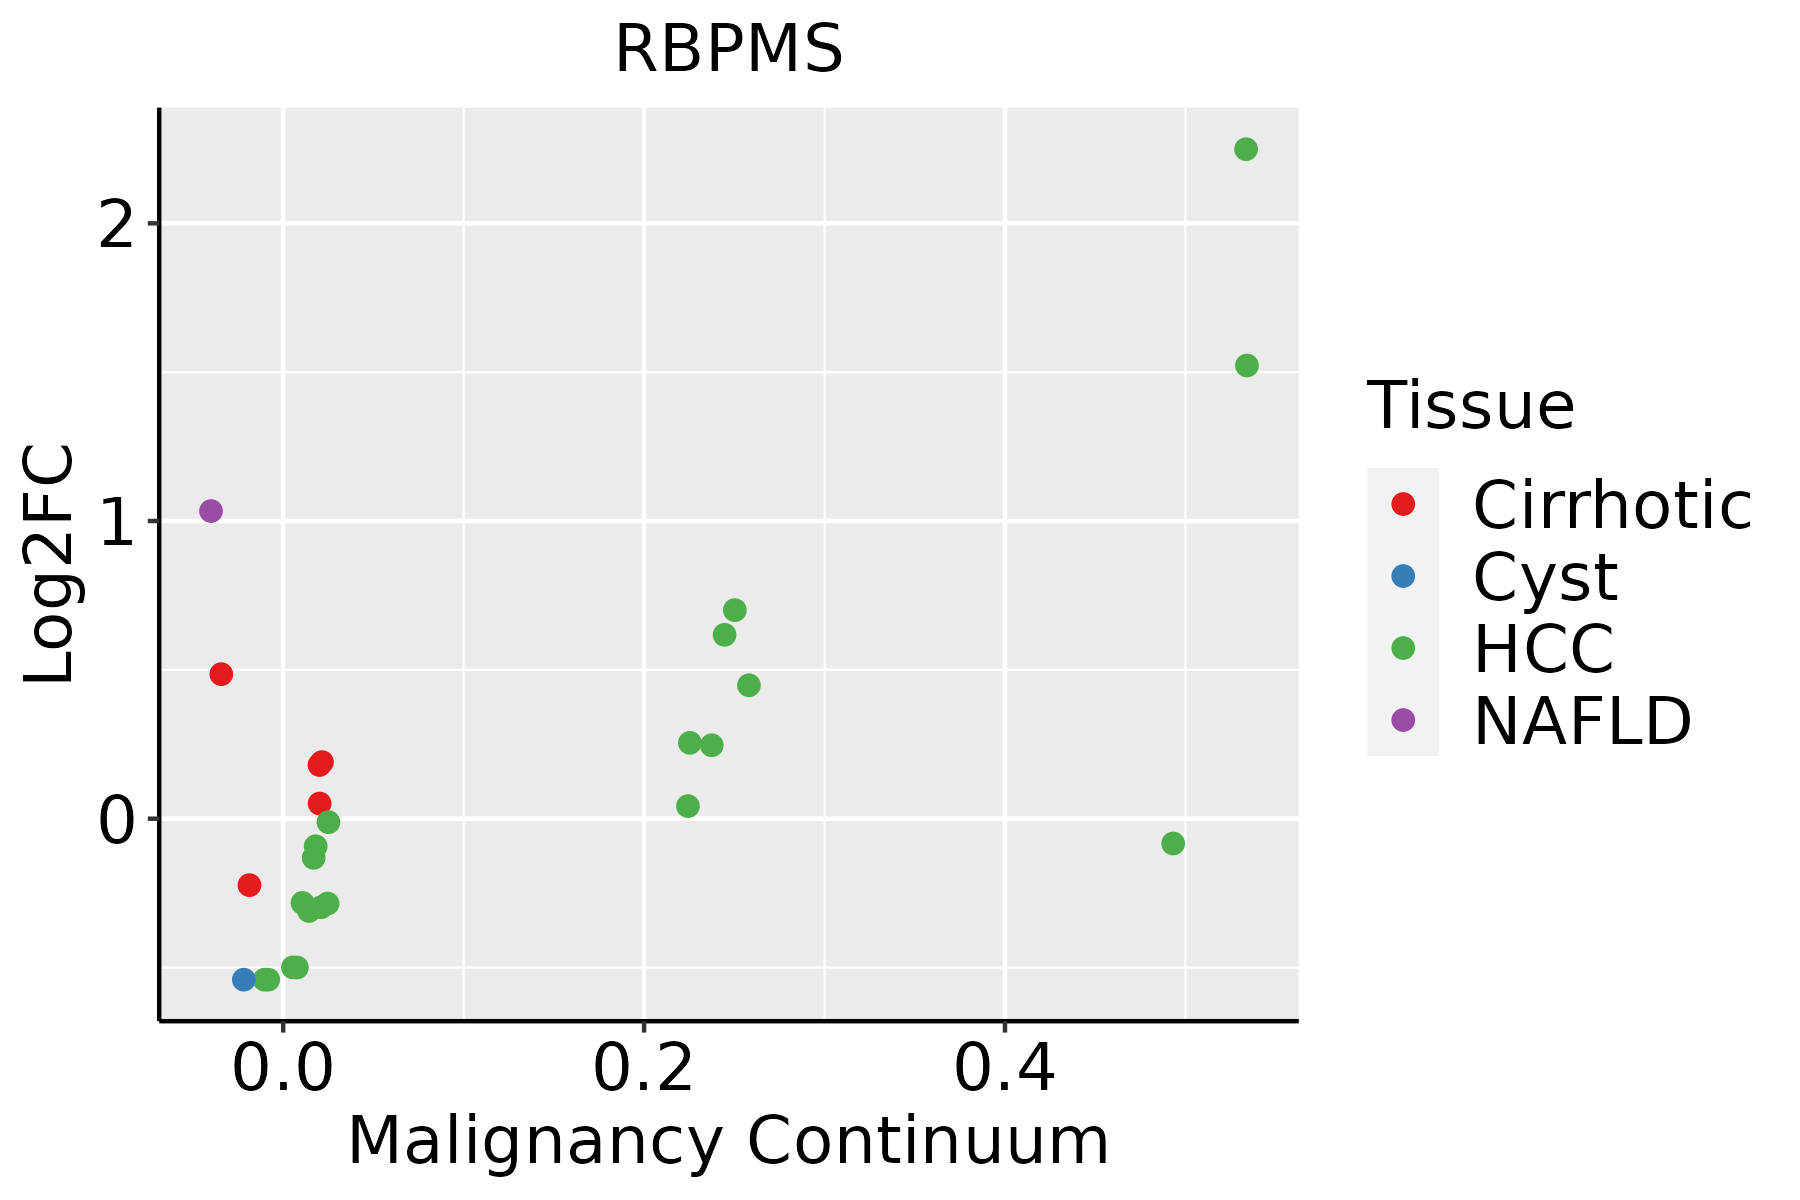 | HCC: Hepatocellular carcinoma |
| NAFLD: Non-alcoholic fatty liver disease |
| Lung |  | AAH: Atypical adenomatous hyperplasia |
| AIS: Adenocarcinoma in situ |
| IAC: Invasive lung adenocarcinoma |
| MIA: Minimally invasive adenocarcinoma |
| Oral Cavity | 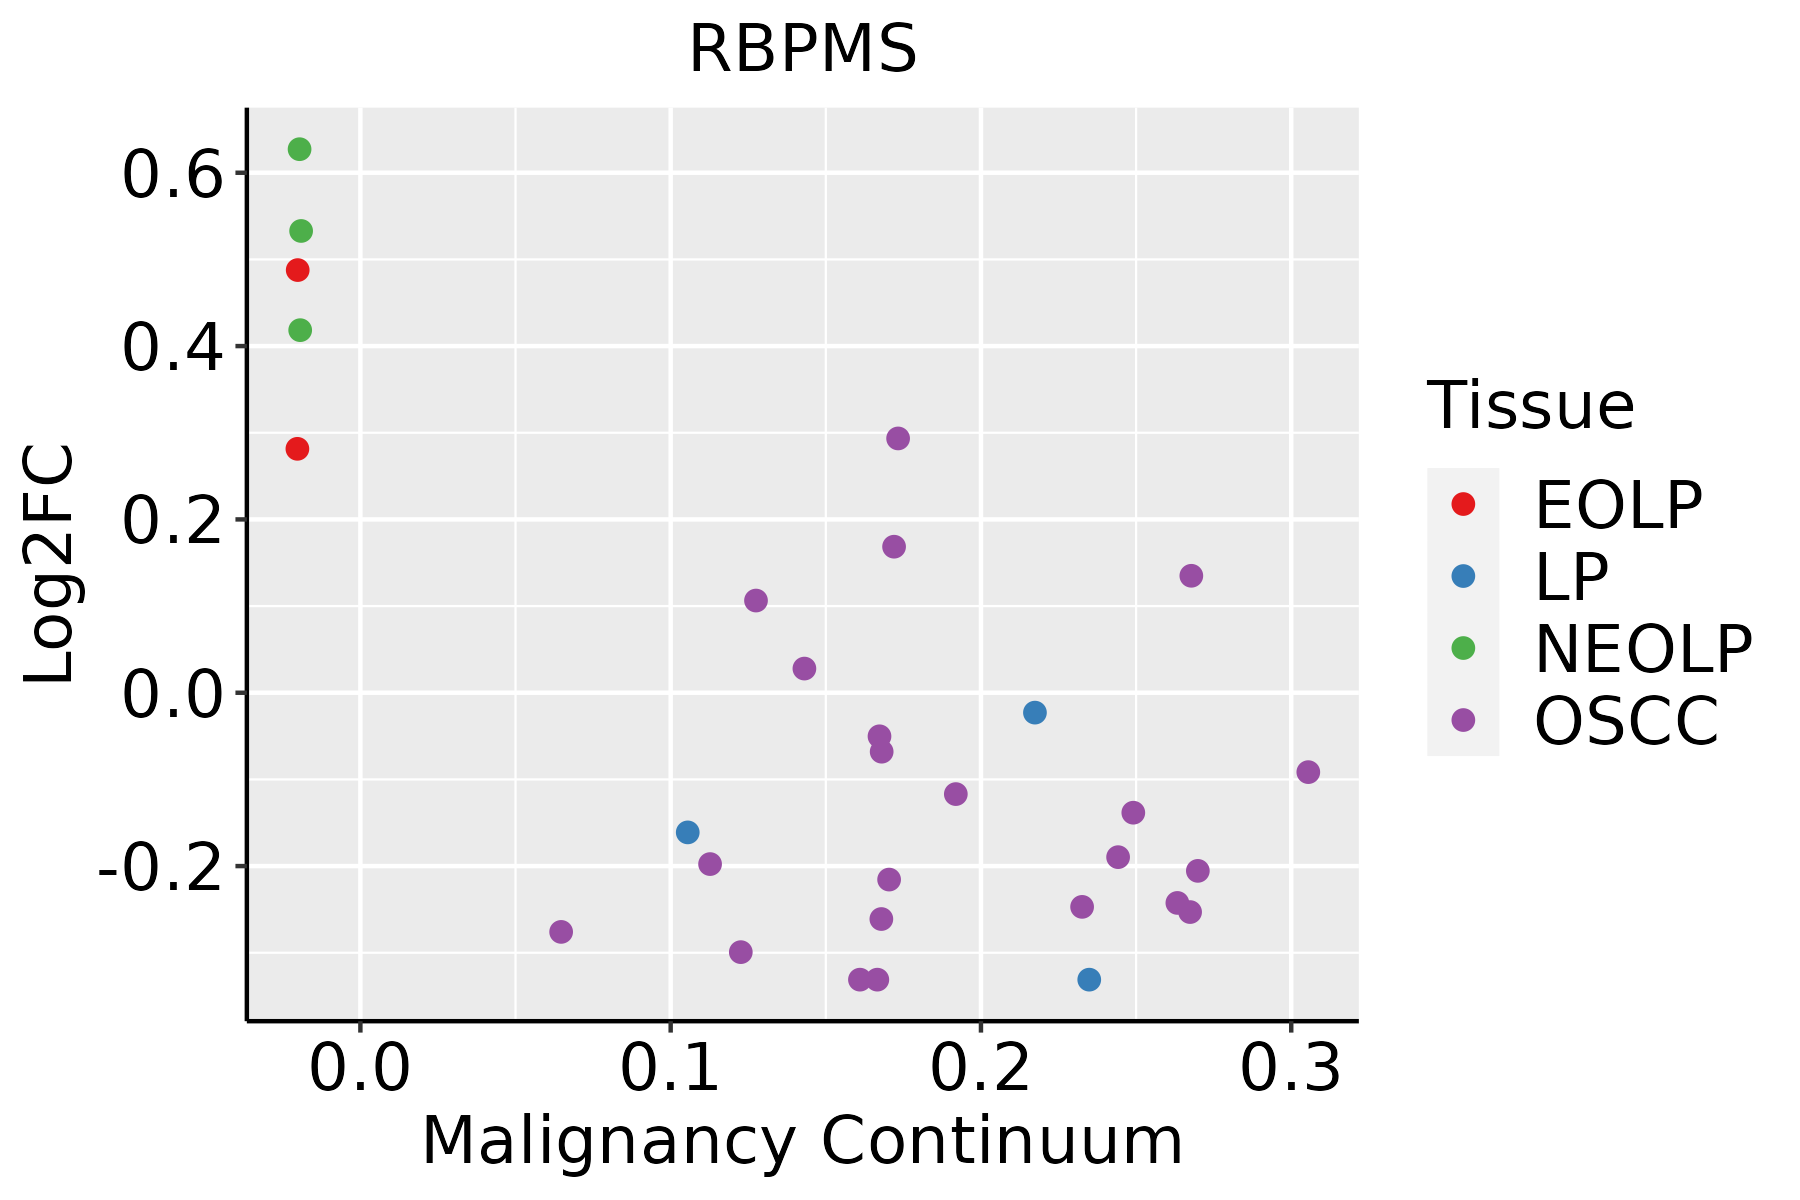 | EOLP: Erosive Oral lichen planus |
| LP: leukoplakia |
| NEOLP: Non-erosive oral lichen planus |
| OSCC: Oral squamous cell carcinoma |
| Prostate | 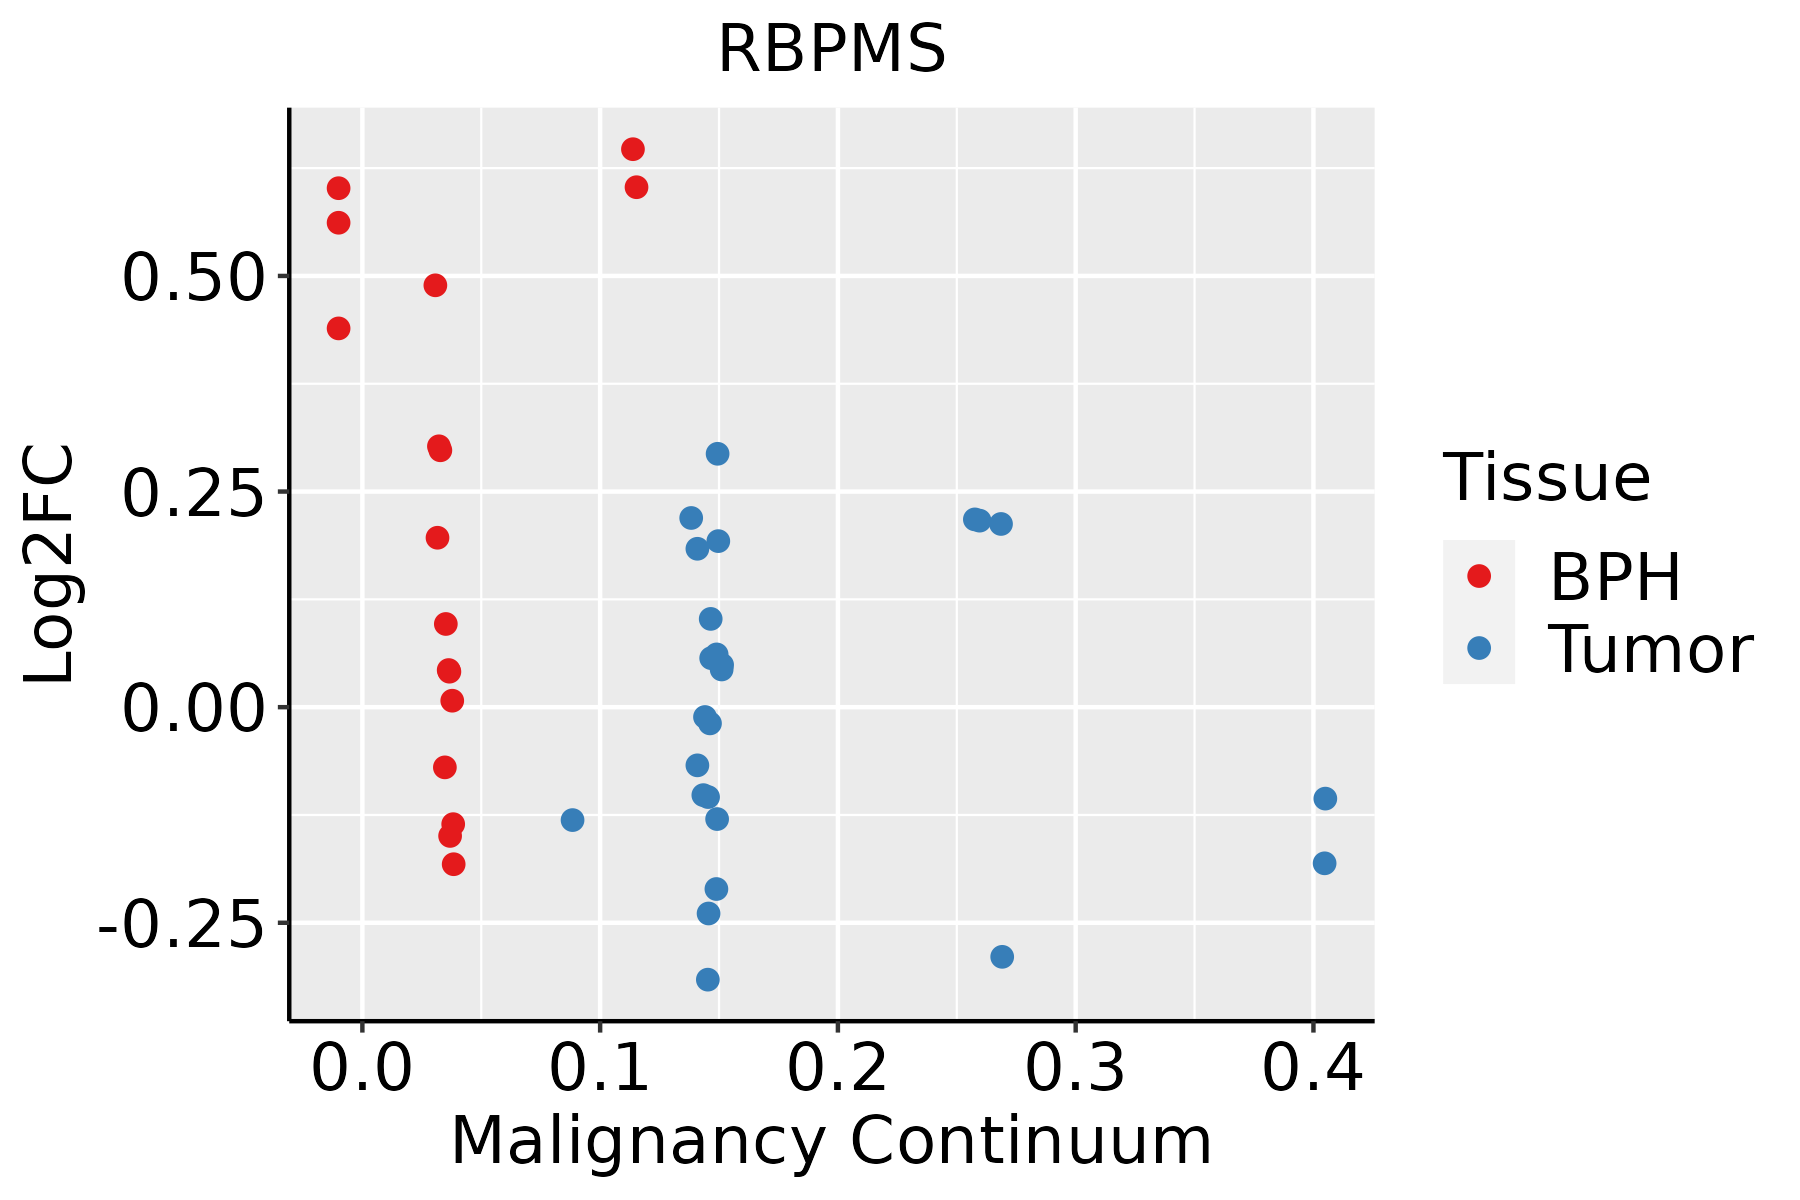 | BPH: Benign Prostatic Hyperplasia |
| Thyroid | 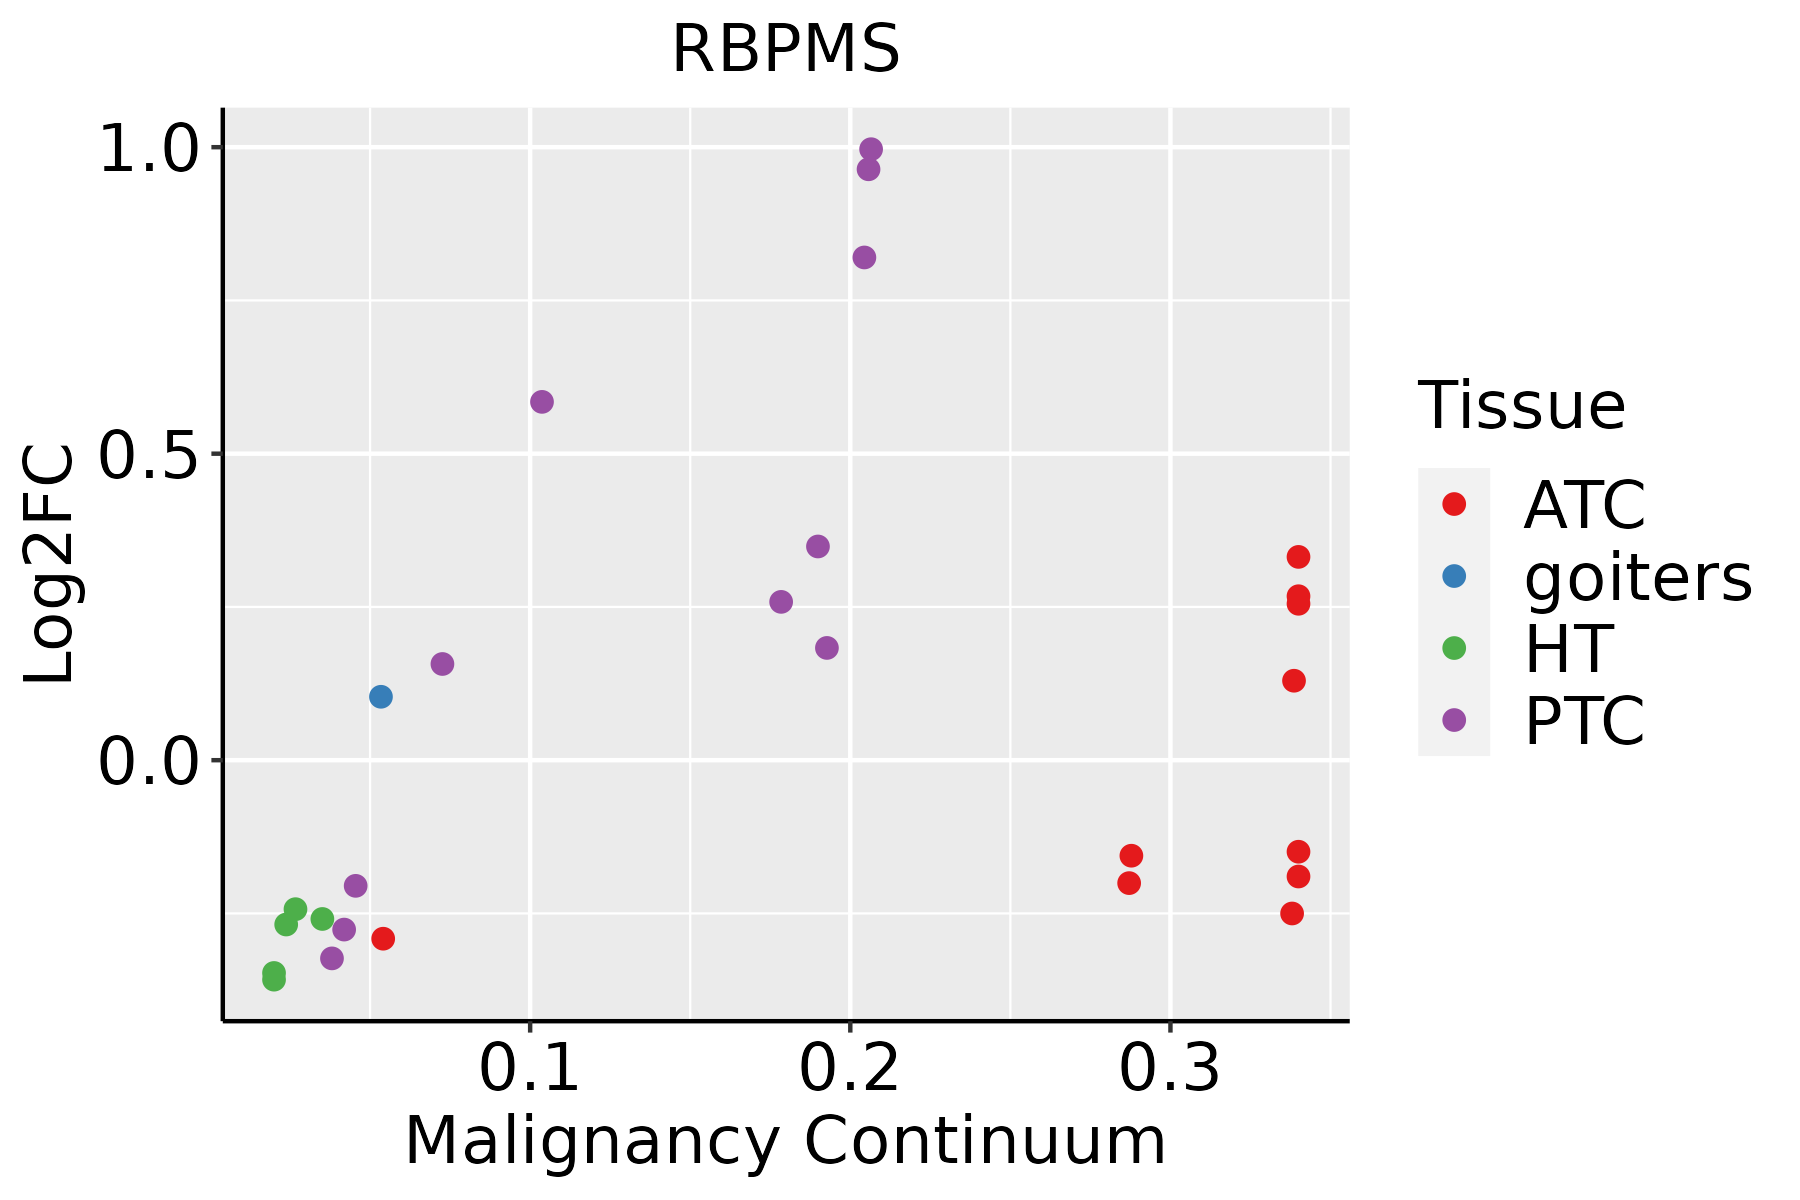 | ATC: Anaplastic thyroid cancer |
| HT: Hashimoto's thyroiditis |
| PTC: Papillary thyroid cancer |
| GO ID | Tissue | Disease Stage | Description | Gene Ratio | Bg Ratio | pvalue | p.adjust | Count |
| GO:000697910 | Cervix | CC | response to oxidative stress | 102/2311 | 446/18723 | 2.99e-10 | 4.36e-08 | 102 |
| GO:00071786 | Cervix | CC | transmembrane receptor protein serine/threonine kinase signaling pathway | 67/2311 | 355/18723 | 2.39e-04 | 2.67e-03 | 67 |
| GO:000697915 | Cervix | HSIL_HPV | response to oxidative stress | 48/737 | 446/18723 | 2.76e-10 | 7.02e-08 | 48 |
| GO:000717813 | Cervix | HSIL_HPV | transmembrane receptor protein serine/threonine kinase signaling pathway | 26/737 | 355/18723 | 1.86e-03 | 1.97e-02 | 26 |
| GO:0006979 | Colorectum | AD | response to oxidative stress | 145/3918 | 446/18723 | 5.16e-09 | 3.23e-07 | 145 |
| GO:0007178 | Colorectum | AD | transmembrane receptor protein serine/threonine kinase signaling pathway | 99/3918 | 355/18723 | 9.92e-04 | 9.28e-03 | 99 |
| GO:0060390 | Colorectum | AD | regulation of SMAD protein signal transduction | 14/3918 | 31/18723 | 2.10e-03 | 1.67e-02 | 14 |
| GO:0060395 | Colorectum | AD | SMAD protein signal transduction | 28/3918 | 82/18723 | 3.73e-03 | 2.63e-02 | 28 |
| GO:00069792 | Colorectum | MSS | response to oxidative stress | 128/3467 | 446/18723 | 7.65e-08 | 3.81e-06 | 128 |
| GO:00603901 | Colorectum | MSS | regulation of SMAD protein signal transduction | 14/3467 | 31/18723 | 5.98e-04 | 6.60e-03 | 14 |
| GO:00071781 | Colorectum | MSS | transmembrane receptor protein serine/threonine kinase signaling pathway | 86/3467 | 355/18723 | 4.04e-03 | 2.95e-02 | 86 |
| GO:00069793 | Colorectum | MSI-H | response to oxidative stress | 68/1319 | 446/18723 | 1.17e-09 | 1.59e-07 | 68 |
| GO:00069794 | Colorectum | FAP | response to oxidative stress | 102/2622 | 446/18723 | 2.29e-07 | 1.33e-05 | 102 |
| GO:00071782 | Colorectum | FAP | transmembrane receptor protein serine/threonine kinase signaling pathway | 81/2622 | 355/18723 | 4.28e-06 | 1.46e-04 | 81 |
| GO:00603951 | Colorectum | FAP | SMAD protein signal transduction | 24/2622 | 82/18723 | 2.55e-04 | 3.51e-03 | 24 |
| GO:00603902 | Colorectum | FAP | regulation of SMAD protein signal transduction | 12/2622 | 31/18723 | 5.86e-04 | 6.51e-03 | 12 |
| GO:0060389 | Colorectum | FAP | pathway-restricted SMAD protein phosphorylation | 18/2622 | 65/18723 | 2.85e-03 | 2.19e-02 | 18 |
| GO:0090092 | Colorectum | FAP | regulation of transmembrane receptor protein serine/threonine kinase signaling pathway | 52/2622 | 256/18723 | 3.33e-03 | 2.44e-02 | 52 |
| GO:0060391 | Colorectum | FAP | positive regulation of SMAD protein signal transduction | 7/2622 | 18/18723 | 8.10e-03 | 4.77e-02 | 7 |
| GO:00071783 | Colorectum | CRC | transmembrane receptor protein serine/threonine kinase signaling pathway | 66/2078 | 355/18723 | 1.74e-05 | 5.28e-04 | 66 |
| Hugo Symbol | Variant Class | Variant Classification | dbSNP RS | HGVSc | HGVSp | HGVSp Short | SWISSPROT | BIOTYPE | SIFT | PolyPhen | Tumor Sample Barcode | Tissue | Histology | Sex | Age | Stage | Therapy Types | Drugs | Outcome |
| RBPMS | SNV | Missense_Mutation | novel | c.57N>T | p.Gln19His | p.Q19H | Q93062 | protein_coding | tolerated(0.19) | benign(0) | TCGA-2W-A8YY-01 | Cervix | cervical & endocervical cancer | Female | <65 | I/II | Chemotherapy | cisplatin | CR |
| RBPMS | SNV | Missense_Mutation | novel | c.43N>A | p.Glu15Lys | p.E15K | Q93062 | protein_coding | tolerated(0.51) | benign(0.037) | TCGA-MA-AA41-01 | Cervix | cervical & endocervical cancer | Female | <65 | I/II | Unknown | Unknown | SD |
| RBPMS | SNV | Missense_Mutation | novel | c.50A>C | p.Asn17Thr | p.N17T | Q93062 | protein_coding | tolerated(0.32) | benign(0.005) | TCGA-MU-A8JM-01 | Cervix | cervical & endocervical cancer | Female | <65 | I/II | Unknown | Unknown | SD |
| RBPMS | SNV | Missense_Mutation | novel | c.110N>A | p.Pro37His | p.P37H | Q93062 | protein_coding | deleterious(0) | possibly_damaging(0.544) | TCGA-VS-A8EL-01 | Cervix | cervical & endocervical cancer | Female | <65 | I/II | Chemotherapy | cisplatin | CR |
| RBPMS | SNV | Missense_Mutation | | c.381N>A | p.Phe127Leu | p.F127L | Q93062 | protein_coding | tolerated(0.36) | benign(0.042) | TCGA-AA-3510-01 | Colorectum | colon adenocarcinoma | Male | >=65 | I/II | Unknown | Unknown | SD |
| RBPMS | SNV | Missense_Mutation | | c.532C>T | p.Arg178Cys | p.R178C | Q93062 | protein_coding | deleterious_low_confidence(0.01) | probably_damaging(0.973) | TCGA-D5-6930-01 | Colorectum | colon adenocarcinoma | Male | >=65 | I/II | Unknown | Unknown | SD |
| RBPMS | SNV | Missense_Mutation | novel | c.511G>A | p.Ala171Thr | p.A171T | Q93062 | protein_coding | deleterious(0.02) | benign(0.196) | TCGA-AG-A00Y-01 | Colorectum | rectum adenocarcinoma | Male | >=65 | I/II | Unknown | Unknown | PD |
| RBPMS | SNV | Missense_Mutation | | c.432N>A | p.Ser144Arg | p.S144R | Q93062 | protein_coding | tolerated(0.05) | possibly_damaging(0.881) | TCGA-A5-A0G9-01 | Endometrium | uterine corpus endometrioid carcinoma | Female | >=65 | I/II | Unknown | Unknown | SD |
| RBPMS | SNV | Missense_Mutation | | c.532N>T | p.Arg178Cys | p.R178C | Q93062 | protein_coding | deleterious_low_confidence(0.01) | probably_damaging(0.973) | TCGA-AJ-A3NE-01 | Endometrium | uterine corpus endometrioid carcinoma | Female | <65 | I/II | Unknown | Unknown | SD |
| RBPMS | SNV | Missense_Mutation | | c.71G>A | p.Arg24Gln | p.R24Q | Q93062 | protein_coding | deleterious(0) | probably_damaging(0.999) | TCGA-AJ-A8CW-01 | Endometrium | uterine corpus endometrioid carcinoma | Female | <65 | I/II | Unknown | Unknown | SD |


