
|
|||||
|
 | |
| |
| |
| |
| |
| |
|
Gene: RBP4 |
Gene summary for RBP4 |
| Gene information | Species | Human | Gene symbol | RBP4 | Gene ID | 5950 |
| Gene name | retinol binding protein 4 | |
| Gene Alias | MCOPCB10 | |
| Cytomap | 10q23.33 | |
| Gene Type | protein-coding | GO ID | GO:0000003 | UniProtAcc | P02753 |
Top |
Malignant transformation analysis |
| Identification of the aberrant gene expression in precancerous and cancerous lesions by comparing the gene expression of stem-like cells in diseased tissues with normal stem cells |
| Entrez ID | Symbol | Replicates | Species | Organ | Tissue | Adj P-value | Log2FC | Malignancy |
| 5950 | RBP4 | P31T-E | Human | Esophagus | ESCC | 2.85e-73 | 2.47e+00 | 0.1251 |
| 5950 | RBP4 | P49T-E | Human | Esophagus | ESCC | 7.48e-03 | 1.29e+00 | 0.1768 |
| 5950 | RBP4 | P75T-E | Human | Esophagus | ESCC | 1.66e-02 | 1.26e-01 | 0.1125 |
| 5950 | RBP4 | P76T-E | Human | Esophagus | ESCC | 2.06e-08 | 3.48e-01 | 0.1207 |
| 5950 | RBP4 | P79T-E | Human | Esophagus | ESCC | 3.97e-04 | 1.65e-01 | 0.1154 |
| 5950 | RBP4 | P82T-E | Human | Esophagus | ESCC | 9.44e-05 | 6.17e-01 | 0.1072 |
| 5950 | RBP4 | P130T-E | Human | Esophagus | ESCC | 2.02e-06 | 5.20e-01 | 0.1676 |
| 5950 | RBP4 | NAFLD1 | Human | Liver | NAFLD | 2.72e-04 | -3.48e-01 | -0.04 |
| 5950 | RBP4 | S42 | Human | Liver | HCC | 1.67e-15 | 9.54e-01 | -0.0103 |
| 5950 | RBP4 | S43 | Human | Liver | Cirrhotic | 8.62e-26 | 4.30e-01 | -0.0187 |
| 5950 | RBP4 | S44 | Human | Liver | HCC | 2.39e-07 | 7.29e-01 | -0.0083 |
| 5950 | RBP4 | HCC1_Meng | Human | Liver | HCC | 4.16e-15 | 4.06e-01 | 0.0246 |
| 5950 | RBP4 | HCC2_Meng | Human | Liver | HCC | 1.55e-69 | -1.26e+00 | 0.0107 |
| 5950 | RBP4 | cirrhotic1 | Human | Liver | Cirrhotic | 5.91e-03 | 2.30e-01 | 0.0202 |
| 5950 | RBP4 | cirrhotic2 | Human | Liver | Cirrhotic | 9.50e-03 | 2.28e-01 | 0.0201 |
| 5950 | RBP4 | cirrhotic3 | Human | Liver | Cirrhotic | 3.29e-04 | -5.07e-01 | 0.0215 |
| 5950 | RBP4 | p6 | Human | Liver | Cyst | 1.60e-12 | -1.26e+00 | -0.0218 |
| 5950 | RBP4 | HCC1 | Human | Liver | HCC | 6.00e-34 | 7.74e+00 | 0.5336 |
| 5950 | RBP4 | HCC2 | Human | Liver | HCC | 2.28e-31 | 6.67e+00 | 0.5341 |
| 5950 | RBP4 | HCC5 | Human | Liver | HCC | 5.90e-03 | 4.18e+00 | 0.4932 |
| Page: 1 2 |
| Tissue | Expression Dynamics | Abbreviation |
| Esophagus |  | ESCC: Esophageal squamous cell carcinoma |
| HGIN: High-grade intraepithelial neoplasias | ||
| LGIN: Low-grade intraepithelial neoplasias | ||
| Liver | 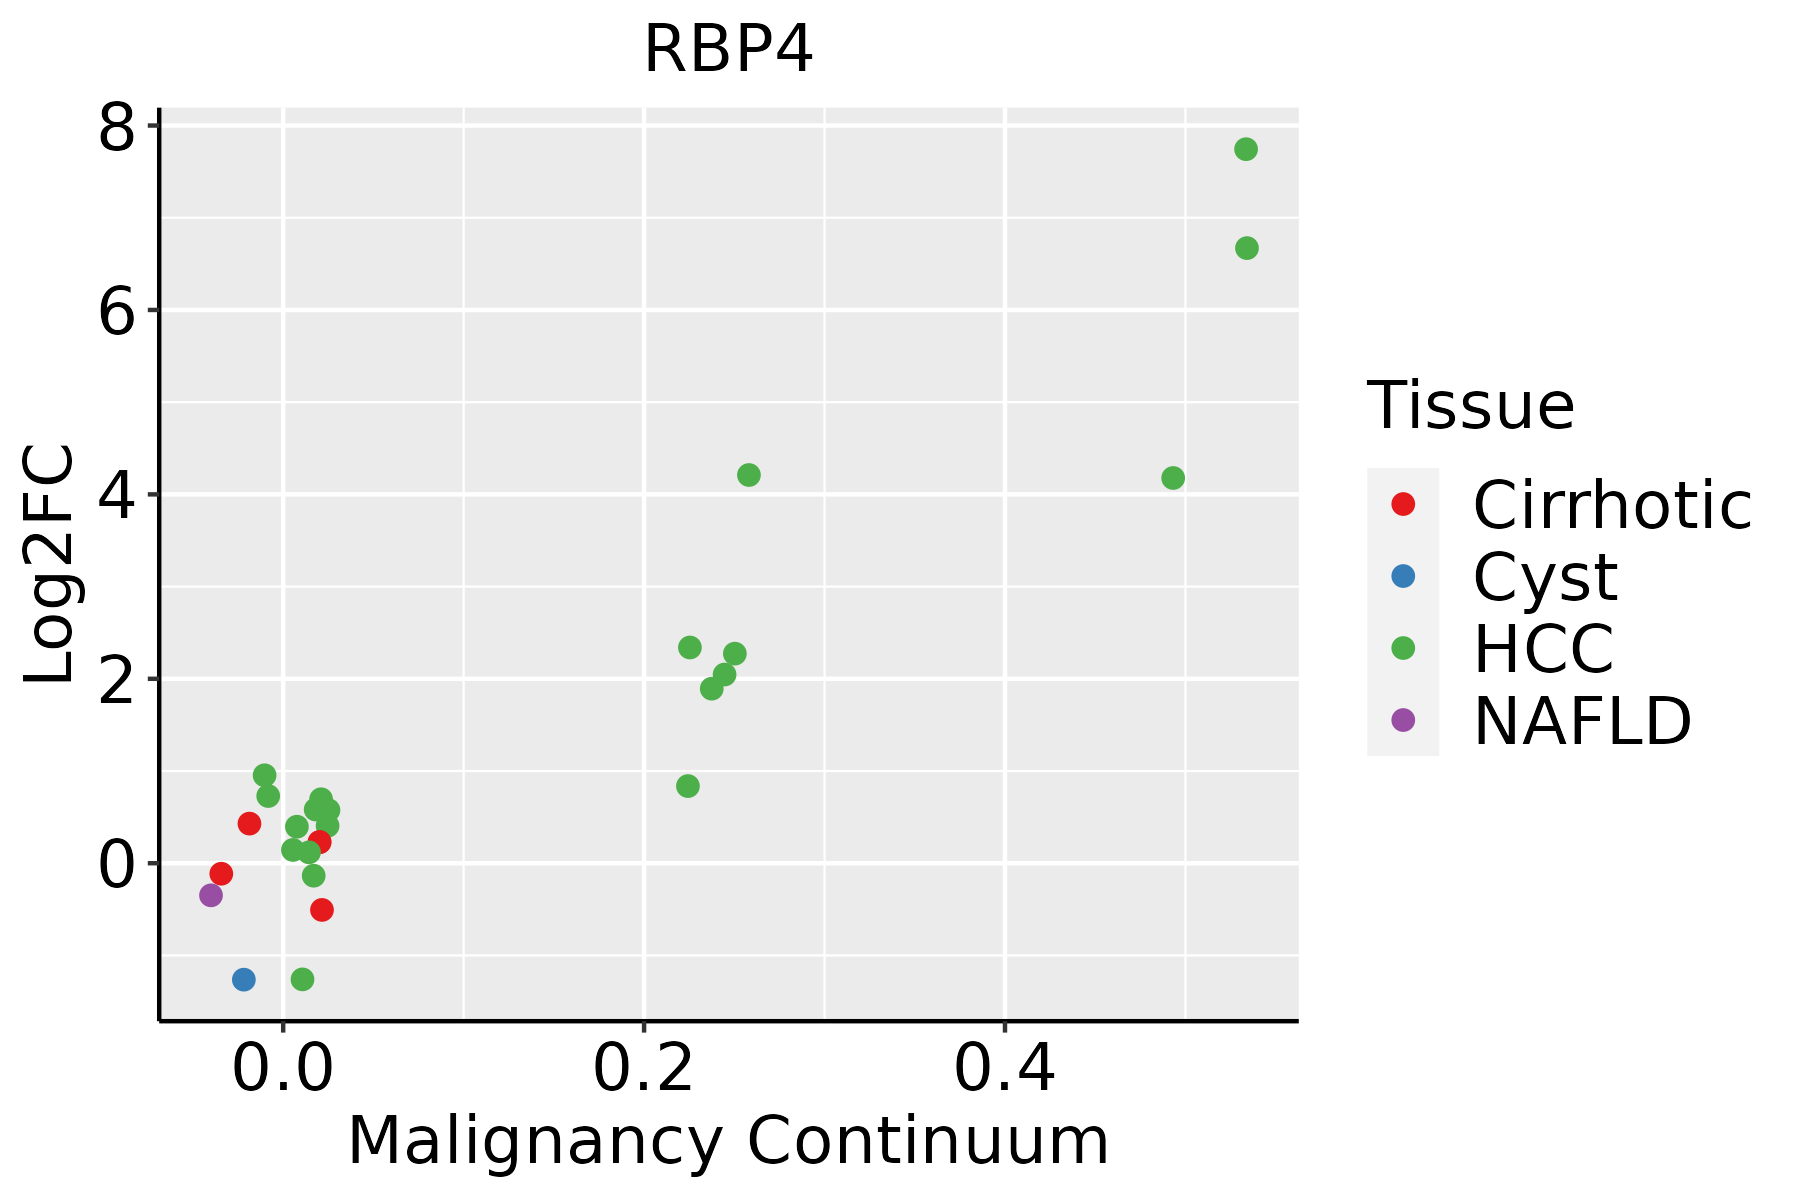 | HCC: Hepatocellular carcinoma |
| NAFLD: Non-alcoholic fatty liver disease |
| ∗log2FC in expression of this searched gene in stem-like cells from each diseased tissue sample relative to stem-like cells in normal samples in each tissue plotted against the malignancy continuum. Samples are colored based on if they are from different disease stage. |
Top |
Malignant transformation related pathway analysis |
| Find out the enriched GO biological processes and KEGG pathways involved in transition from healthy to precancer to cancer |
| Tissue | Disease Stage | Enriched GO biological Processes |
| Colorectum | AD |  |
| Colorectum | SER |  |
| Colorectum | MSS |  |
| Colorectum | MSI-H |  |
| Colorectum | FAP |  |
| ∗Top 15 enriched GO BP terms are showed in the bar plot of each disease state in each tissue. Each row represents a significant GO biological process which is colored according to the -log10(p.adjust). |
| Page: 1 2 3 4 5 6 7 8 9 |
| GO ID | Tissue | Disease Stage | Description | Gene Ratio | Bg Ratio | pvalue | p.adjust | Count |
| GO:1904951111 | Esophagus | ESCC | positive regulation of establishment of protein localization | 216/8552 | 319/18723 | 1.01e-15 | 6.86e-14 | 216 |
| GO:0051222111 | Esophagus | ESCC | positive regulation of protein transport | 204/8552 | 303/18723 | 1.56e-14 | 8.38e-13 | 204 |
| GO:00059969 | Esophagus | ESCC | monosaccharide metabolic process | 159/8552 | 257/18723 | 1.11e-07 | 1.81e-06 | 159 |
| GO:0061458110 | Esophagus | ESCC | reproductive system development | 247/8552 | 427/18723 | 2.24e-07 | 3.42e-06 | 247 |
| GO:00193189 | Esophagus | ESCC | hexose metabolic process | 147/8552 | 237/18723 | 2.63e-07 | 3.94e-06 | 147 |
| GO:004860818 | Esophagus | ESCC | reproductive structure development | 245/8552 | 424/18723 | 2.82e-07 | 4.14e-06 | 245 |
| GO:00060668 | Esophagus | ESCC | alcohol metabolic process | 202/8552 | 353/18723 | 7.32e-06 | 7.26e-05 | 202 |
| GO:00303239 | Esophagus | ESCC | respiratory tube development | 112/8552 | 181/18723 | 7.82e-06 | 7.69e-05 | 112 |
| GO:00459267 | Esophagus | ESCC | negative regulation of growth | 148/8552 | 249/18723 | 7.88e-06 | 7.73e-05 | 148 |
| GO:00605417 | Esophagus | ESCC | respiratory system development | 123/8552 | 203/18723 | 1.26e-05 | 1.15e-04 | 123 |
| GO:00303249 | Esophagus | ESCC | lung development | 109/8552 | 177/18723 | 1.40e-05 | 1.27e-04 | 109 |
| GO:00060069 | Esophagus | ESCC | glucose metabolic process | 119/8552 | 196/18723 | 1.51e-05 | 1.36e-04 | 119 |
| GO:00160514 | Esophagus | ESCC | carbohydrate biosynthetic process | 117/8552 | 202/18723 | 2.96e-04 | 1.79e-03 | 117 |
| GO:00485687 | Esophagus | ESCC | embryonic organ development | 228/8552 | 427/18723 | 7.28e-04 | 3.79e-03 | 228 |
| GO:00463643 | Esophagus | ESCC | monosaccharide biosynthetic process | 52/8552 | 82/18723 | 9.03e-04 | 4.61e-03 | 52 |
| GO:00193193 | Esophagus | ESCC | hexose biosynthetic process | 49/8552 | 78/18723 | 1.69e-03 | 7.81e-03 | 49 |
| GO:0097305111 | Esophagus | ESCC | response to alcohol | 138/8552 | 253/18723 | 2.70e-03 | 1.14e-02 | 138 |
| GO:000930617 | Esophagus | ESCC | protein secretion | 190/8552 | 359/18723 | 3.22e-03 | 1.34e-02 | 190 |
| GO:003559217 | Esophagus | ESCC | establishment of protein localization to extracellular region | 190/8552 | 360/18723 | 3.77e-03 | 1.53e-02 | 190 |
| GO:006053716 | Esophagus | ESCC | muscle tissue development | 211/8552 | 403/18723 | 3.84e-03 | 1.56e-02 | 211 |
| Page: 1 2 3 4 5 6 |
| Pathway ID | Tissue | Disease Stage | Description | Gene Ratio | Bg Ratio | pvalue | p.adjust | qvalue | Count |
| Page: 1 |
Top |
Cell-cell communication analysis |
| Identification of potential cell-cell interactions between two cell types and their ligand-receptor pairs for different disease states |
| Ligand | Receptor | LRpair | Pathway | Tissue | Disease Stage |
| Page: 1 |
Top |
Single-cell gene regulatory network inference analysis |
| Find out the significant the regulons (TFs) and the target genes of each regulon across cell types for different disease states |
| TF | Cell Type | Tissue | Disease Stage | Target Gene | RSS | Regulon Activity |
| ∗The dot plots of a searched regulon are shown for all cell subpopulations in each disease state of each tissue based on the regulon specific score inferred using pySCENIC and by calculating the average expression. |
| Page: 1 |
Top |
Somatic mutation of malignant transformation related genes |
| Annotation of somatic variants for genes involved in malignant transformation |
| Hugo Symbol | Variant Class | Variant Classification | dbSNP RS | HGVSc | HGVSp | HGVSp Short | SWISSPROT | BIOTYPE | SIFT | PolyPhen | Tumor Sample Barcode | Tissue | Histology | Sex | Age | Stage | Therapy Types | Drugs | Outcome |
| RBP4 | SNV | Missense_Mutation | rs766365350 | c.467N>T | p.Ser156Phe | p.S156F | P02753 | protein_coding | deleterious(0) | probably_damaging(0.969) | TCGA-D8-A1JL-01 | Breast | breast invasive carcinoma | Female | >=65 | I/II | Unknown | Unknown | SD |
| RBP4 | insertion | Frame_Shift_Ins | novel | c.284_285insTATCAGGATTTCATTTGGAGGGCGAAAAAGTACTGCCA | p.Thr96IlefsTer24 | p.T96Ifs*24 | P02753 | protein_coding | TCGA-A2-A0D1-01 | Breast | breast invasive carcinoma | Female | >=65 | I/II | Chemotherapy | taxotere | SD | ||
| RBP4 | SNV | Missense_Mutation | rs747468011 | c.416G>A | p.Arg139His | p.R139H | P02753 | protein_coding | deleterious(0) | probably_damaging(0.999) | TCGA-EA-A410-01 | Cervix | cervical & endocervical cancer | Female | <65 | I/II | Unknown | Unknown | SD |
| RBP4 | SNV | Missense_Mutation | c.265N>A | p.Ala89Thr | p.A89T | P02753 | protein_coding | deleterious(0) | probably_damaging(1) | TCGA-A6-2675-01 | Colorectum | colon adenocarcinoma | Male | >=65 | I/II | Unknown | Unknown | SD | |
| RBP4 | SNV | Missense_Mutation | c.265N>A | p.Ala89Thr | p.A89T | P02753 | protein_coding | deleterious(0) | probably_damaging(1) | TCGA-AA-3821-01 | Colorectum | colon adenocarcinoma | Female | >=65 | I/II | Unknown | Unknown | SD | |
| RBP4 | SNV | Missense_Mutation | c.71N>C | p.Val24Ala | p.V24A | P02753 | protein_coding | deleterious(0) | probably_damaging(0.998) | TCGA-DM-A1HB-01 | Colorectum | colon adenocarcinoma | Male | >=65 | III/IV | Unknown | Unknown | SD | |
| RBP4 | SNV | Missense_Mutation | rs189196082 | c.487C>T | p.Pro163Ser | p.P163S | P02753 | protein_coding | tolerated(0.53) | benign(0.001) | TCGA-BG-A222-01 | Endometrium | uterine corpus endometrioid carcinoma | Female | <65 | I/II | Unknown | Unknown | SD |
| RBP4 | SNV | Missense_Mutation | novel | c.599T>C | p.Leu200Pro | p.L200P | P02753 | protein_coding | deleterious_low_confidence(0.04) | benign(0.135) | TCGA-BS-A0UV-01 | Endometrium | uterine corpus endometrioid carcinoma | Female | <65 | III/IV | Unknown | Unknown | SD |
| RBP4 | SNV | Missense_Mutation | c.323A>G | p.Tyr108Cys | p.Y108C | P02753 | protein_coding | deleterious(0) | probably_damaging(1) | TCGA-E6-A1LX-01 | Endometrium | uterine corpus endometrioid carcinoma | Female | <65 | I/II | Unknown | Unknown | SD | |
| RBP4 | SNV | Missense_Mutation | novel | c.151G>A | p.Glu51Lys | p.E51K | P02753 | protein_coding | deleterious(0.03) | possibly_damaging(0.766) | TCGA-E6-A1LX-01 | Endometrium | uterine corpus endometrioid carcinoma | Female | <65 | I/II | Unknown | Unknown | SD |
| Page: 1 2 |
Top |
Related drugs of malignant transformation related genes |
| Identification of chemicals and drugs interact with genes involved in malignant transfromation |
| (DGIdb 4.0) |
| Entrez ID | Symbol | Category | Interaction Types | Drug Claim Name | Drug Name | PMIDs |
| 5950 | RBP4 | DRUGGABLE GENOME | US8853215, 3 | |||
| 5950 | RBP4 | DRUGGABLE GENOME | US8586571, 36 | |||
| 5950 | RBP4 | DRUGGABLE GENOME | FENRETINIDE | FENRETINIDE | 16034410 | |
| 5950 | RBP4 | DRUGGABLE GENOME | US9434727, 120 | |||
| 5950 | RBP4 | DRUGGABLE GENOME | FENRETINIDE | FENRETINIDE | 21591606 | |
| 5950 | RBP4 | DRUGGABLE GENOME | A1-10436 | |||
| 5950 | RBP4 | DRUGGABLE GENOME | US9434727, 63 | |||
| 5950 | RBP4 | DRUGGABLE GENOME | US9434727, 40 | |||
| 5950 | RBP4 | DRUGGABLE GENOME | US8586571, 12 | |||
| 5950 | RBP4 | DRUGGABLE GENOME | A1-10438 |
| Page: 1 2 |

Copyright 2023-Present -The University of Texas Health Science Center at Houston |