| Tissue | Expression Dynamics | Abbreviation |
| Breast | 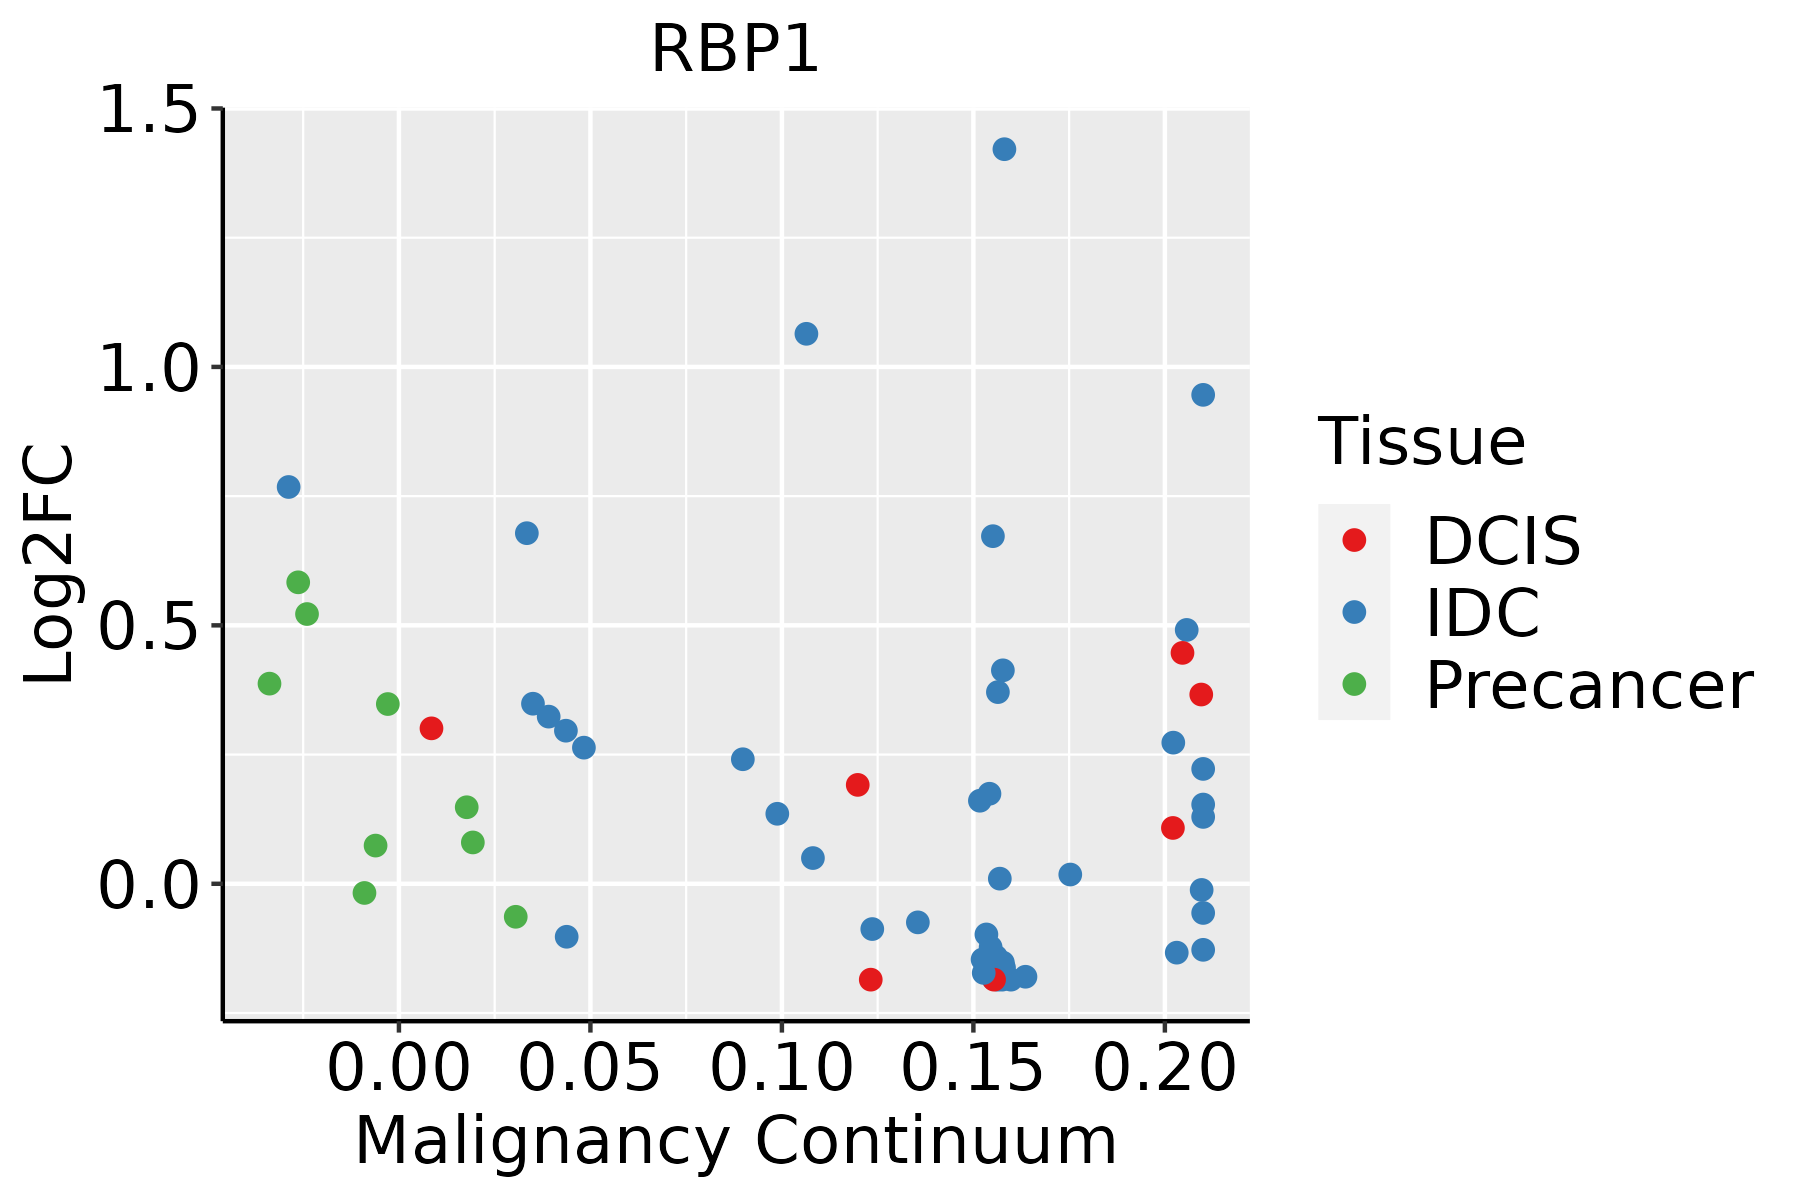 | IDC: Invasive ductal carcinoma |
| DCIS: Ductal carcinoma in situ |
| Precancer(BRCA1-mut): Precancerous lesion from BRCA1 mutation carriers |
| Cervix | 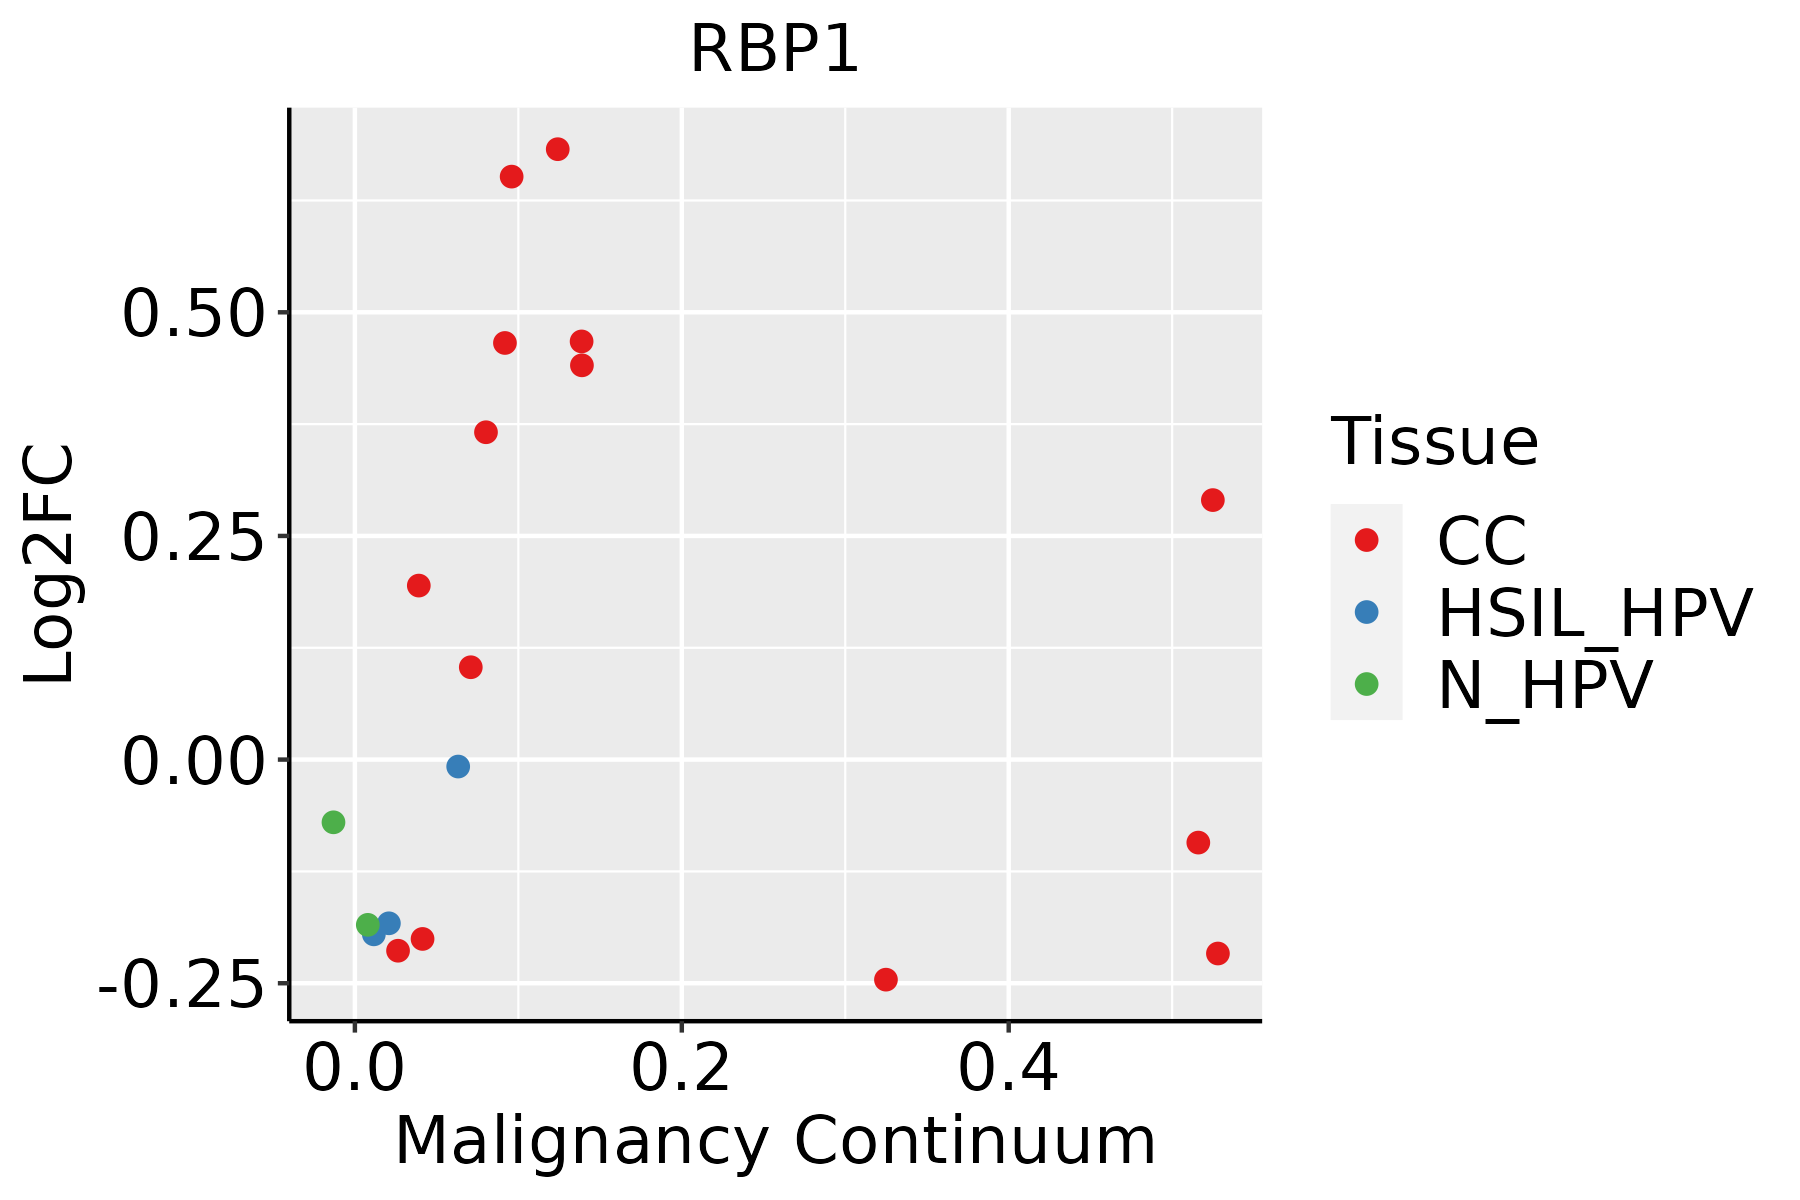 | CC: Cervix cancer |
| HSIL_HPV: HPV-infected high-grade squamous intraepithelial lesions |
| N_HPV: HPV-infected normal cervix |
| Endometrium | 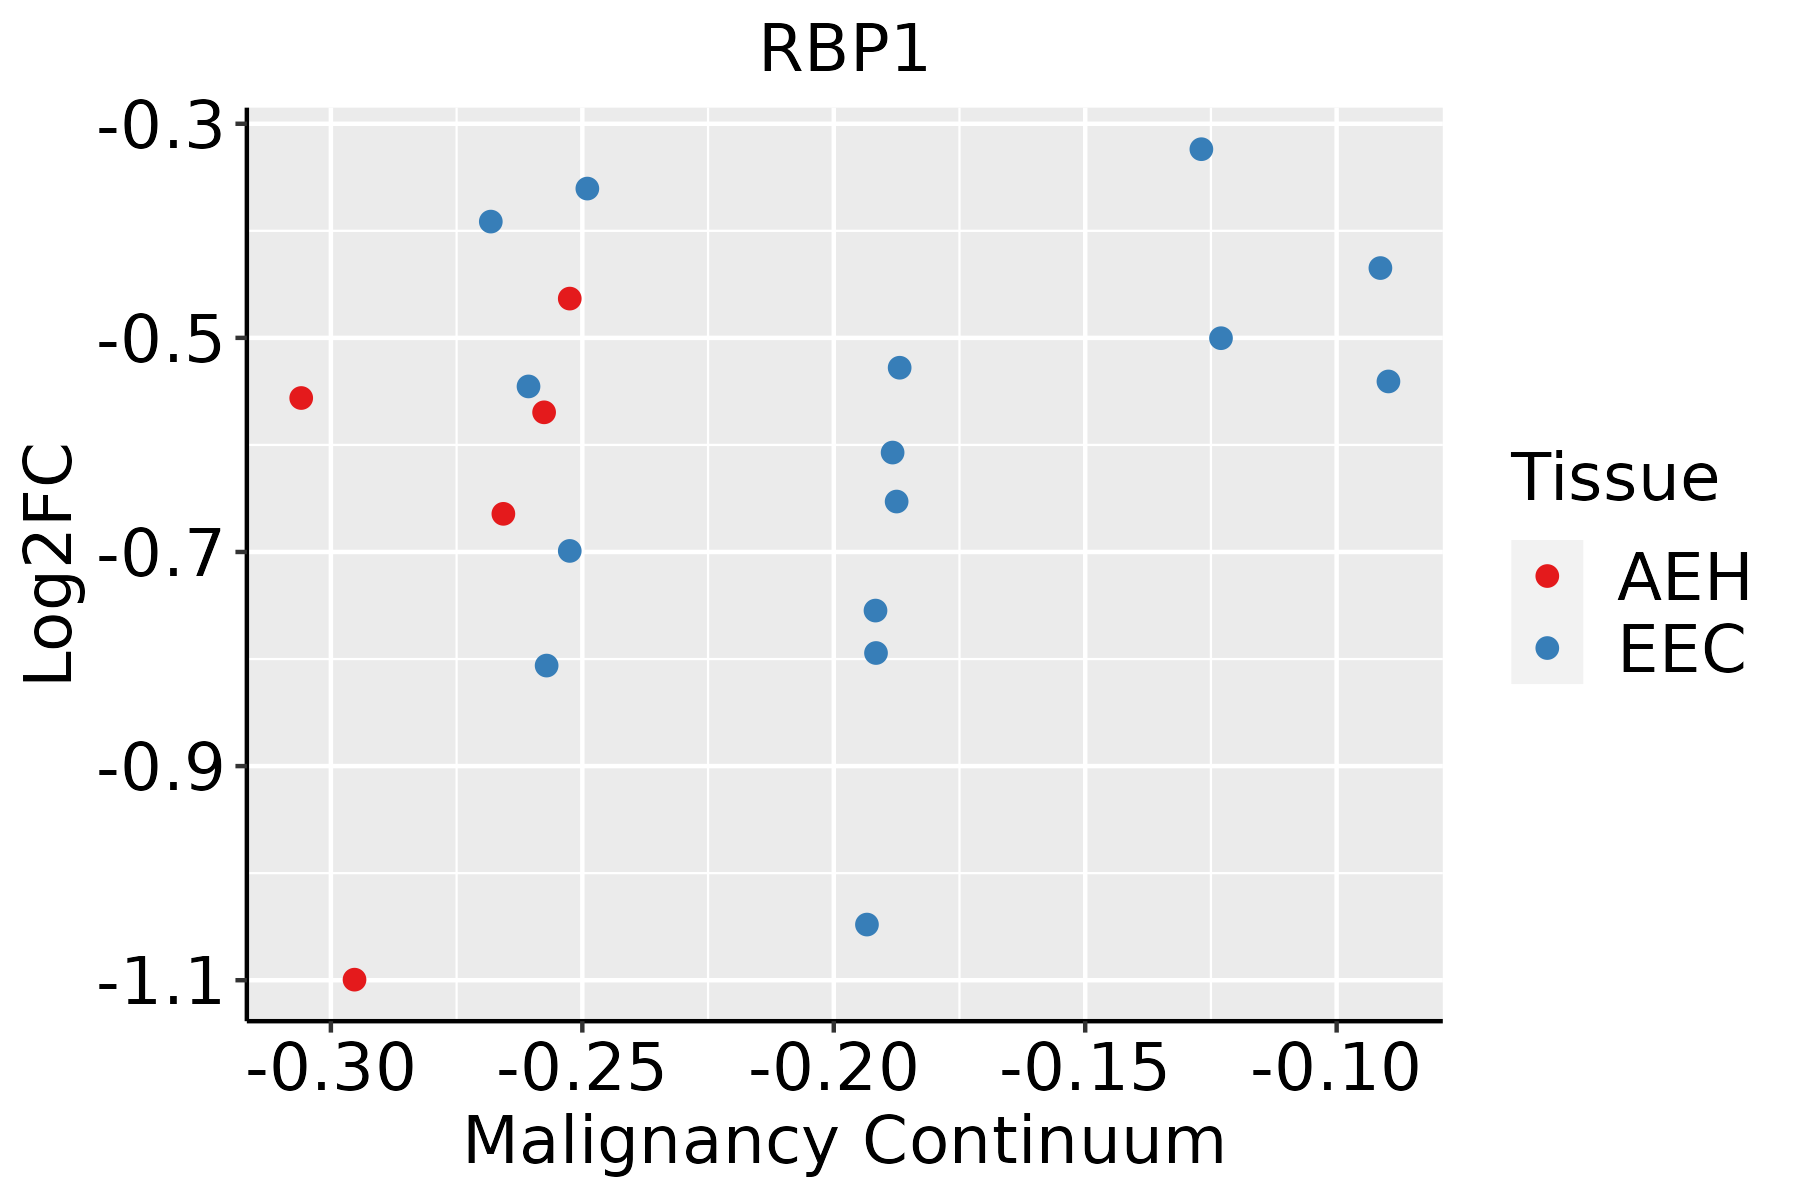 | AEH: Atypical endometrial hyperplasia |
| EEC: Endometrioid Cancer |
| Esophagus | 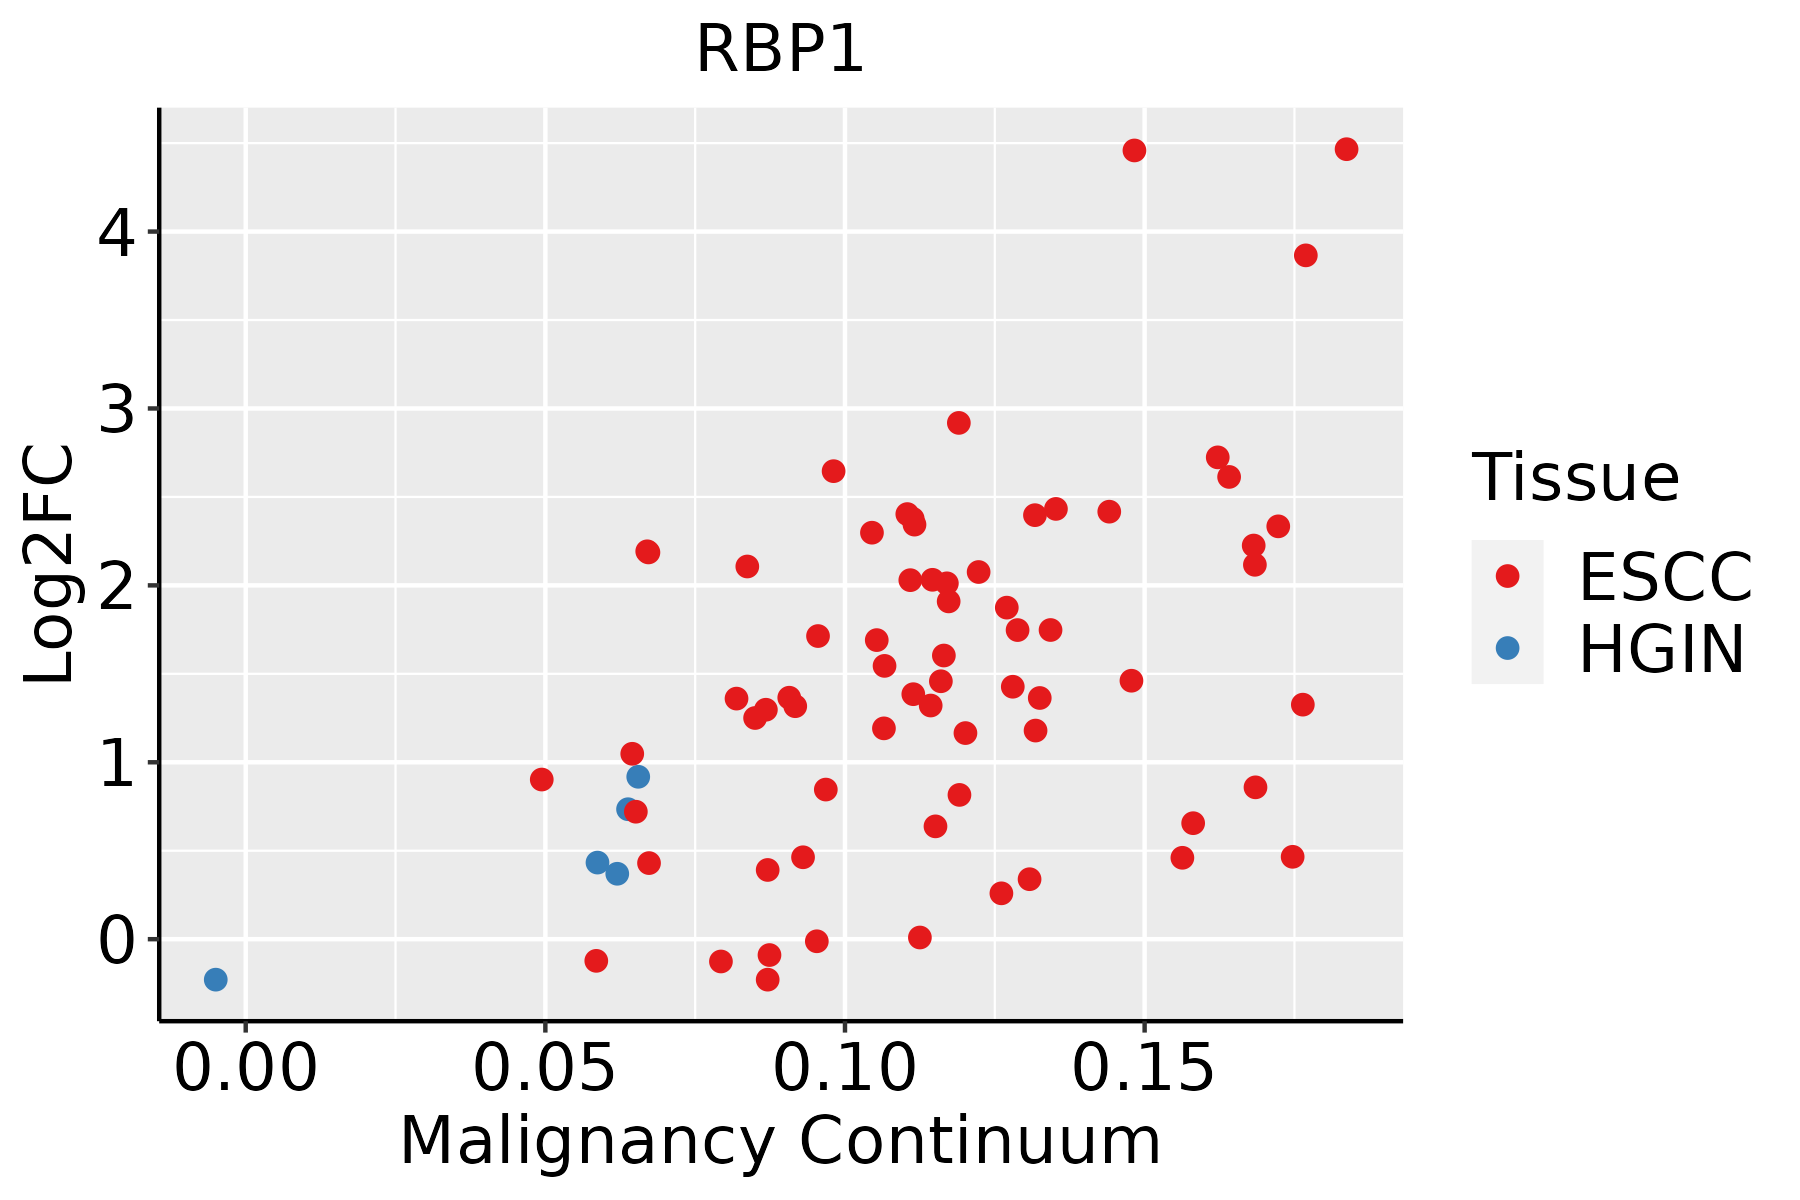 | ESCC: Esophageal squamous cell carcinoma |
| HGIN: High-grade intraepithelial neoplasias |
| LGIN: Low-grade intraepithelial neoplasias |
| Liver |  | HCC: Hepatocellular carcinoma |
| NAFLD: Non-alcoholic fatty liver disease |
| Oral Cavity | 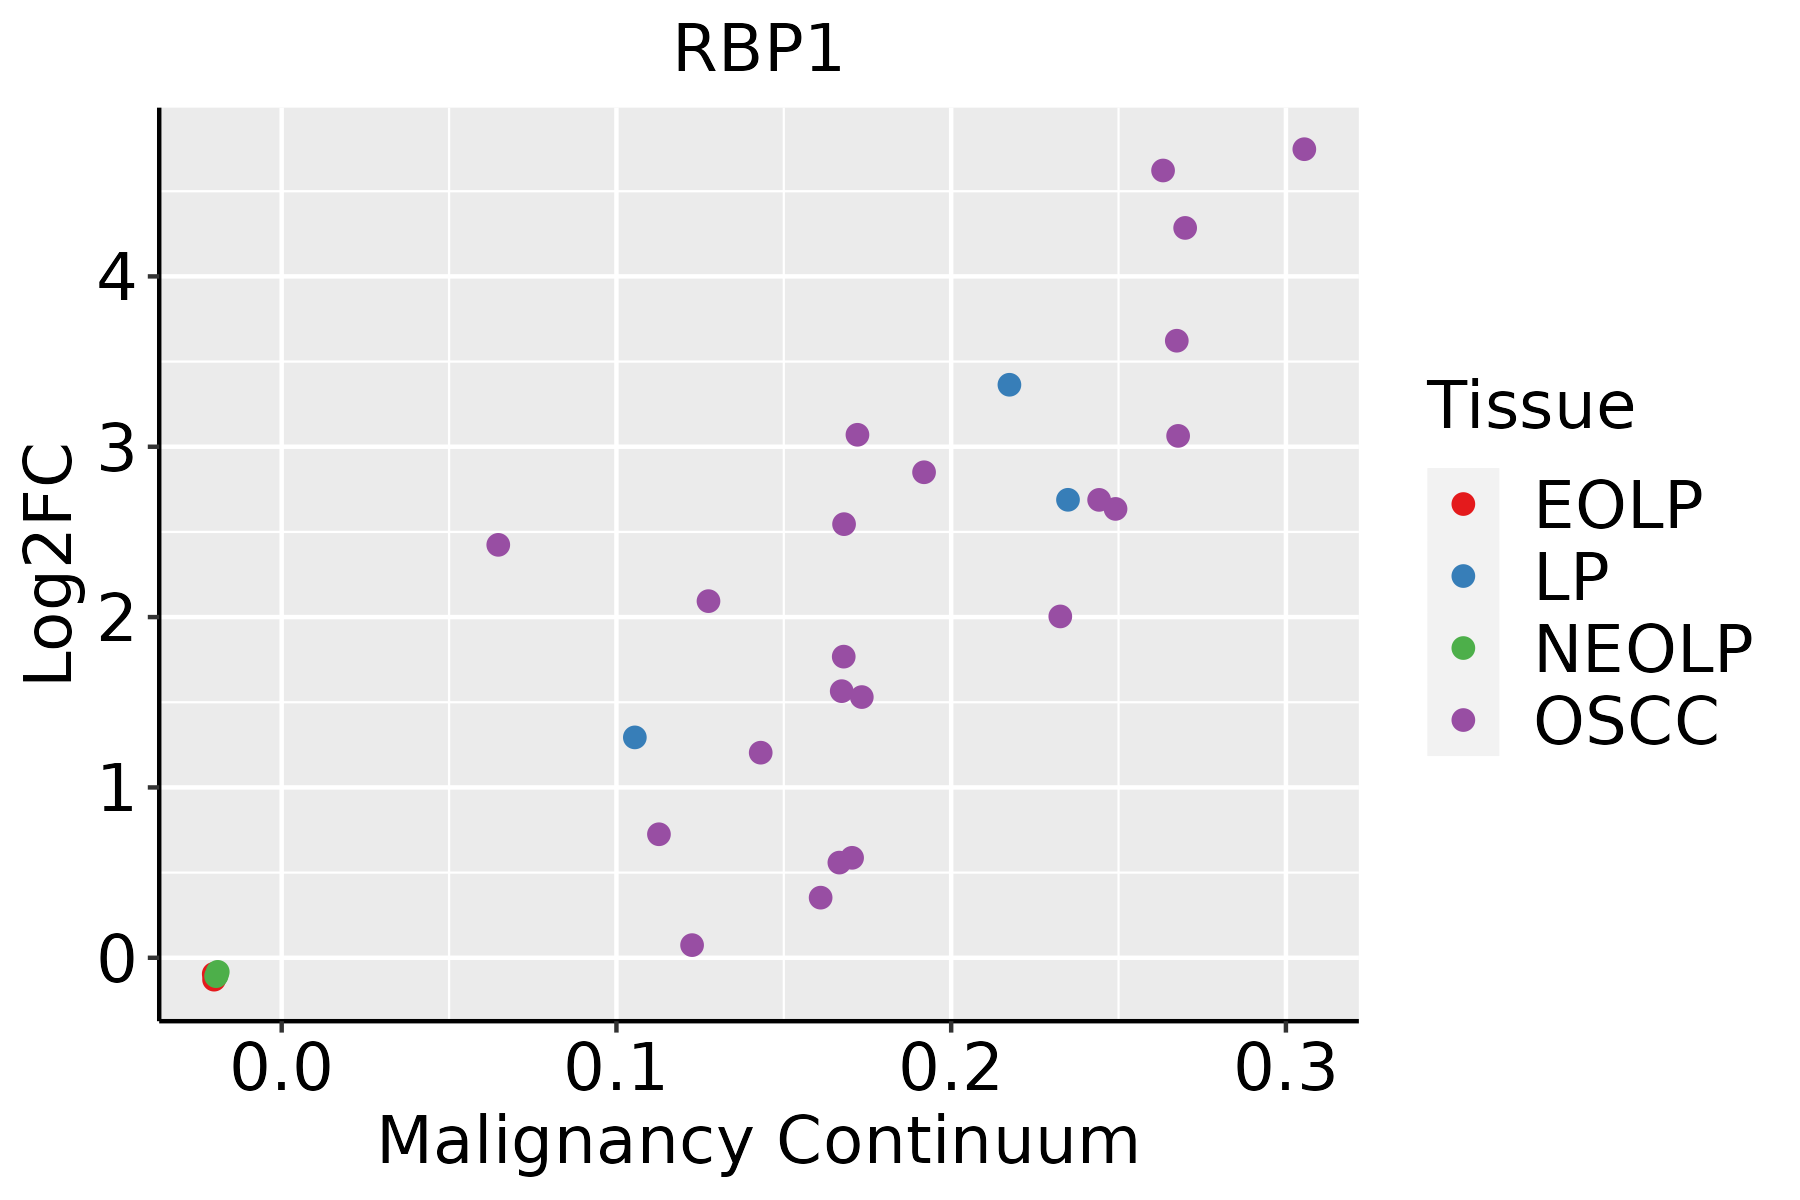 | EOLP: Erosive Oral lichen planus |
| LP: leukoplakia |
| NEOLP: Non-erosive oral lichen planus |
| OSCC: Oral squamous cell carcinoma |
| Skin |  | AK: Actinic keratosis |
| cSCC: Cutaneous squamous cell carcinoma |
| SCCIS:squamous cell carcinoma in situ |
| Thyroid | 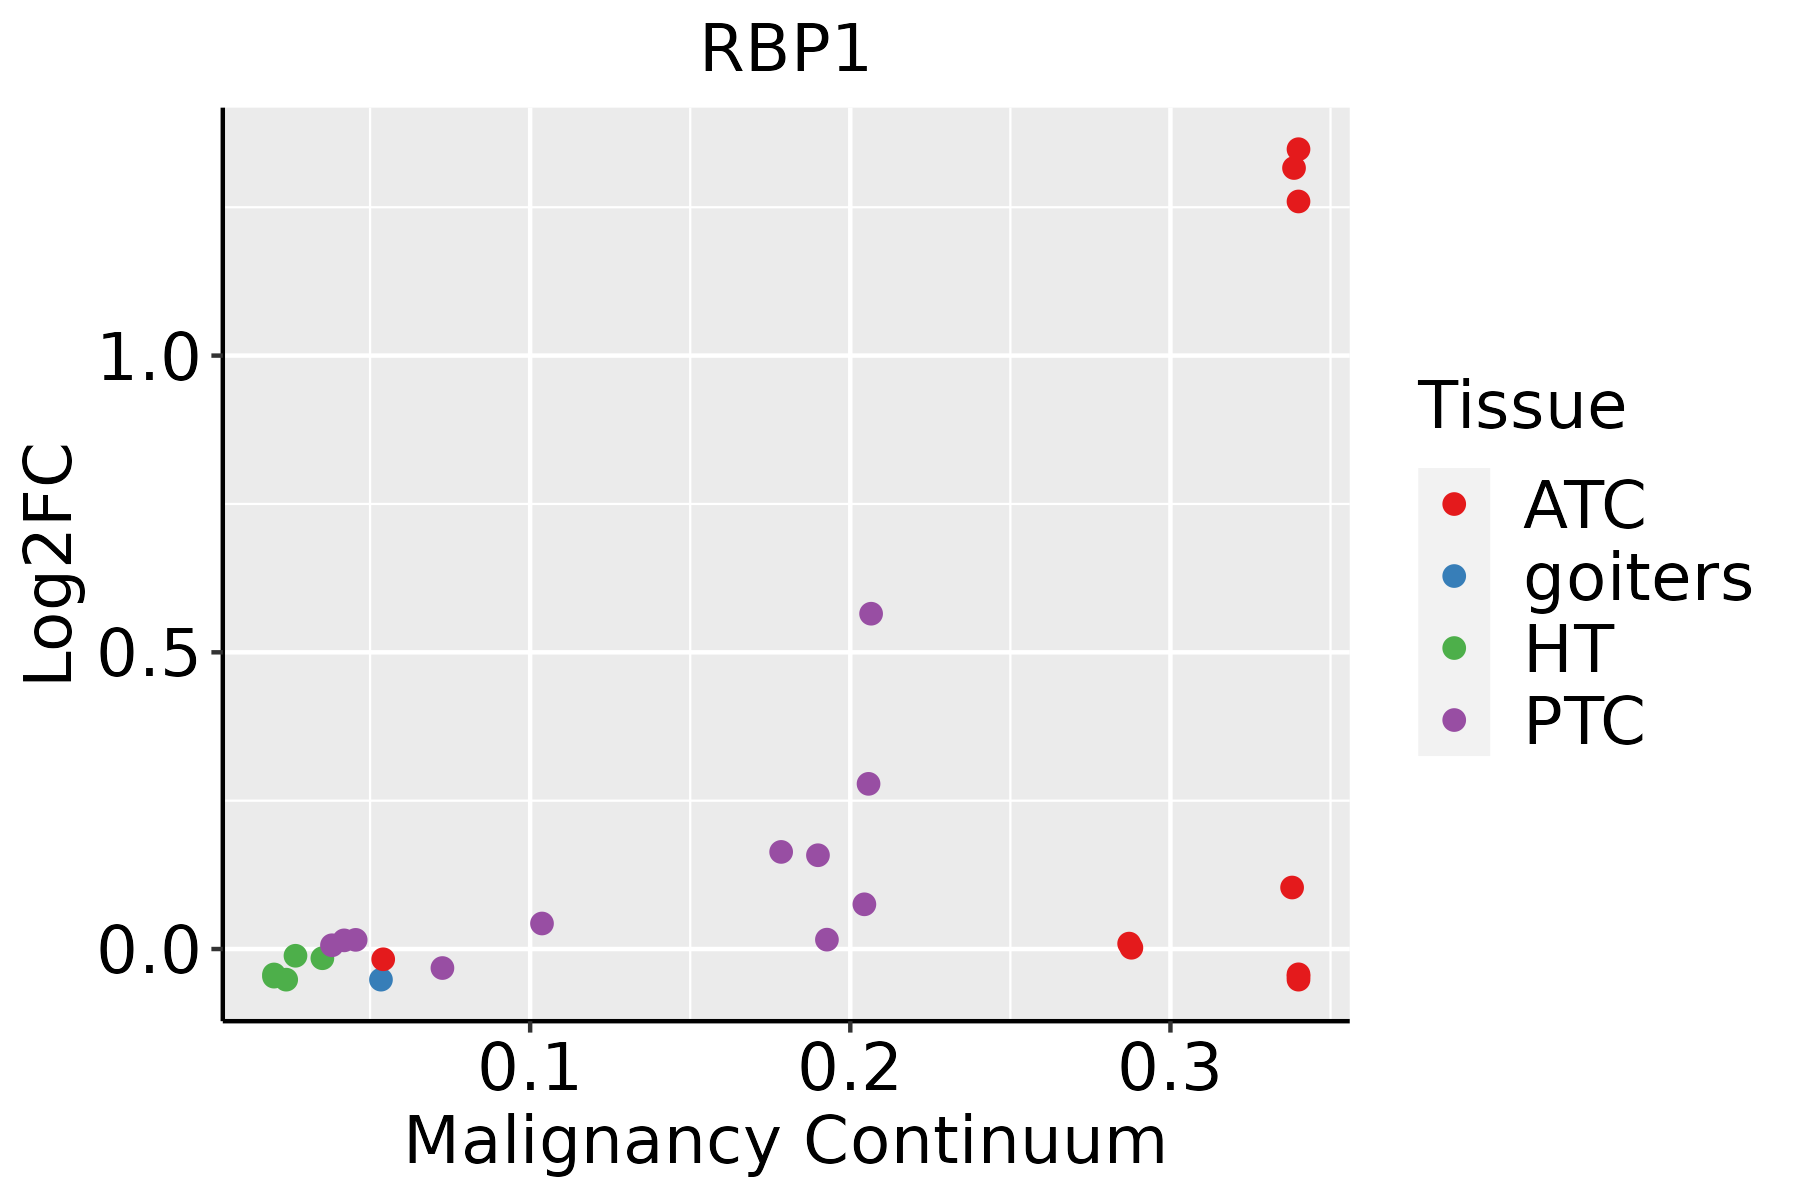 | ATC: Anaplastic thyroid cancer |
| HT: Hashimoto's thyroiditis |
| PTC: Papillary thyroid cancer |
| GO ID | Tissue | Disease Stage | Description | Gene Ratio | Bg Ratio | pvalue | p.adjust | Count |
| GO:00463946 | Breast | Precancer | carboxylic acid biosynthetic process | 32/1080 | 314/18723 | 1.30e-03 | 1.38e-02 | 32 |
| GO:00723304 | Breast | Precancer | monocarboxylic acid biosynthetic process | 24/1080 | 214/18723 | 1.41e-03 | 1.48e-02 | 24 |
| GO:00160536 | Breast | Precancer | organic acid biosynthetic process | 32/1080 | 316/18723 | 1.44e-03 | 1.50e-02 | 32 |
| GO:000164912 | Breast | IDC | osteoblast differentiation | 35/1434 | 229/18723 | 6.64e-05 | 1.35e-03 | 35 |
| GO:000150311 | Breast | IDC | ossification | 50/1434 | 408/18723 | 6.51e-04 | 8.04e-03 | 50 |
| GO:007233012 | Breast | IDC | monocarboxylic acid biosynthetic process | 29/1434 | 214/18723 | 1.91e-03 | 1.83e-02 | 29 |
| GO:001605313 | Breast | IDC | organic acid biosynthetic process | 39/1434 | 316/18723 | 2.13e-03 | 1.99e-02 | 39 |
| GO:004639413 | Breast | IDC | carboxylic acid biosynthetic process | 38/1434 | 314/18723 | 3.39e-03 | 2.83e-02 | 38 |
| GO:000164921 | Breast | DCIS | osteoblast differentiation | 32/1390 | 229/18723 | 4.00e-04 | 5.48e-03 | 32 |
| GO:001605322 | Breast | DCIS | organic acid biosynthetic process | 38/1390 | 316/18723 | 2.22e-03 | 2.04e-02 | 38 |
| GO:007233022 | Breast | DCIS | monocarboxylic acid biosynthetic process | 28/1390 | 214/18723 | 2.43e-03 | 2.18e-02 | 28 |
| GO:004639422 | Breast | DCIS | carboxylic acid biosynthetic process | 37/1390 | 314/18723 | 3.56e-03 | 2.92e-02 | 37 |
| GO:000150321 | Breast | DCIS | ossification | 45/1390 | 408/18723 | 4.98e-03 | 3.72e-02 | 45 |
| GO:00064029 | Cervix | CC | mRNA catabolic process | 56/2311 | 232/18723 | 4.81e-07 | 1.83e-05 | 56 |
| GO:19033119 | Cervix | CC | regulation of mRNA metabolic process | 64/2311 | 288/18723 | 1.71e-06 | 5.64e-05 | 64 |
| GO:00064019 | Cervix | CC | RNA catabolic process | 62/2311 | 278/18723 | 2.18e-06 | 6.56e-05 | 62 |
| GO:00610139 | Cervix | CC | regulation of mRNA catabolic process | 38/2311 | 166/18723 | 1.07e-04 | 1.36e-03 | 38 |
| GO:00467008 | Cervix | CC | heterocycle catabolic process | 80/2311 | 445/18723 | 3.23e-04 | 3.42e-03 | 80 |
| GO:00346559 | Cervix | CC | nucleobase-containing compound catabolic process | 74/2311 | 407/18723 | 3.77e-04 | 3.88e-03 | 74 |
| GO:00434889 | Cervix | CC | regulation of mRNA stability | 35/2311 | 158/18723 | 3.80e-04 | 3.89e-03 | 35 |
| Hugo Symbol | Variant Class | Variant Classification | dbSNP RS | HGVSc | HGVSp | HGVSp Short | SWISSPROT | BIOTYPE | SIFT | PolyPhen | Tumor Sample Barcode | Tissue | Histology | Sex | Age | Stage | Therapy Types | Drugs | Outcome |
| RBP1 | SNV | Missense_Mutation | novel | c.88N>T | p.Arg30Trp | p.R30W | | protein_coding | deleterious_low_confidence(0) | possibly_damaging(0.855) | TCGA-BH-A0B6-01 | Breast | breast invasive carcinoma | Female | <65 | I/II | Unknown | Unknown | SD |
| RBP1 | SNV | Missense_Mutation | | c.10N>T | p.Pro4Ser | p.P4S | | protein_coding | deleterious_low_confidence(0) | possibly_damaging(0.651) | TCGA-BH-A18P-01 | Breast | breast invasive carcinoma | Female | <65 | I/II | Unknown | Unknown | PD |
| RBP1 | SNV | Missense_Mutation | | c.196N>A | p.Asp66Asn | p.D66N | | protein_coding | tolerated(0.4) | benign(0.006) | TCGA-C8-A26W-01 | Breast | breast invasive carcinoma | Female | <65 | I/II | Chemotherapy | doxorubicin | CR |
| RBP1 | SNV | Missense_Mutation | | c.575T>C | p.Val192Ala | p.V192A | | protein_coding | deleterious(0.03) | probably_damaging(0.989) | TCGA-D8-A142-01 | Breast | breast invasive carcinoma | Female | >=65 | I/II | Chemotherapy | cyclophosphamid | SD |
| RBP1 | SNV | Missense_Mutation | novel | c.428G>A | p.Arg143His | p.R143H | | protein_coding | deleterious(0) | probably_damaging(0.972) | TCGA-2W-A8YY-01 | Cervix | cervical & endocervical cancer | Female | <65 | I/II | Chemotherapy | cisplatin | CR |
| RBP1 | SNV | Missense_Mutation | | c.286N>A | p.Ala96Thr | p.A96T | | protein_coding | deleterious(0) | probably_damaging(0.998) | TCGA-AA-3715-01 | Colorectum | colon adenocarcinoma | Male | >=65 | I/II | Unknown | Unknown | PD |
| RBP1 | SNV | Missense_Mutation | | c.161N>A | p.Ala54Asp | p.A54D | | protein_coding | deleterious_low_confidence(0.01) | benign(0.037) | TCGA-WS-AB45-01 | Colorectum | colon adenocarcinoma | Female | <65 | I/II | Unknown | Unknown | SD |
| RBP1 | SNV | Missense_Mutation | | c.286G>A | p.Ala96Thr | p.A96T | | protein_coding | deleterious(0) | probably_damaging(0.998) | TCGA-A5-A7WJ-01 | Endometrium | uterine corpus endometrioid carcinoma | Female | <65 | I/II | Unknown | Unknown | SD |
| RBP1 | SNV | Missense_Mutation | novel | c.151C>T | p.Pro51Ser | p.P51S | | protein_coding | tolerated_low_confidence(0.51) | benign(0.006) | TCGA-AP-A1DK-01 | Endometrium | uterine corpus endometrioid carcinoma | Female | <65 | I/II | Unknown | Unknown | SD |
| RBP1 | SNV | Missense_Mutation | novel | c.231G>T | p.Glu77Asp | p.E77D | | protein_coding | tolerated(0.44) | benign(0) | TCGA-AP-A1E0-01 | Endometrium | uterine corpus endometrioid carcinoma | Female | <65 | III/IV | Chemotherapy | paclitaxel | SD |


