
|
|||||
|
 | |
| |
| |
| |
| |
| |
|
Gene: RBMS3 |
Gene summary for RBMS3 |
| Gene information | Species | Human | Gene symbol | RBMS3 | Gene ID | 27303 |
| Gene name | RNA binding motif single stranded interacting protein 3 | |
| Gene Alias | RBMS3 | |
| Cytomap | 3p24.1 | |
| Gene Type | protein-coding | GO ID | GO:0002347 | UniProtAcc | Q6XE24 |
Top |
Malignant transformation analysis |
| Identification of the aberrant gene expression in precancerous and cancerous lesions by comparing the gene expression of stem-like cells in diseased tissues with normal stem cells |
| Entrez ID | Symbol | Replicates | Species | Organ | Tissue | Adj P-value | Log2FC | Malignancy |
| 27303 | RBMS3 | P8T-E | Human | Esophagus | ESCC | 1.41e-10 | 4.14e-01 | 0.0889 |
| 27303 | RBMS3 | P10T-E | Human | Esophagus | ESCC | 2.31e-14 | 2.82e-01 | 0.116 |
| 27303 | RBMS3 | P11T-E | Human | Esophagus | ESCC | 1.92e-03 | 2.10e-01 | 0.1426 |
| 27303 | RBMS3 | P16T-E | Human | Esophagus | ESCC | 6.16e-33 | 6.49e-01 | 0.1153 |
| 27303 | RBMS3 | P23T-E | Human | Esophagus | ESCC | 1.48e-07 | 1.51e-01 | 0.108 |
| 27303 | RBMS3 | P24T-E | Human | Esophagus | ESCC | 1.91e-02 | 1.20e-01 | 0.1287 |
| 27303 | RBMS3 | P26T-E | Human | Esophagus | ESCC | 8.82e-25 | 4.49e-01 | 0.1276 |
| 27303 | RBMS3 | P27T-E | Human | Esophagus | ESCC | 2.27e-02 | 1.39e-01 | 0.1055 |
| 27303 | RBMS3 | P32T-E | Human | Esophagus | ESCC | 3.46e-05 | 1.79e-01 | 0.1666 |
| 27303 | RBMS3 | P36T-E | Human | Esophagus | ESCC | 1.40e-07 | 3.25e-01 | 0.1187 |
| 27303 | RBMS3 | P37T-E | Human | Esophagus | ESCC | 4.77e-03 | 1.01e-01 | 0.1371 |
| 27303 | RBMS3 | P39T-E | Human | Esophagus | ESCC | 8.10e-07 | 1.39e-01 | 0.0894 |
| 27303 | RBMS3 | P42T-E | Human | Esophagus | ESCC | 3.18e-05 | 1.89e-01 | 0.1175 |
| 27303 | RBMS3 | P44T-E | Human | Esophagus | ESCC | 1.75e-02 | 1.60e-01 | 0.1096 |
| 27303 | RBMS3 | P47T-E | Human | Esophagus | ESCC | 1.75e-03 | 1.05e-01 | 0.1067 |
| 27303 | RBMS3 | P49T-E | Human | Esophagus | ESCC | 1.02e-03 | 3.63e-01 | 0.1768 |
| 27303 | RBMS3 | P54T-E | Human | Esophagus | ESCC | 3.39e-10 | 2.11e-01 | 0.0975 |
| 27303 | RBMS3 | P57T-E | Human | Esophagus | ESCC | 1.86e-02 | 1.36e-01 | 0.0926 |
| 27303 | RBMS3 | P61T-E | Human | Esophagus | ESCC | 2.00e-04 | 9.70e-02 | 0.099 |
| 27303 | RBMS3 | P74T-E | Human | Esophagus | ESCC | 1.93e-03 | 1.67e-01 | 0.1479 |
| Page: 1 2 3 4 5 6 |
| Tissue | Expression Dynamics | Abbreviation |
| Esophagus | 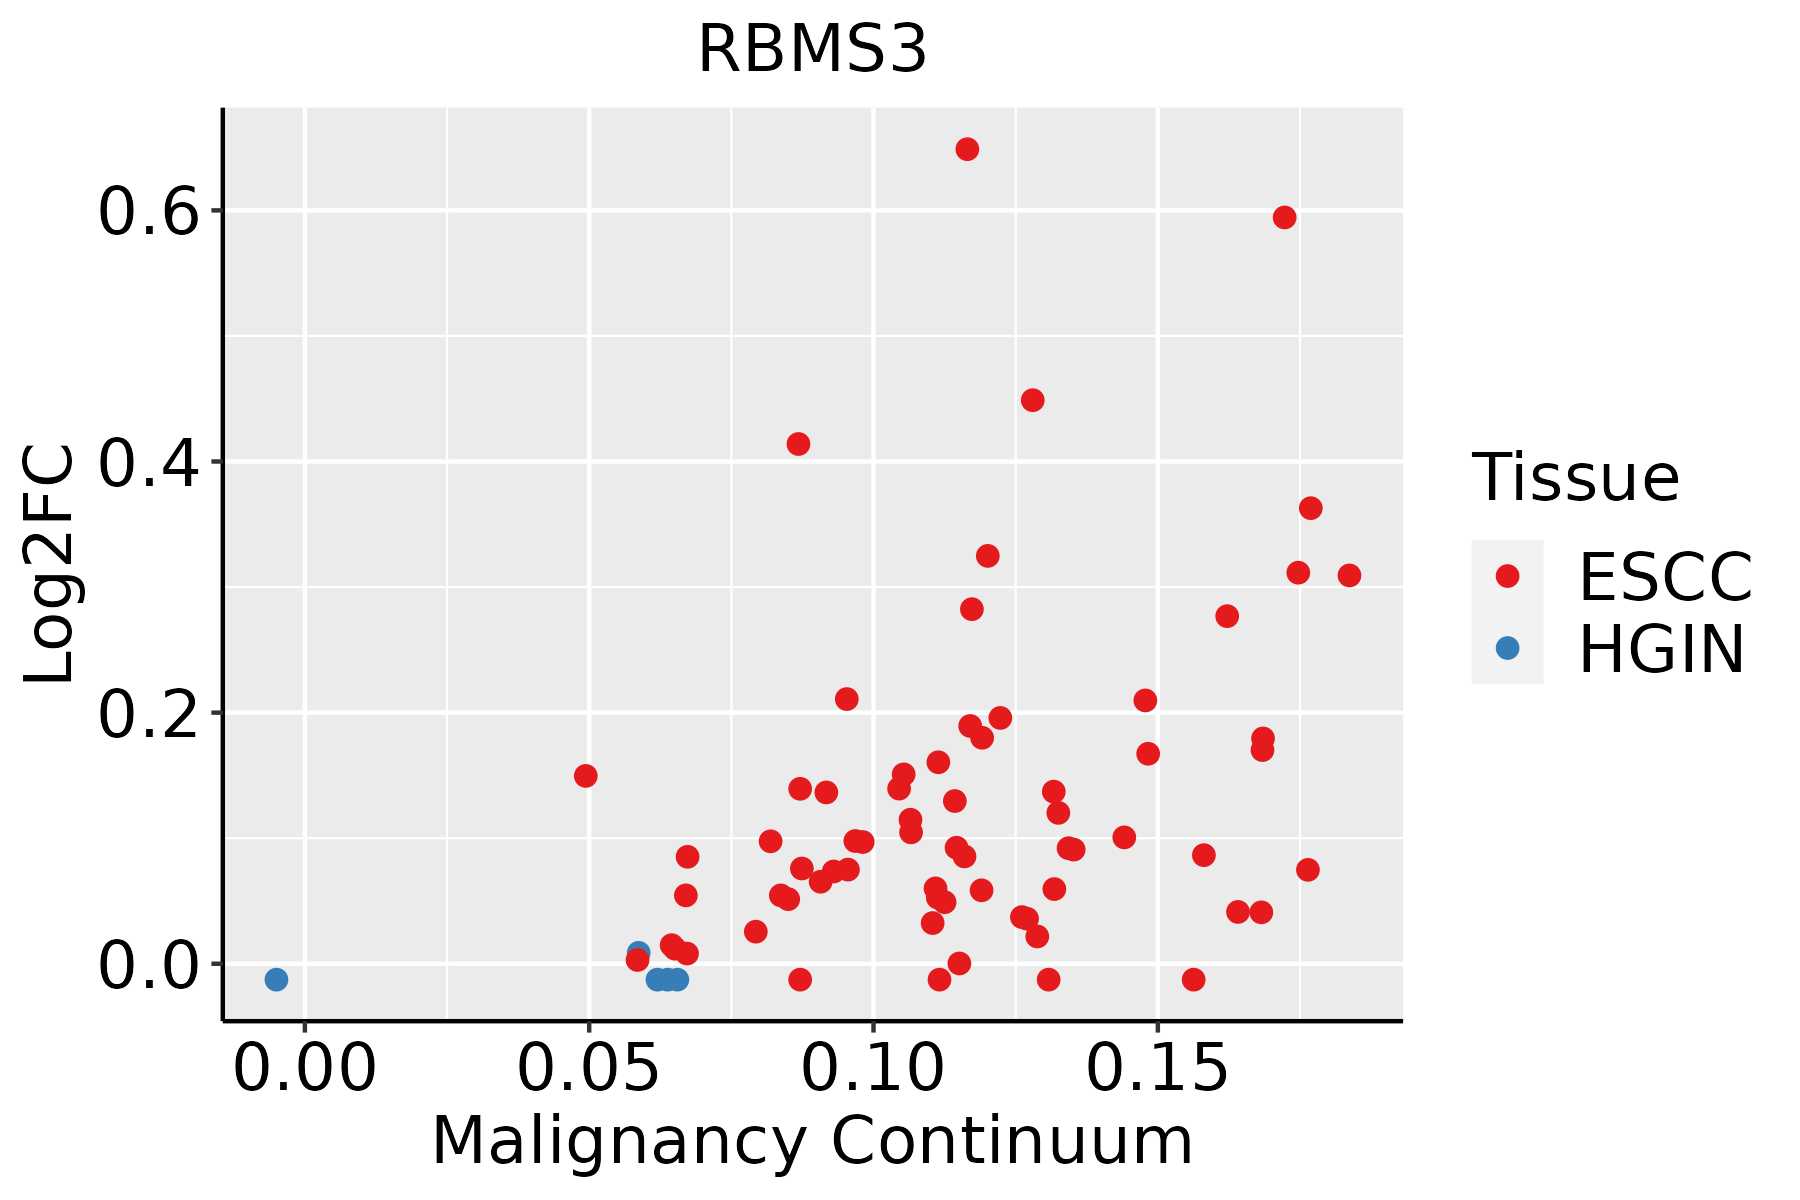 | ESCC: Esophageal squamous cell carcinoma |
| HGIN: High-grade intraepithelial neoplasias | ||
| LGIN: Low-grade intraepithelial neoplasias | ||
| Lung | 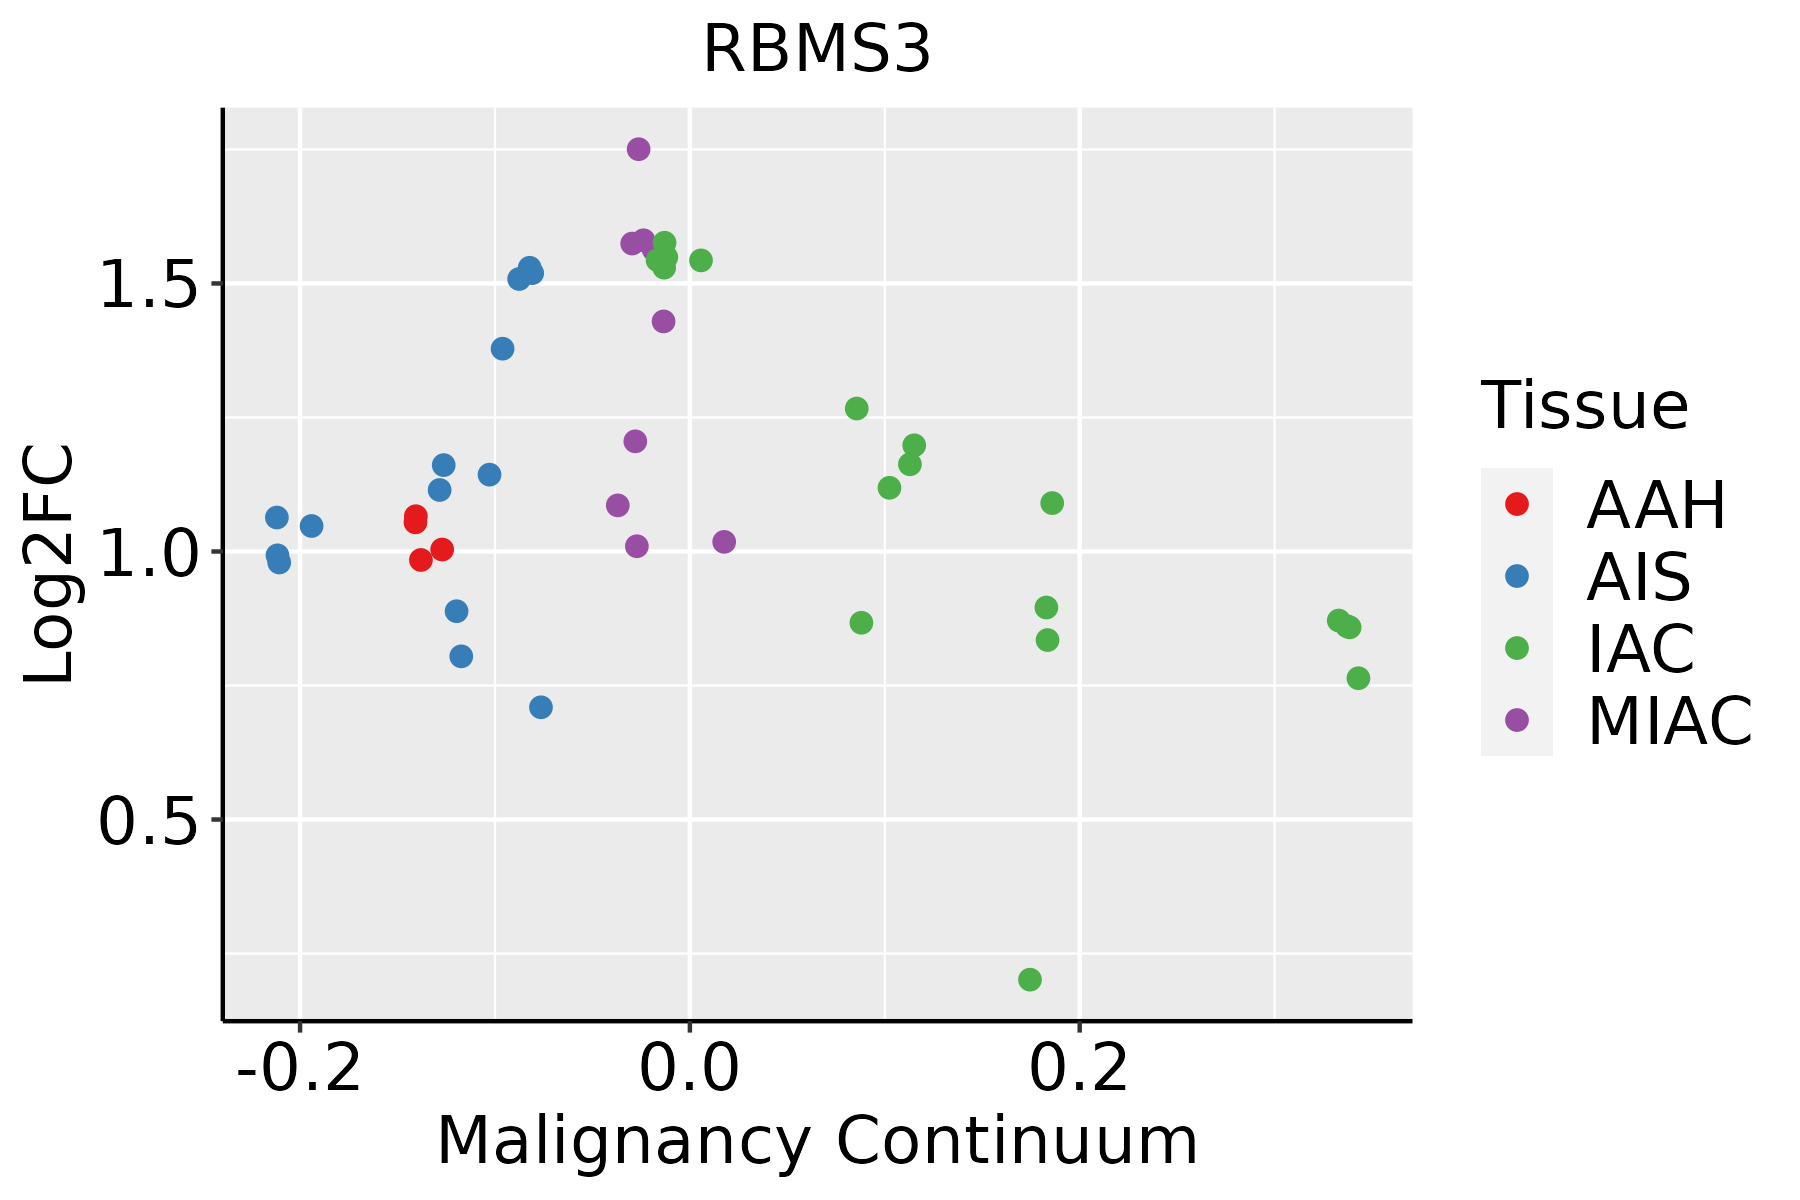 | AAH: Atypical adenomatous hyperplasia |
| AIS: Adenocarcinoma in situ | ||
| IAC: Invasive lung adenocarcinoma | ||
| MIA: Minimally invasive adenocarcinoma | ||
| Oral Cavity | 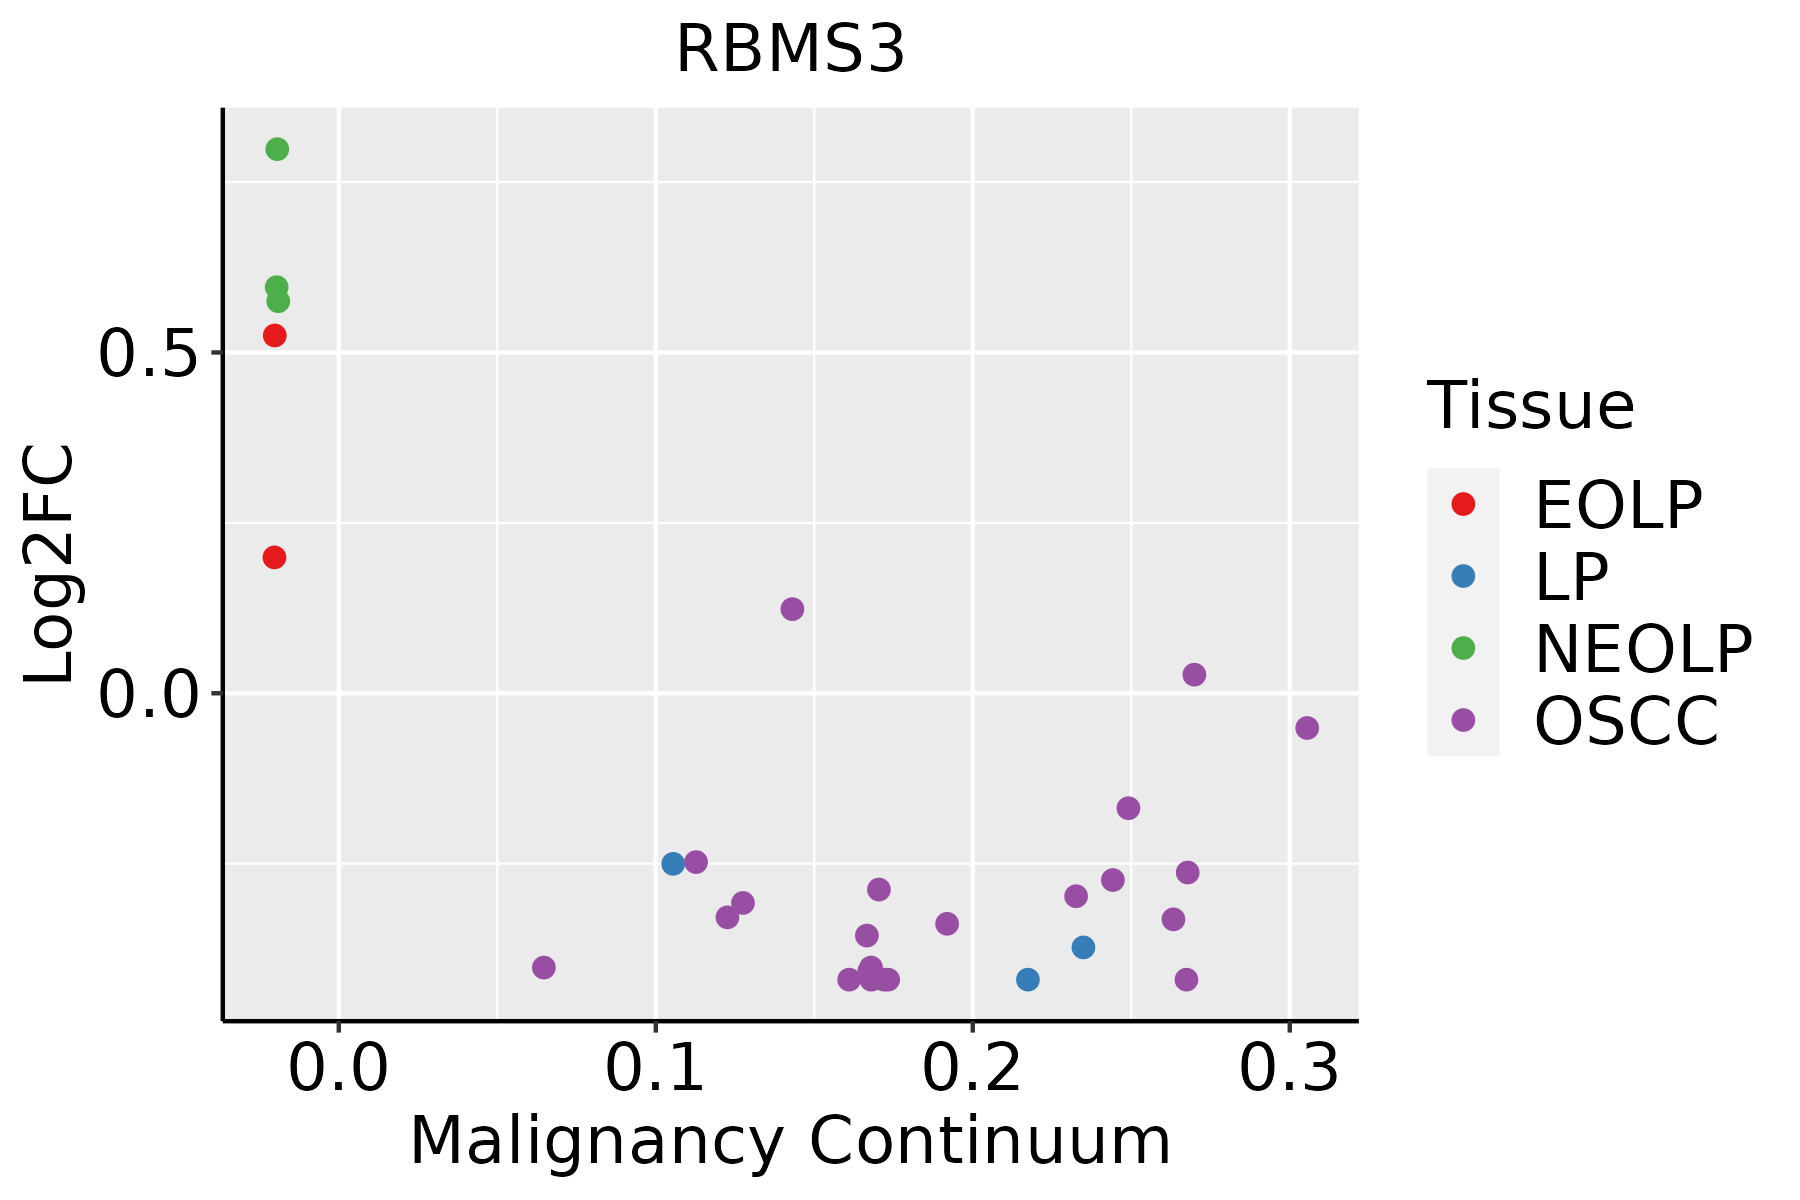 | EOLP: Erosive Oral lichen planus |
| LP: leukoplakia | ||
| NEOLP: Non-erosive oral lichen planus | ||
| OSCC: Oral squamous cell carcinoma | ||
| Prostate | 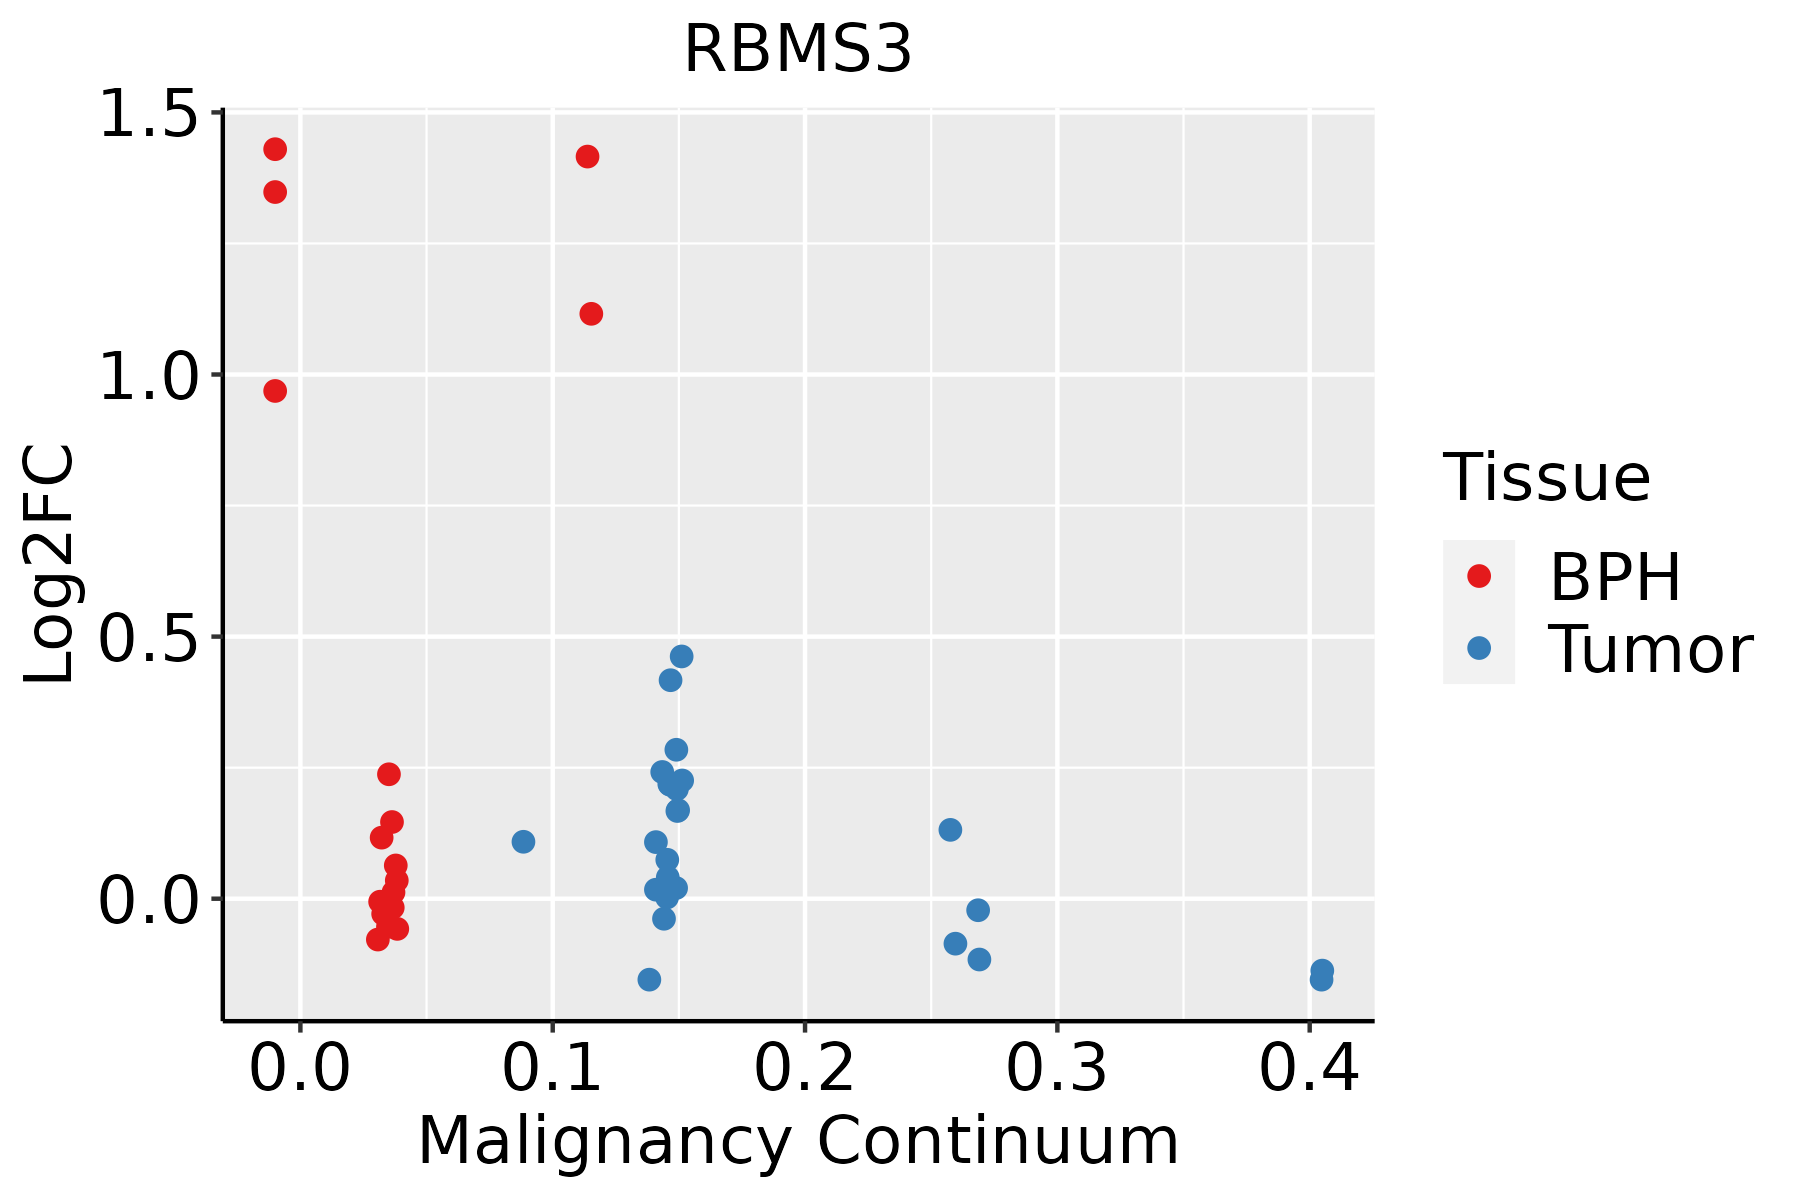 | BPH: Benign Prostatic Hyperplasia |
| Thyroid | 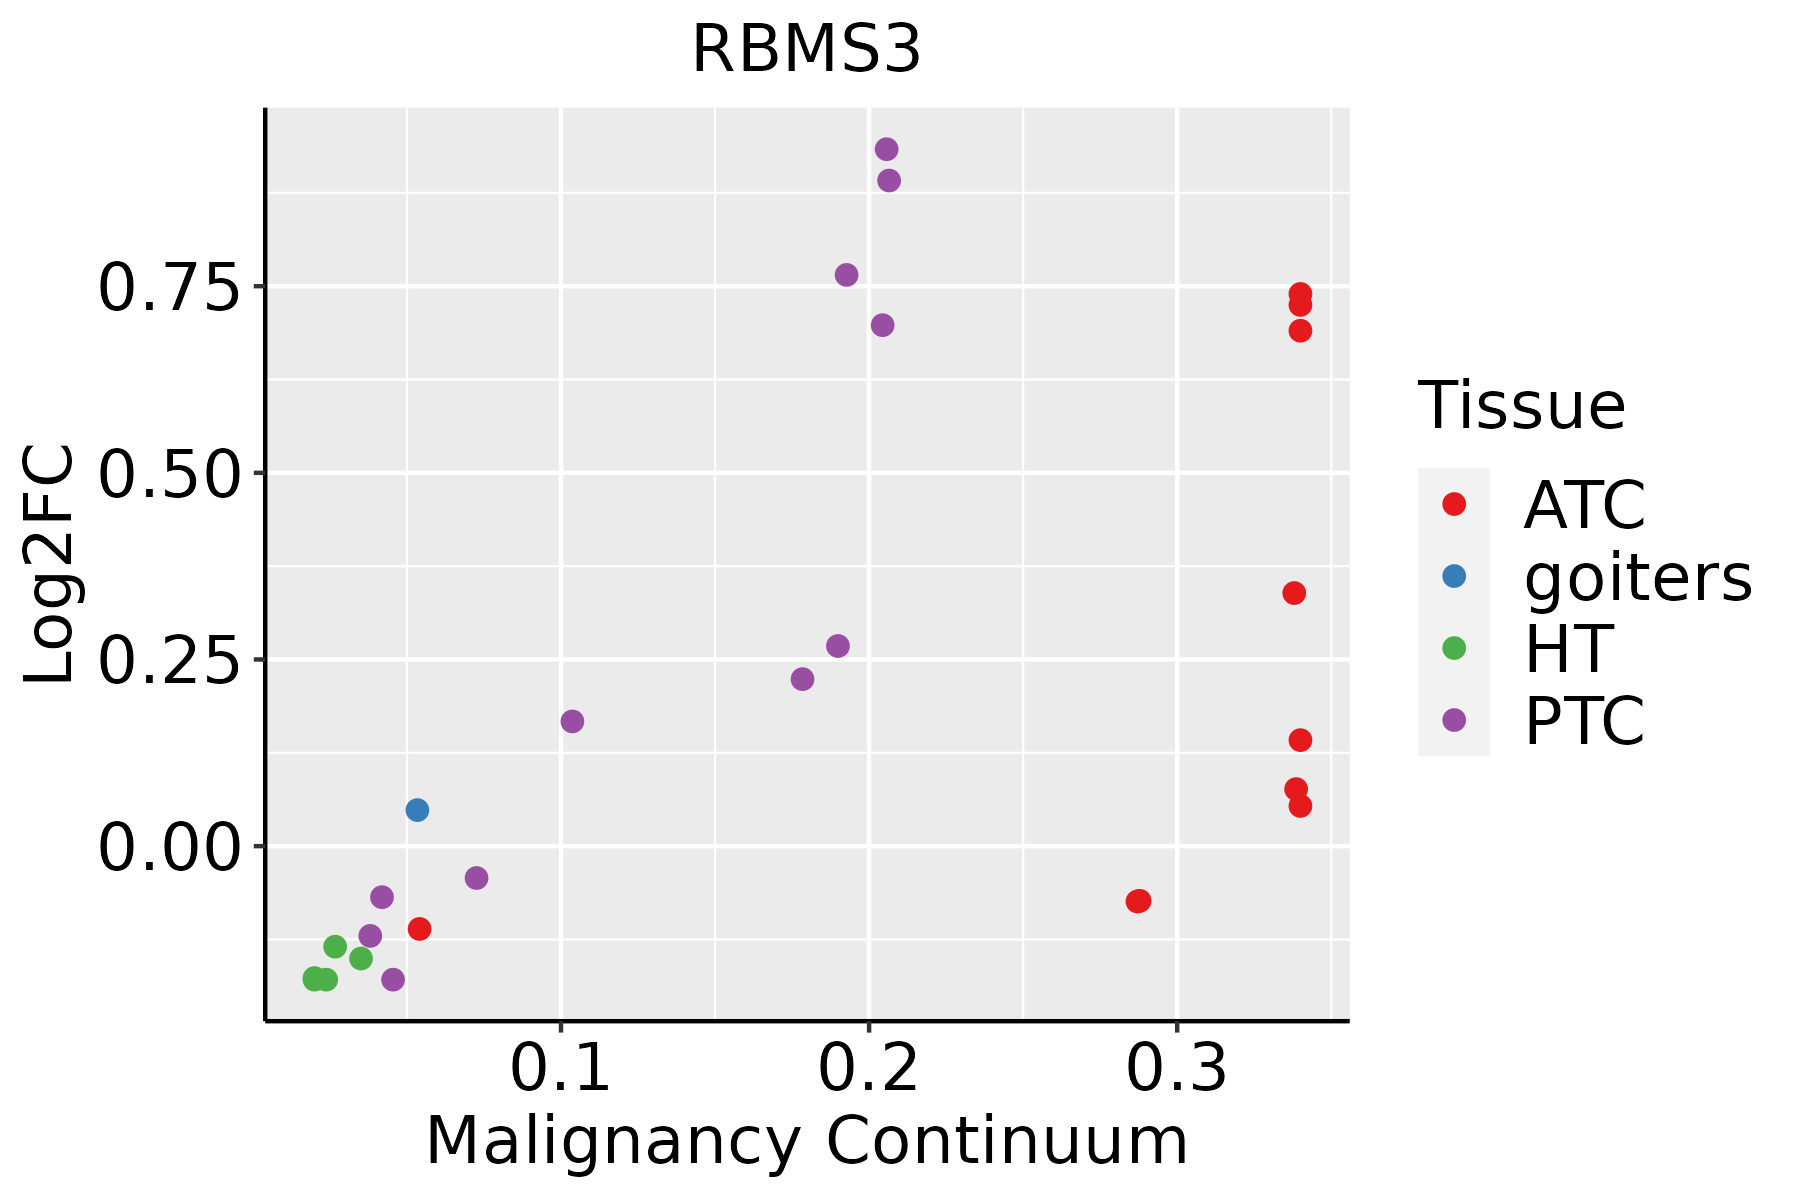 | ATC: Anaplastic thyroid cancer |
| HT: Hashimoto's thyroiditis | ||
| PTC: Papillary thyroid cancer |
| ∗log2FC in expression of this searched gene in stem-like cells from each diseased tissue sample relative to stem-like cells in normal samples in each tissue plotted against the malignancy continuum. Samples are colored based on if they are from different disease stage. |
Top |
Malignant transformation related pathway analysis |
| Find out the enriched GO biological processes and KEGG pathways involved in transition from healthy to precancer to cancer |
| Tissue | Disease Stage | Enriched GO biological Processes |
| Colorectum | AD |  |
| Colorectum | SER |  |
| Colorectum | MSS |  |
| Colorectum | MSI-H |  |
| Colorectum | FAP |  |
| ∗Top 15 enriched GO BP terms are showed in the bar plot of each disease state in each tissue. Each row represents a significant GO biological process which is colored according to the -log10(p.adjust). |
| Page: 1 2 3 4 5 6 7 8 9 |
| GO ID | Tissue | Disease Stage | Description | Gene Ratio | Bg Ratio | pvalue | p.adjust | Count |
| GO:001605517 | Esophagus | ESCC | Wnt signaling pathway | 268/8552 | 444/18723 | 2.32e-10 | 6.58e-09 | 268 |
| GO:019873817 | Esophagus | ESCC | cell-cell signaling by wnt | 269/8552 | 446/18723 | 2.41e-10 | 6.79e-09 | 269 |
| GO:003011117 | Esophagus | ESCC | regulation of Wnt signaling pathway | 194/8552 | 328/18723 | 5.39e-07 | 7.14e-06 | 194 |
| GO:006007016 | Esophagus | ESCC | canonical Wnt signaling pathway | 180/8552 | 303/18723 | 9.15e-07 | 1.17e-05 | 180 |
| GO:006082817 | Esophagus | ESCC | regulation of canonical Wnt signaling pathway | 153/8552 | 253/18723 | 1.38e-06 | 1.67e-05 | 153 |
| GO:00301788 | Esophagus | ESCC | negative regulation of Wnt signaling pathway | 97/8552 | 170/18723 | 1.81e-03 | 8.31e-03 | 97 |
| GO:00900905 | Esophagus | ESCC | negative regulation of canonical Wnt signaling pathway | 78/8552 | 137/18723 | 5.17e-03 | 1.95e-02 | 78 |
| GO:00160556 | Lung | IAC | Wnt signaling pathway | 95/2061 | 444/18723 | 1.13e-10 | 2.80e-08 | 95 |
| GO:01987386 | Lung | IAC | cell-cell signaling by wnt | 95/2061 | 446/18723 | 1.46e-10 | 3.48e-08 | 95 |
| GO:00301116 | Lung | IAC | regulation of Wnt signaling pathway | 74/2061 | 328/18723 | 1.14e-09 | 2.05e-07 | 74 |
| GO:00608286 | Lung | IAC | regulation of canonical Wnt signaling pathway | 54/2061 | 253/18723 | 1.25e-06 | 6.46e-05 | 54 |
| GO:00600706 | Lung | IAC | canonical Wnt signaling pathway | 61/2061 | 303/18723 | 2.09e-06 | 9.45e-05 | 61 |
| GO:00301783 | Lung | IAC | negative regulation of Wnt signaling pathway | 32/2061 | 170/18723 | 1.68e-03 | 1.76e-02 | 32 |
| GO:001605512 | Lung | AIS | Wnt signaling pathway | 91/1849 | 444/18723 | 9.38e-12 | 5.47e-09 | 91 |
| GO:019873812 | Lung | AIS | cell-cell signaling by wnt | 91/1849 | 446/18723 | 1.22e-11 | 6.13e-09 | 91 |
| GO:003011112 | Lung | AIS | regulation of Wnt signaling pathway | 70/1849 | 328/18723 | 3.81e-10 | 8.87e-08 | 70 |
| GO:006082812 | Lung | AIS | regulation of canonical Wnt signaling pathway | 52/1849 | 253/18723 | 2.40e-07 | 2.22e-05 | 52 |
| GO:006007012 | Lung | AIS | canonical Wnt signaling pathway | 59/1849 | 303/18723 | 2.73e-07 | 2.37e-05 | 59 |
| GO:003017811 | Lung | AIS | negative regulation of Wnt signaling pathway | 32/1849 | 170/18723 | 2.64e-04 | 5.05e-03 | 32 |
| GO:0090090 | Lung | AIS | negative regulation of canonical Wnt signaling pathway | 24/1849 | 137/18723 | 3.91e-03 | 3.59e-02 | 24 |
| Page: 1 2 3 4 |
| Pathway ID | Tissue | Disease Stage | Description | Gene Ratio | Bg Ratio | pvalue | p.adjust | qvalue | Count |
| Page: 1 |
Top |
Cell-cell communication analysis |
| Identification of potential cell-cell interactions between two cell types and their ligand-receptor pairs for different disease states |
| Ligand | Receptor | LRpair | Pathway | Tissue | Disease Stage |
| Page: 1 |
Top |
Single-cell gene regulatory network inference analysis |
| Find out the significant the regulons (TFs) and the target genes of each regulon across cell types for different disease states |
| TF | Cell Type | Tissue | Disease Stage | Target Gene | RSS | Regulon Activity |
| ∗The dot plots of a searched regulon are shown for all cell subpopulations in each disease state of each tissue based on the regulon specific score inferred using pySCENIC and by calculating the average expression. |
| Page: 1 |
Top |
Somatic mutation of malignant transformation related genes |
| Annotation of somatic variants for genes involved in malignant transformation |
| Hugo Symbol | Variant Class | Variant Classification | dbSNP RS | HGVSc | HGVSp | HGVSp Short | SWISSPROT | BIOTYPE | SIFT | PolyPhen | Tumor Sample Barcode | Tissue | Histology | Sex | Age | Stage | Therapy Types | Drugs | Outcome |
| RBMS3 | SNV | Missense_Mutation | novel | c.254G>T | p.Gly85Val | p.G85V | Q6XE24 | protein_coding | deleterious(0) | probably_damaging(0.999) | TCGA-A2-A0CR-01 | Breast | breast invasive carcinoma | Female | <65 | I/II | Chemotherapy | adriamycin | CR |
| RBMS3 | SNV | Missense_Mutation | novel | c.812N>C | p.Ser271Thr | p.S271T | Q6XE24 | protein_coding | tolerated(0.06) | benign(0.109) | TCGA-A2-A4S1-01 | Breast | breast invasive carcinoma | Female | >=65 | I/II | Unknown | Unknown | SD |
| RBMS3 | SNV | Missense_Mutation | novel | c.520N>T | p.Asp174Tyr | p.D174Y | Q6XE24 | protein_coding | deleterious(0.03) | probably_damaging(0.984) | TCGA-AN-A046-01 | Breast | breast invasive carcinoma | Female | >=65 | I/II | Unknown | Unknown | SD |
| RBMS3 | SNV | Missense_Mutation | c.724N>T | p.Pro242Ser | p.P242S | Q6XE24 | protein_coding | tolerated(0.29) | benign(0.005) | TCGA-AN-A0AK-01 | Breast | breast invasive carcinoma | Female | >=65 | I/II | Unknown | Unknown | SD | |
| RBMS3 | SNV | Missense_Mutation | c.611N>T | p.Tyr204Phe | p.Y204F | Q6XE24 | protein_coding | tolerated(0.71) | benign(0.012) | TCGA-AN-A0FW-01 | Breast | breast invasive carcinoma | Female | >=65 | III/IV | Unknown | Unknown | SD | |
| RBMS3 | SNV | Missense_Mutation | novel | c.76N>A | p.Gln26Lys | p.Q26K | Q6XE24 | protein_coding | tolerated_low_confidence(0.4) | benign(0.01) | TCGA-PE-A5DC-01 | Breast | breast invasive carcinoma | Female | >=65 | III/IV | Unknown | Unknown | SD |
| RBMS3 | insertion | Frame_Shift_Ins | novel | c.678_679insG | p.Gln227AlafsTer30 | p.Q227Afs*30 | Q6XE24 | protein_coding | TCGA-A2-A0D2-01 | Breast | breast invasive carcinoma | Female | <65 | I/II | Chemotherapy | adriamycin | SD | ||
| RBMS3 | SNV | Missense_Mutation | c.447N>G | p.Ile149Met | p.I149M | Q6XE24 | protein_coding | tolerated(0.05) | benign(0.043) | TCGA-FU-A3HZ-01 | Cervix | cervical & endocervical cancer | Female | <65 | I/II | Chemotherapy | cisplatin | CR | |
| RBMS3 | SNV | Missense_Mutation | c.449N>A | p.Ser150Tyr | p.S150Y | Q6XE24 | protein_coding | tolerated(0.13) | benign(0.443) | TCGA-FU-A3HZ-01 | Cervix | cervical & endocervical cancer | Female | <65 | I/II | Chemotherapy | cisplatin | CR | |
| RBMS3 | SNV | Missense_Mutation | c.425T>A | p.Leu142Gln | p.L142Q | Q6XE24 | protein_coding | deleterious(0) | probably_damaging(0.999) | TCGA-AA-3693-01 | Colorectum | colon adenocarcinoma | Female | >=65 | III/IV | Unknown | Unknown | SD |
| Page: 1 2 3 4 5 6 7 |
Top |
Related drugs of malignant transformation related genes |
| Identification of chemicals and drugs interact with genes involved in malignant transfromation |
| (DGIdb 4.0) |
| Entrez ID | Symbol | Category | Interaction Types | Drug Claim Name | Drug Name | PMIDs |
| 27303 | RBMS3 | NA | Bisphosphonates |
| Page: 1 |

Copyright 2023-Present -The University of Texas Health Science Center at Houston |