
|
|||||
|
 | |
| |
| |
| |
| |
| |
|
Gene: RBMS2 |
Gene summary for RBMS2 |
| Gene information | Species | Human | Gene symbol | RBMS2 | Gene ID | 5939 |
| Gene name | RNA binding motif single stranded interacting protein 2 | |
| Gene Alias | SCR3 | |
| Cytomap | 12q13.3 | |
| Gene Type | protein-coding | GO ID | GO:0006139 | UniProtAcc | Q15434 |
Top |
Malignant transformation analysis |
| Identification of the aberrant gene expression in precancerous and cancerous lesions by comparing the gene expression of stem-like cells in diseased tissues with normal stem cells |
| Entrez ID | Symbol | Replicates | Species | Organ | Tissue | Adj P-value | Log2FC | Malignancy |
| 5939 | RBMS2 | LZE24T | Human | Esophagus | ESCC | 3.95e-04 | 2.10e-01 | 0.0596 |
| 5939 | RBMS2 | LZE6T | Human | Esophagus | ESCC | 1.14e-03 | 1.07e-01 | 0.0845 |
| 5939 | RBMS2 | P1T-E | Human | Esophagus | ESCC | 8.76e-03 | 1.03e-01 | 0.0875 |
| 5939 | RBMS2 | P2T-E | Human | Esophagus | ESCC | 5.48e-16 | 1.69e-01 | 0.1177 |
| 5939 | RBMS2 | P4T-E | Human | Esophagus | ESCC | 3.27e-04 | 6.14e-02 | 0.1323 |
| 5939 | RBMS2 | P5T-E | Human | Esophagus | ESCC | 2.31e-07 | 5.17e-02 | 0.1327 |
| 5939 | RBMS2 | P8T-E | Human | Esophagus | ESCC | 3.67e-20 | 3.23e-01 | 0.0889 |
| 5939 | RBMS2 | P9T-E | Human | Esophagus | ESCC | 9.76e-03 | 5.49e-03 | 0.1131 |
| 5939 | RBMS2 | P10T-E | Human | Esophagus | ESCC | 6.77e-14 | 8.66e-02 | 0.116 |
| 5939 | RBMS2 | P11T-E | Human | Esophagus | ESCC | 1.83e-02 | 1.56e-01 | 0.1426 |
| 5939 | RBMS2 | P12T-E | Human | Esophagus | ESCC | 5.09e-17 | 1.31e-01 | 0.1122 |
| 5939 | RBMS2 | P15T-E | Human | Esophagus | ESCC | 1.74e-02 | 1.16e-02 | 0.1149 |
| 5939 | RBMS2 | P16T-E | Human | Esophagus | ESCC | 1.19e-07 | 5.93e-03 | 0.1153 |
| 5939 | RBMS2 | P17T-E | Human | Esophagus | ESCC | 1.08e-02 | 2.48e-01 | 0.1278 |
| 5939 | RBMS2 | P19T-E | Human | Esophagus | ESCC | 7.87e-04 | 2.64e-01 | 0.1662 |
| 5939 | RBMS2 | P21T-E | Human | Esophagus | ESCC | 1.52e-09 | 1.54e-01 | 0.1617 |
| 5939 | RBMS2 | P22T-E | Human | Esophagus | ESCC | 1.29e-07 | 6.72e-02 | 0.1236 |
| 5939 | RBMS2 | P23T-E | Human | Esophagus | ESCC | 2.31e-06 | 2.42e-01 | 0.108 |
| 5939 | RBMS2 | P24T-E | Human | Esophagus | ESCC | 1.00e-09 | 1.23e-01 | 0.1287 |
| 5939 | RBMS2 | P26T-E | Human | Esophagus | ESCC | 2.90e-07 | 1.11e-01 | 0.1276 |
| Page: 1 2 3 4 |
| Tissue | Expression Dynamics | Abbreviation |
| Esophagus | 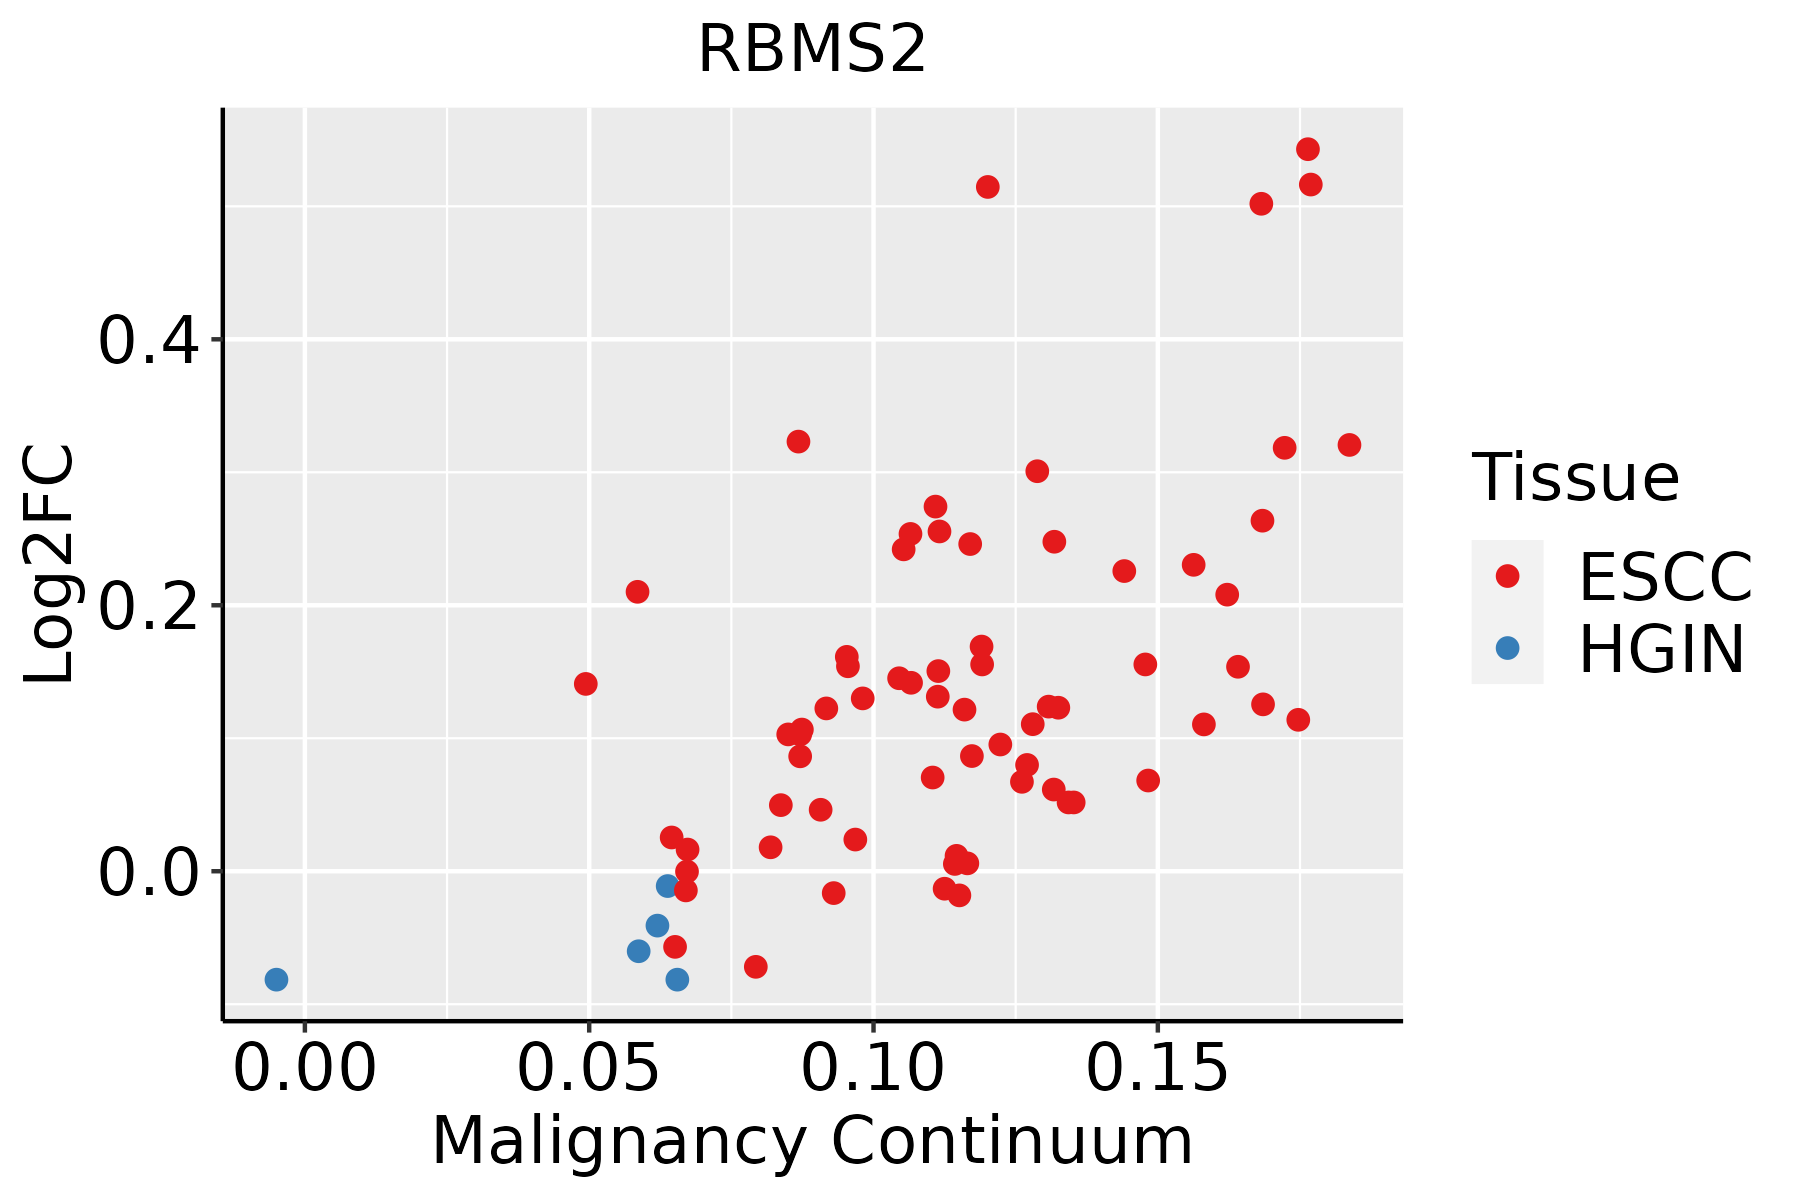 | ESCC: Esophageal squamous cell carcinoma |
| HGIN: High-grade intraepithelial neoplasias | ||
| LGIN: Low-grade intraepithelial neoplasias | ||
| Lung |  | AAH: Atypical adenomatous hyperplasia |
| AIS: Adenocarcinoma in situ | ||
| IAC: Invasive lung adenocarcinoma | ||
| MIA: Minimally invasive adenocarcinoma | ||
| Oral Cavity | 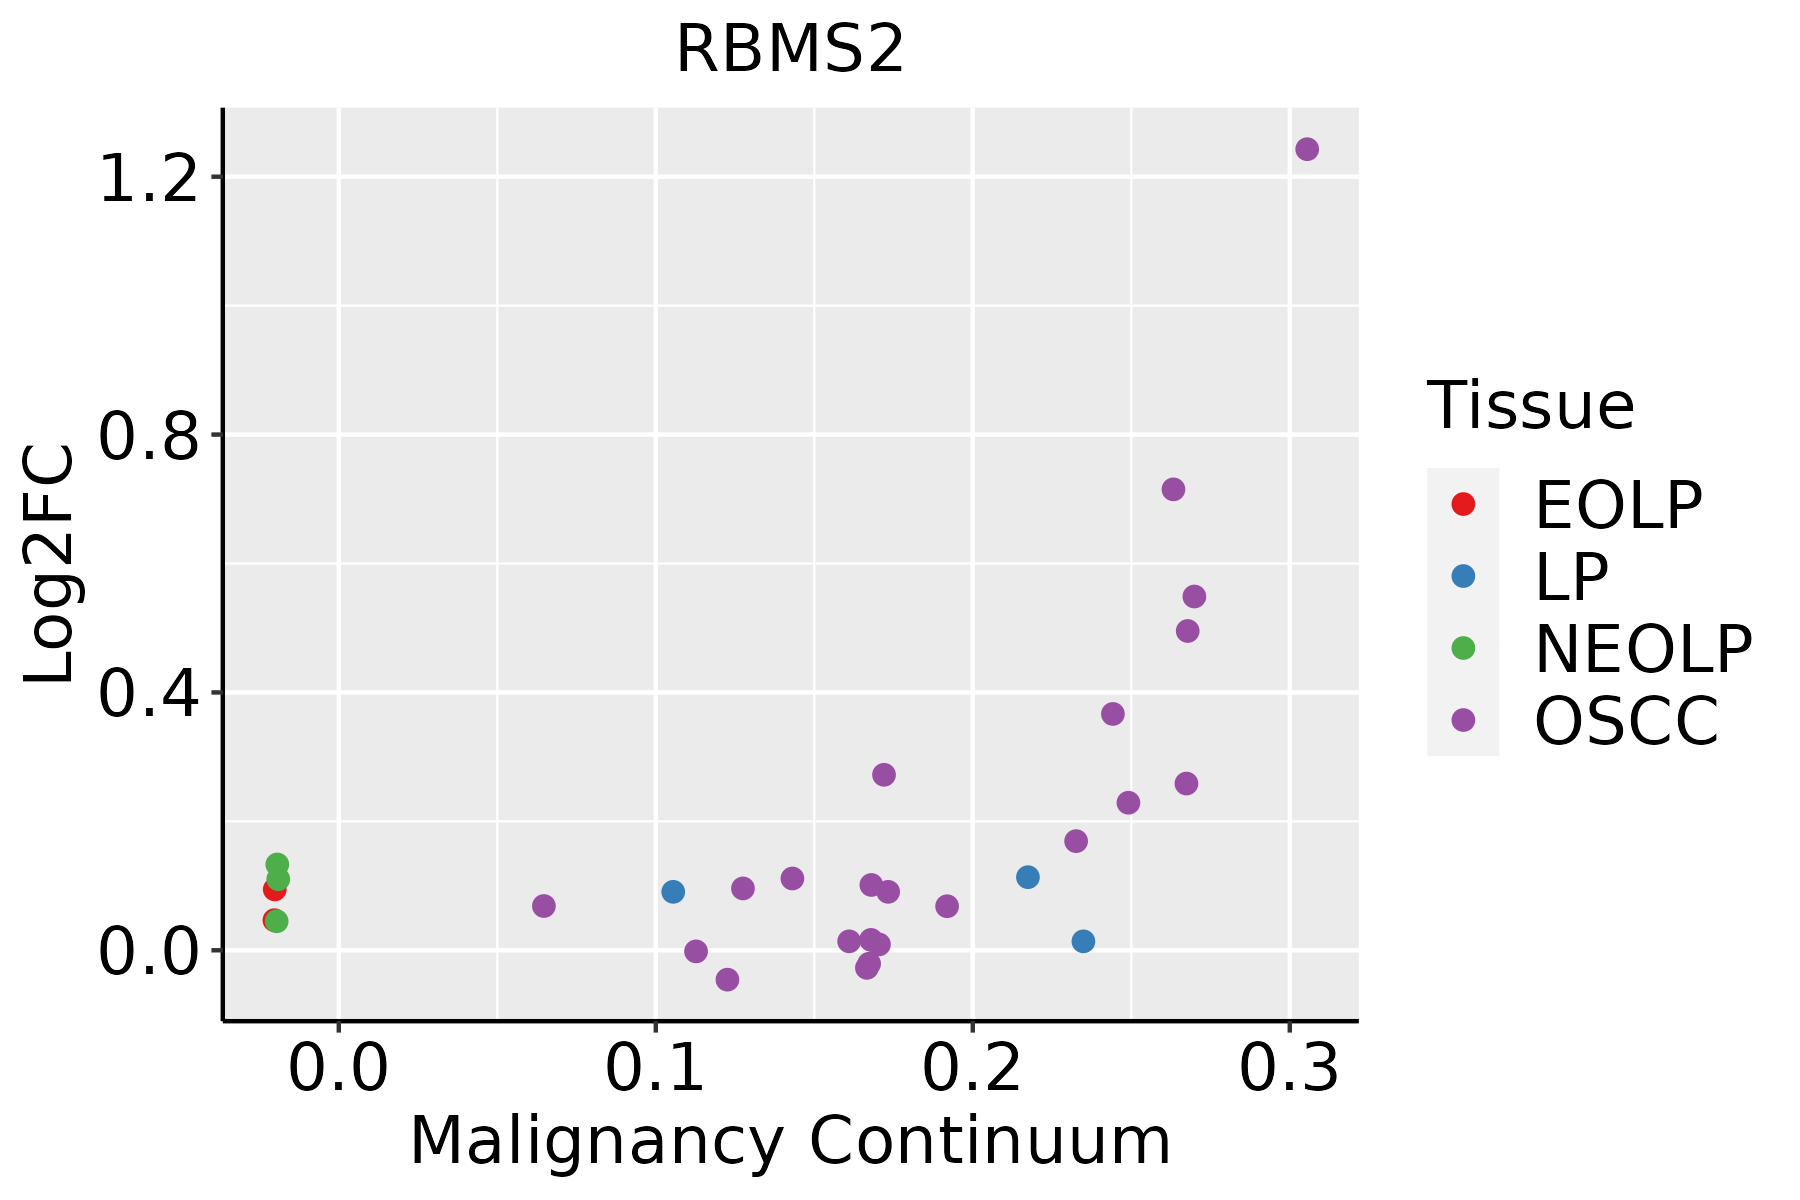 | EOLP: Erosive Oral lichen planus |
| LP: leukoplakia | ||
| NEOLP: Non-erosive oral lichen planus | ||
| OSCC: Oral squamous cell carcinoma | ||
| Thyroid | 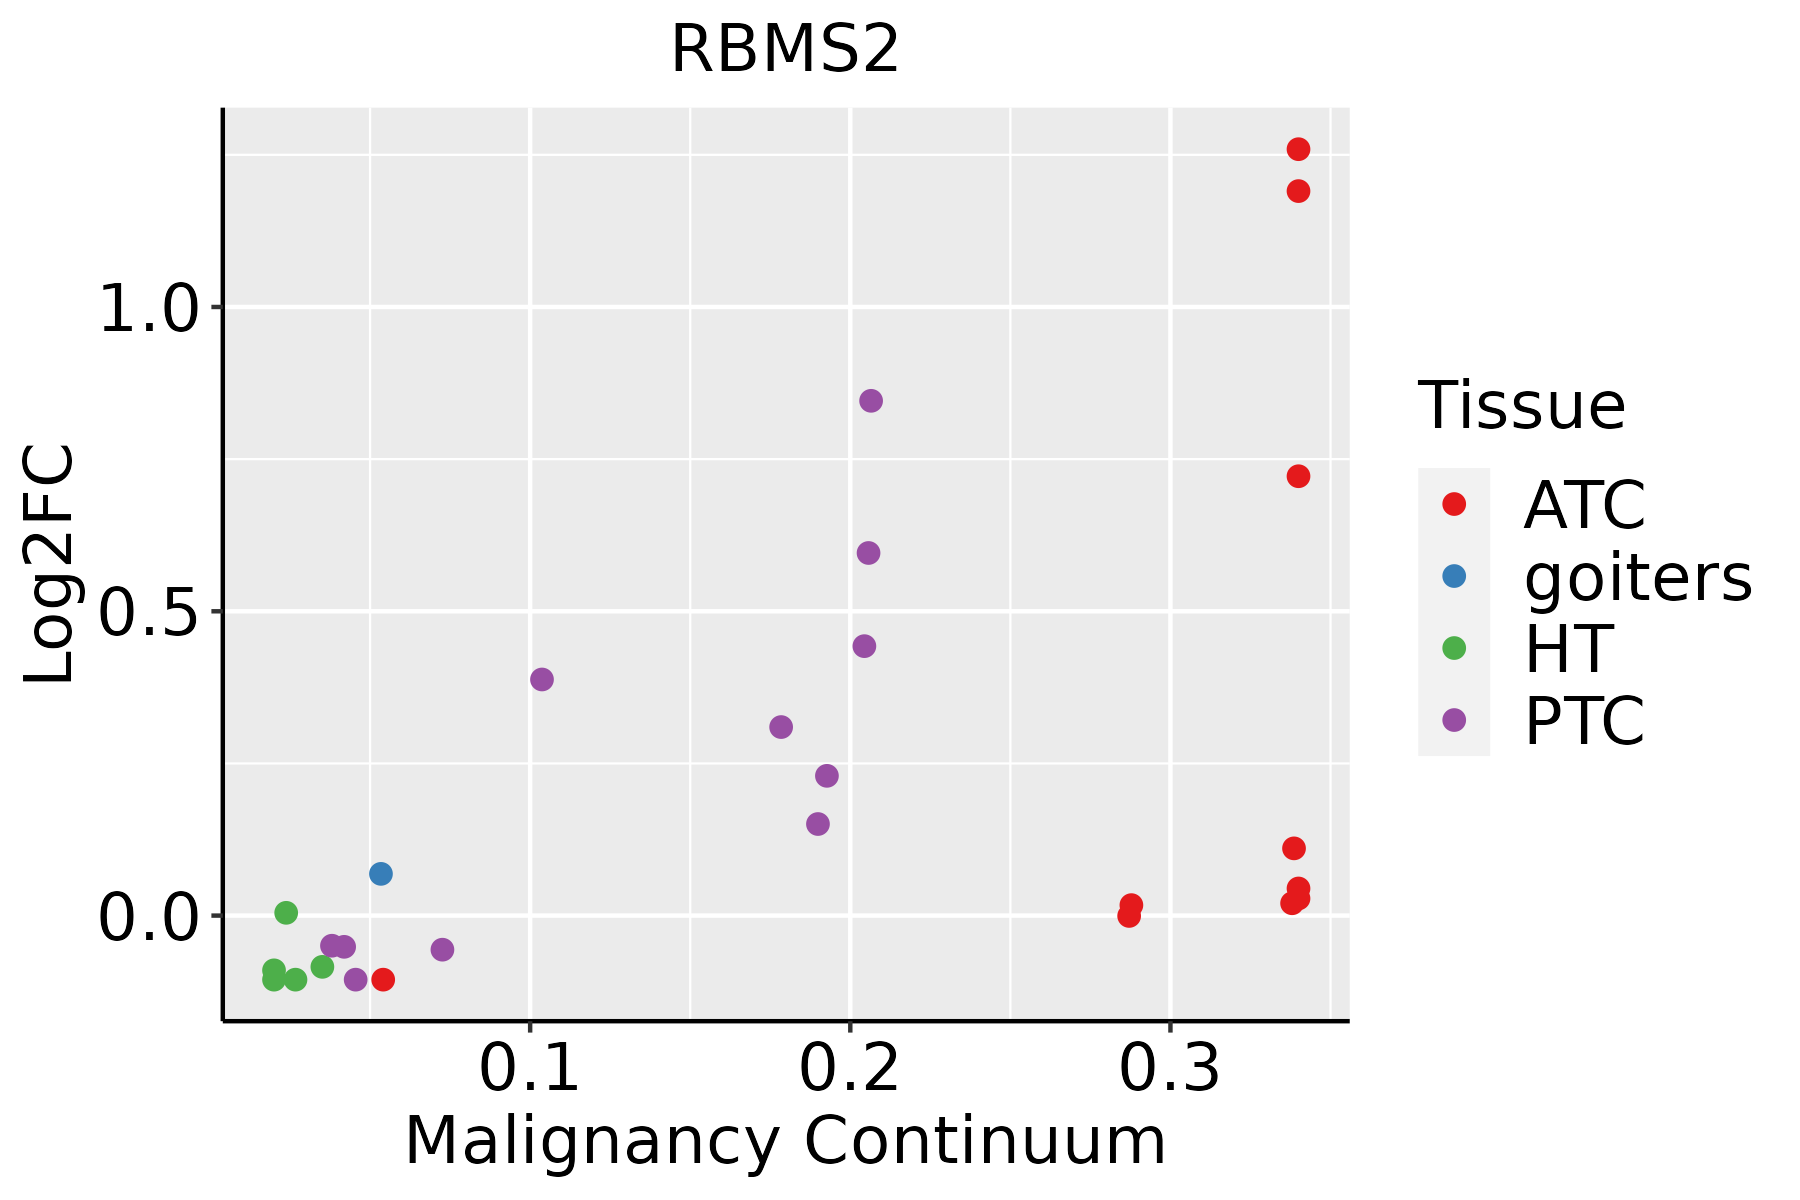 | ATC: Anaplastic thyroid cancer |
| HT: Hashimoto's thyroiditis | ||
| PTC: Papillary thyroid cancer |
| ∗log2FC in expression of this searched gene in stem-like cells from each diseased tissue sample relative to stem-like cells in normal samples in each tissue plotted against the malignancy continuum. Samples are colored based on if they are from different disease stage. |
Top |
Malignant transformation related pathway analysis |
| Find out the enriched GO biological processes and KEGG pathways involved in transition from healthy to precancer to cancer |
| Tissue | Disease Stage | Enriched GO biological Processes |
| Colorectum | AD |  |
| Colorectum | SER |  |
| Colorectum | MSS |  |
| Colorectum | MSI-H |  |
| Colorectum | FAP |  |
| ∗Top 15 enriched GO BP terms are showed in the bar plot of each disease state in each tissue. Each row represents a significant GO biological process which is colored according to the -log10(p.adjust). |
| Page: 1 2 3 4 5 6 7 8 9 |
| GO ID | Tissue | Disease Stage | Description | Gene Ratio | Bg Ratio | pvalue | p.adjust | Count |
| Page: 1 |
| Pathway ID | Tissue | Disease Stage | Description | Gene Ratio | Bg Ratio | pvalue | p.adjust | qvalue | Count |
| Page: 1 |
Top |
Cell-cell communication analysis |
| Identification of potential cell-cell interactions between two cell types and their ligand-receptor pairs for different disease states |
| Ligand | Receptor | LRpair | Pathway | Tissue | Disease Stage |
| Page: 1 |
Top |
Single-cell gene regulatory network inference analysis |
| Find out the significant the regulons (TFs) and the target genes of each regulon across cell types for different disease states |
| TF | Cell Type | Tissue | Disease Stage | Target Gene | RSS | Regulon Activity |
| ∗The dot plots of a searched regulon are shown for all cell subpopulations in each disease state of each tissue based on the regulon specific score inferred using pySCENIC and by calculating the average expression. |
| Page: 1 |
Top |
Somatic mutation of malignant transformation related genes |
| Annotation of somatic variants for genes involved in malignant transformation |
| Hugo Symbol | Variant Class | Variant Classification | dbSNP RS | HGVSc | HGVSp | HGVSp Short | SWISSPROT | BIOTYPE | SIFT | PolyPhen | Tumor Sample Barcode | Tissue | Histology | Sex | Age | Stage | Therapy Types | Drugs | Outcome |
| RBMS2 | SNV | Missense_Mutation | c.1070C>T | p.Pro357Leu | p.P357L | Q15434 | protein_coding | deleterious(0) | benign(0.304) | TCGA-EW-A1PG-01 | Breast | breast invasive carcinoma | Female | <65 | I/II | Chemotherapy | docetaxel | SD | |
| RBMS2 | deletion | Frame_Shift_Del | novel | c.806delN | p.Asn271ThrfsTer23 | p.N271Tfs*23 | Q15434 | protein_coding | TCGA-EW-A2FV-01 | Breast | breast invasive carcinoma | Female | <65 | III/IV | Chemotherapy | docetaxel | SD | ||
| RBMS2 | SNV | Missense_Mutation | novel | c.976N>A | p.Asp326Asn | p.D326N | Q15434 | protein_coding | deleterious(0) | probably_damaging(0.91) | TCGA-2W-A8YY-01 | Cervix | cervical & endocervical cancer | Female | <65 | I/II | Chemotherapy | cisplatin | CR |
| RBMS2 | SNV | Missense_Mutation | novel | c.35N>T | p.Ser12Leu | p.S12L | Q15434 | protein_coding | deleterious_low_confidence(0.01) | benign(0.017) | TCGA-VS-A958-01 | Cervix | cervical & endocervical cancer | Female | <65 | I/II | Chemotherapy | cisplatin | CR |
| RBMS2 | SNV | Missense_Mutation | c.165N>C | p.Lys55Asn | p.K55N | Q15434 | protein_coding | deleterious(0.03) | possibly_damaging(0.756) | TCGA-AA-A00N-01 | Colorectum | colon adenocarcinoma | Male | >=65 | I/II | Unknown | Unknown | PD | |
| RBMS2 | SNV | Missense_Mutation | novel | c.878T>G | p.Val293Gly | p.V293G | Q15434 | protein_coding | tolerated(0.33) | benign(0.005) | TCGA-AA-A029-01 | Colorectum | colon adenocarcinoma | Male | >=65 | I/II | Unknown | Unknown | SD |
| RBMS2 | SNV | Missense_Mutation | rs376730098 | c.706C>T | p.Arg236Trp | p.R236W | Q15434 | protein_coding | deleterious(0) | benign(0.189) | TCGA-AZ-4313-01 | Colorectum | colon adenocarcinoma | Female | <65 | I/II | Unknown | Unknown | SD |
| RBMS2 | SNV | Missense_Mutation | novel | c.211N>T | p.Asp71Tyr | p.D71Y | Q15434 | protein_coding | deleterious(0) | probably_damaging(0.93) | TCGA-AZ-4315-01 | Colorectum | colon adenocarcinoma | Male | <65 | I/II | Unknown | Unknown | SD |
| RBMS2 | SNV | Missense_Mutation | novel | c.1127N>T | p.Ser376Phe | p.S376F | Q15434 | protein_coding | deleterious(0) | possibly_damaging(0.707) | TCGA-AZ-4315-01 | Colorectum | colon adenocarcinoma | Male | <65 | I/II | Unknown | Unknown | SD |
| RBMS2 | SNV | Missense_Mutation | c.1180N>A | p.Ala394Thr | p.A394T | Q15434 | protein_coding | tolerated_low_confidence(1) | benign(0) | TCGA-D5-6928-01 | Colorectum | colon adenocarcinoma | Male | >=65 | I/II | Unknown | Unknown | SD |
| Page: 1 2 3 4 5 |
Top |
Related drugs of malignant transformation related genes |
| Identification of chemicals and drugs interact with genes involved in malignant transfromation |
| (DGIdb 4.0) |
| Entrez ID | Symbol | Category | Interaction Types | Drug Claim Name | Drug Name | PMIDs |
| Page: 1 |

Copyright 2023-Present -The University of Texas Health Science Center at Houston |