
|
|||||
|
 | |
| |
| |
| |
| |
| |
|
Gene: RBM7 |
Gene summary for RBM7 |
| Gene information | Species | Human | Gene symbol | RBM7 | Gene ID | 10179 |
| Gene name | RNA binding motif protein 7 | |
| Gene Alias | RBM7 | |
| Cytomap | 11q23.2 | |
| Gene Type | protein-coding | GO ID | GO:0000003 | UniProtAcc | J3KPD3 |
Top |
Malignant transformation analysis |
| Identification of the aberrant gene expression in precancerous and cancerous lesions by comparing the gene expression of stem-like cells in diseased tissues with normal stem cells |
| Entrez ID | Symbol | Replicates | Species | Organ | Tissue | Adj P-value | Log2FC | Malignancy |
| 10179 | RBM7 | LZE4T | Human | Esophagus | ESCC | 4.16e-12 | 3.00e-01 | 0.0811 |
| 10179 | RBM7 | LZE8T | Human | Esophagus | ESCC | 9.08e-10 | 5.39e-02 | 0.067 |
| 10179 | RBM7 | LZE20T | Human | Esophagus | ESCC | 1.01e-05 | 1.71e-01 | 0.0662 |
| 10179 | RBM7 | LZE24T | Human | Esophagus | ESCC | 4.49e-22 | 8.26e-01 | 0.0596 |
| 10179 | RBM7 | P1T-E | Human | Esophagus | ESCC | 1.11e-05 | 1.05e-01 | 0.0875 |
| 10179 | RBM7 | P2T-E | Human | Esophagus | ESCC | 6.97e-21 | 3.18e-01 | 0.1177 |
| 10179 | RBM7 | P4T-E | Human | Esophagus | ESCC | 5.99e-36 | 9.25e-01 | 0.1323 |
| 10179 | RBM7 | P5T-E | Human | Esophagus | ESCC | 5.01e-19 | 3.79e-01 | 0.1327 |
| 10179 | RBM7 | P8T-E | Human | Esophagus | ESCC | 3.10e-07 | 1.98e-01 | 0.0889 |
| 10179 | RBM7 | P9T-E | Human | Esophagus | ESCC | 8.70e-13 | 3.21e-01 | 0.1131 |
| 10179 | RBM7 | P10T-E | Human | Esophagus | ESCC | 2.13e-21 | 2.86e-01 | 0.116 |
| 10179 | RBM7 | P11T-E | Human | Esophagus | ESCC | 1.06e-11 | 6.75e-01 | 0.1426 |
| 10179 | RBM7 | P12T-E | Human | Esophagus | ESCC | 5.19e-23 | 5.26e-01 | 0.1122 |
| 10179 | RBM7 | P15T-E | Human | Esophagus | ESCC | 1.51e-11 | 2.82e-01 | 0.1149 |
| 10179 | RBM7 | P16T-E | Human | Esophagus | ESCC | 3.16e-17 | 3.36e-01 | 0.1153 |
| 10179 | RBM7 | P17T-E | Human | Esophagus | ESCC | 2.63e-07 | 3.32e-01 | 0.1278 |
| 10179 | RBM7 | P19T-E | Human | Esophagus | ESCC | 1.47e-02 | 4.33e-01 | 0.1662 |
| 10179 | RBM7 | P20T-E | Human | Esophagus | ESCC | 7.55e-17 | 2.32e-01 | 0.1124 |
| 10179 | RBM7 | P21T-E | Human | Esophagus | ESCC | 1.08e-23 | 5.96e-01 | 0.1617 |
| 10179 | RBM7 | P22T-E | Human | Esophagus | ESCC | 1.22e-08 | 1.05e-01 | 0.1236 |
| Page: 1 2 3 4 |
| Tissue | Expression Dynamics | Abbreviation |
| Esophagus |  | ESCC: Esophageal squamous cell carcinoma |
| HGIN: High-grade intraepithelial neoplasias | ||
| LGIN: Low-grade intraepithelial neoplasias | ||
| Oral Cavity | 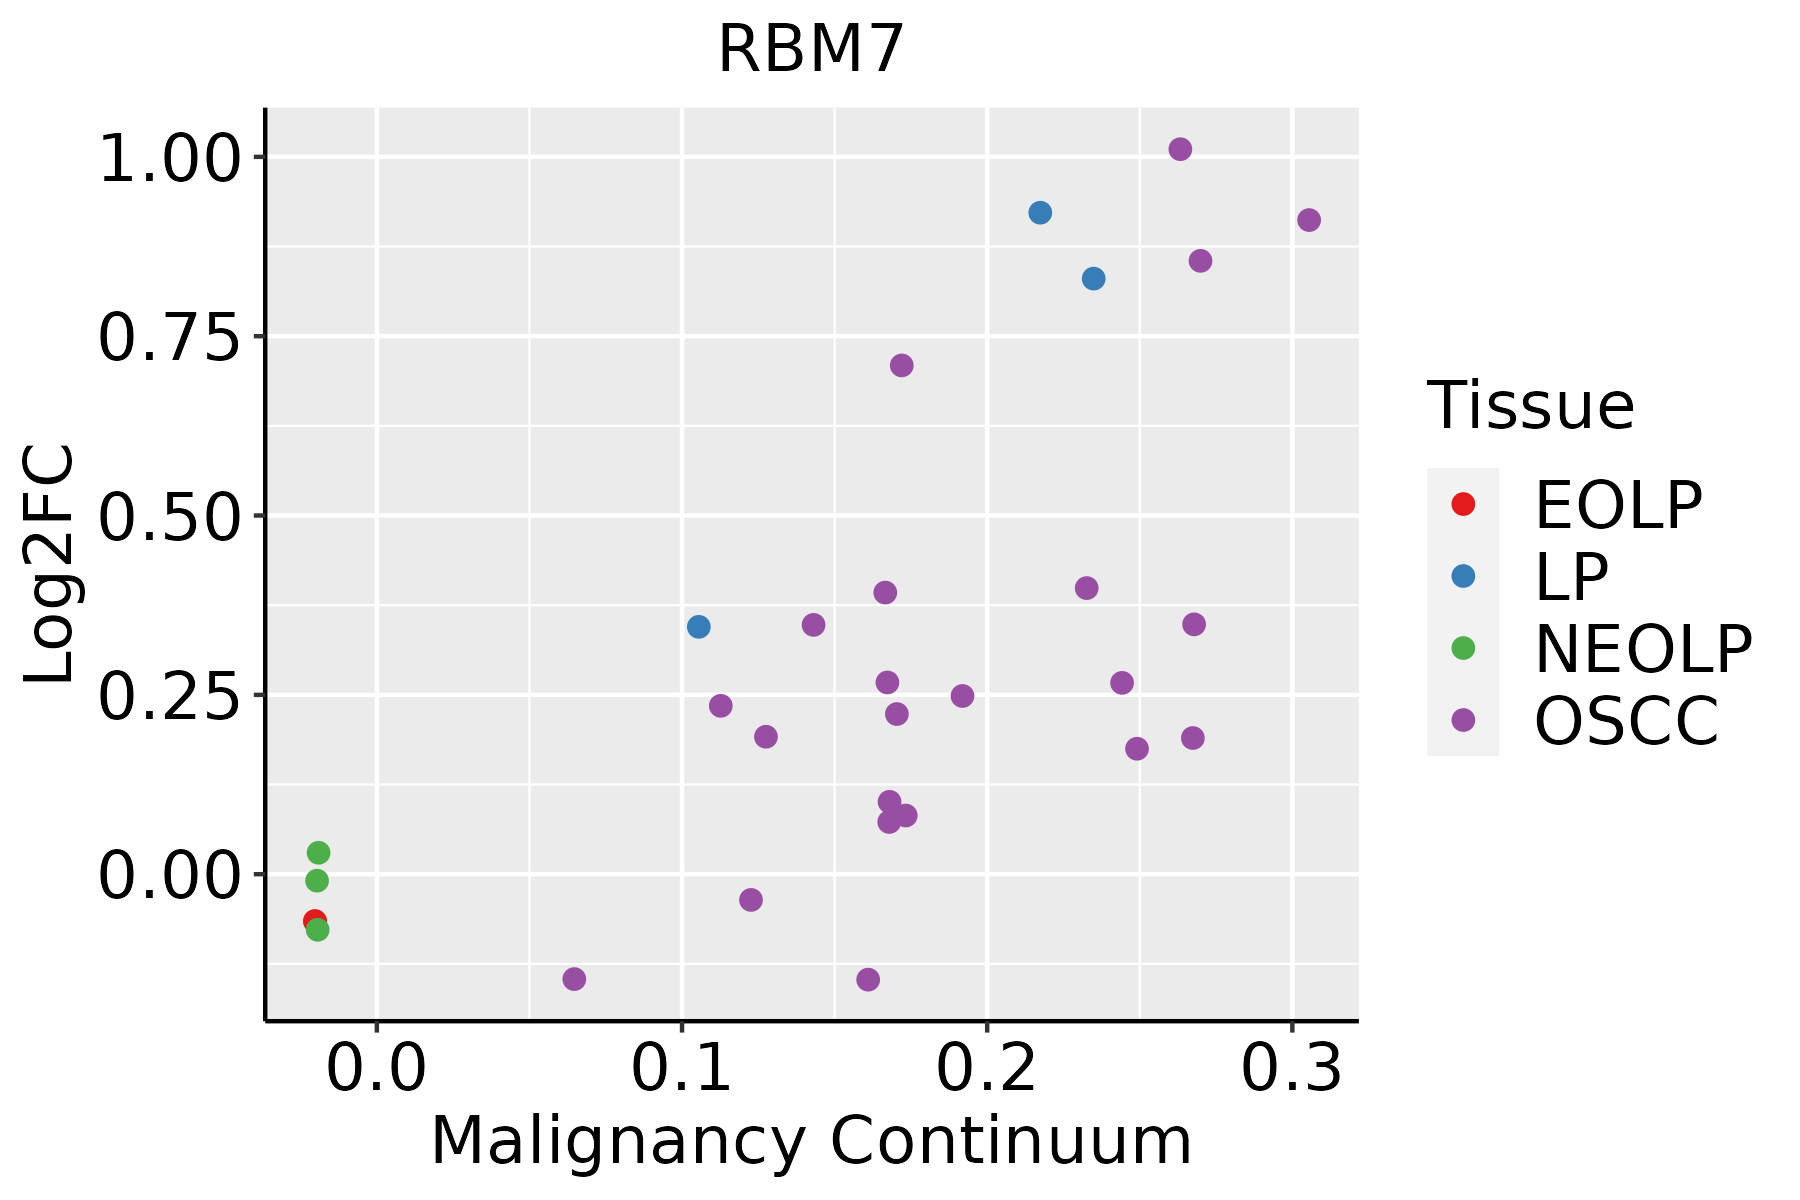 | EOLP: Erosive Oral lichen planus |
| LP: leukoplakia | ||
| NEOLP: Non-erosive oral lichen planus | ||
| OSCC: Oral squamous cell carcinoma |
| ∗log2FC in expression of this searched gene in stem-like cells from each diseased tissue sample relative to stem-like cells in normal samples in each tissue plotted against the malignancy continuum. Samples are colored based on if they are from different disease stage. |
Top |
Malignant transformation related pathway analysis |
| Find out the enriched GO biological processes and KEGG pathways involved in transition from healthy to precancer to cancer |
| Tissue | Disease Stage | Enriched GO biological Processes |
| Colorectum | AD |  |
| Colorectum | SER |  |
| Colorectum | MSS |  |
| Colorectum | MSI-H |  |
| Colorectum | FAP |  |
| ∗Top 15 enriched GO BP terms are showed in the bar plot of each disease state in each tissue. Each row represents a significant GO biological process which is colored according to the -log10(p.adjust). |
| Page: 1 2 3 4 5 6 7 8 9 |
| GO ID | Tissue | Disease Stage | Description | Gene Ratio | Bg Ratio | pvalue | p.adjust | Count |
| GO:0008380111 | Esophagus | ESCC | RNA splicing | 336/8552 | 434/18723 | 1.74e-42 | 3.67e-39 | 336 |
| GO:003466012 | Esophagus | ESCC | ncRNA metabolic process | 346/8552 | 485/18723 | 4.35e-31 | 2.51e-28 | 346 |
| GO:0000375111 | Esophagus | ESCC | RNA splicing, via transesterification reactions | 248/8552 | 324/18723 | 3.05e-30 | 1.49e-27 | 248 |
| GO:0000377111 | Esophagus | ESCC | RNA splicing, via transesterification reactions with bulged adenosine as nucleophile | 244/8552 | 320/18723 | 2.52e-29 | 1.07e-26 | 244 |
| GO:0000398111 | Esophagus | ESCC | mRNA splicing, via spliceosome | 244/8552 | 320/18723 | 2.52e-29 | 1.07e-26 | 244 |
| GO:1903311110 | Esophagus | ESCC | regulation of mRNA metabolic process | 210/8552 | 288/18723 | 3.25e-21 | 5.56e-19 | 210 |
| GO:0006401110 | Esophagus | ESCC | RNA catabolic process | 204/8552 | 278/18723 | 3.39e-21 | 5.66e-19 | 204 |
| GO:0034655110 | Esophagus | ESCC | nucleobase-containing compound catabolic process | 272/8552 | 407/18723 | 2.92e-18 | 2.90e-16 | 272 |
| GO:0043484111 | Esophagus | ESCC | regulation of RNA splicing | 116/8552 | 148/18723 | 3.18e-16 | 2.38e-14 | 116 |
| GO:0050684110 | Esophagus | ESCC | regulation of mRNA processing | 109/8552 | 137/18723 | 3.51e-16 | 2.59e-14 | 109 |
| GO:004670018 | Esophagus | ESCC | heterocycle catabolic process | 286/8552 | 445/18723 | 1.12e-15 | 7.47e-14 | 286 |
| GO:004427019 | Esophagus | ESCC | cellular nitrogen compound catabolic process | 288/8552 | 451/18723 | 3.03e-15 | 1.79e-13 | 288 |
| GO:001943918 | Esophagus | ESCC | aromatic compound catabolic process | 295/8552 | 467/18723 | 1.09e-14 | 5.98e-13 | 295 |
| GO:190136118 | Esophagus | ESCC | organic cyclic compound catabolic process | 307/8552 | 495/18723 | 9.99e-14 | 4.80e-12 | 307 |
| GO:0048024111 | Esophagus | ESCC | regulation of mRNA splicing, via spliceosome | 78/8552 | 101/18723 | 8.72e-11 | 2.66e-09 | 78 |
| GO:000038019 | Esophagus | ESCC | alternative mRNA splicing, via spliceosome | 55/8552 | 77/18723 | 4.07e-06 | 4.38e-05 | 55 |
| GO:00346613 | Esophagus | ESCC | ncRNA catabolic process | 33/8552 | 43/18723 | 3.25e-05 | 2.69e-04 | 33 |
| GO:000038119 | Esophagus | ESCC | regulation of alternative mRNA splicing, via spliceosome | 40/8552 | 60/18723 | 8.30e-04 | 4.28e-03 | 40 |
| GO:000838020 | Oral cavity | OSCC | RNA splicing | 308/7305 | 434/18723 | 2.43e-42 | 7.70e-39 | 308 |
| GO:000037519 | Oral cavity | OSCC | RNA splicing, via transesterification reactions | 225/7305 | 324/18723 | 5.20e-29 | 2.99e-26 | 225 |
| Page: 1 2 3 |
| Pathway ID | Tissue | Disease Stage | Description | Gene Ratio | Bg Ratio | pvalue | p.adjust | qvalue | Count |
| Page: 1 |
Top |
Cell-cell communication analysis |
| Identification of potential cell-cell interactions between two cell types and their ligand-receptor pairs for different disease states |
| Ligand | Receptor | LRpair | Pathway | Tissue | Disease Stage |
| Page: 1 |
Top |
Single-cell gene regulatory network inference analysis |
| Find out the significant the regulons (TFs) and the target genes of each regulon across cell types for different disease states |
| TF | Cell Type | Tissue | Disease Stage | Target Gene | RSS | Regulon Activity |
| ∗The dot plots of a searched regulon are shown for all cell subpopulations in each disease state of each tissue based on the regulon specific score inferred using pySCENIC and by calculating the average expression. |
| Page: 1 |
Top |
Somatic mutation of malignant transformation related genes |
| Annotation of somatic variants for genes involved in malignant transformation |
| Hugo Symbol | Variant Class | Variant Classification | dbSNP RS | HGVSc | HGVSp | HGVSp Short | SWISSPROT | BIOTYPE | SIFT | PolyPhen | Tumor Sample Barcode | Tissue | Histology | Sex | Age | Stage | Therapy Types | Drugs | Outcome |
| RBM7 | SNV | Missense_Mutation | c.783N>C | p.Lys261Asn | p.K261N | protein_coding | deleterious(0) | probably_damaging(0.959) | TCGA-FU-A3HZ-01 | Cervix | cervical & endocervical cancer | Female | <65 | I/II | Chemotherapy | cisplatin | CR | ||
| RBM7 | SNV | Missense_Mutation | novel | c.146N>T | p.Pro49Leu | p.P49L | protein_coding | deleterious(0.04) | benign(0.012) | TCGA-MA-AA42-01 | Cervix | cervical & endocervical cancer | Female | >=65 | I/II | Unknown | Unknown | SD | |
| RBM7 | SNV | Missense_Mutation | rs772778246 | c.596G>A | p.Arg199His | p.R199H | protein_coding | tolerated(0.09) | benign(0.069) | TCGA-AA-3837-01 | Colorectum | colon adenocarcinoma | Male | >=65 | I/II | Unknown | Unknown | SD | |
| RBM7 | SNV | Missense_Mutation | c.614C>A | p.Ser205Tyr | p.S205Y | protein_coding | deleterious(0) | probably_damaging(0.967) | TCGA-AA-A00N-01 | Colorectum | colon adenocarcinoma | Male | >=65 | I/II | Unknown | Unknown | PD | ||
| RBM7 | SNV | Missense_Mutation | rs752632231 | c.416N>T | p.Pro139Leu | p.P139L | protein_coding | deleterious(0.02) | benign(0.169) | TCGA-CI-6622-01 | Colorectum | rectum adenocarcinoma | Male | >=65 | I/II | Chemotherapy | 5-fluorouracil | SD | |
| RBM7 | SNV | Missense_Mutation | novel | c.659A>G | p.Tyr220Cys | p.Y220C | protein_coding | deleterious(0.02) | possibly_damaging(0.873) | TCGA-F5-6814-01 | Colorectum | rectum adenocarcinoma | Male | <65 | I/II | Unknown | Unknown | SD | |
| RBM7 | SNV | Missense_Mutation | novel | c.649N>A | p.Glu217Lys | p.E217K | protein_coding | deleterious(0) | possibly_damaging(0.686) | TCGA-A5-A0G2-01 | Endometrium | uterine corpus endometrioid carcinoma | Female | <65 | III/IV | Unknown | Unknown | SD | |
| RBM7 | SNV | Missense_Mutation | rs772286712 | c.656N>A | p.Arg219His | p.R219H | protein_coding | tolerated(0.1) | benign(0.007) | TCGA-A5-A2K3-01 | Endometrium | uterine corpus endometrioid carcinoma | Female | >=65 | I/II | Chemotherapy | carboplatin | SD | |
| RBM7 | SNV | Missense_Mutation | rs772778246 | c.596G>A | p.Arg199His | p.R199H | protein_coding | tolerated(0.09) | benign(0.069) | TCGA-AJ-A3BH-01 | Endometrium | uterine corpus endometrioid carcinoma | Female | Unknown | I/II | Unknown | Unknown | SD | |
| RBM7 | SNV | Missense_Mutation | rs199909173 | c.797G>A | p.Arg266Gln | p.R266Q | protein_coding | deleterious(0) | probably_damaging(1) | TCGA-AP-A0LM-01 | Endometrium | uterine corpus endometrioid carcinoma | Female | <65 | III/IV | Chemotherapy | cisplatin | SD |
| Page: 1 2 3 |
Top |
Related drugs of malignant transformation related genes |
| Identification of chemicals and drugs interact with genes involved in malignant transfromation |
| (DGIdb 4.0) |
| Entrez ID | Symbol | Category | Interaction Types | Drug Claim Name | Drug Name | PMIDs |
| Page: 1 |

Copyright 2023-Present -The University of Texas Health Science Center at Houston |