Schematic overview of the cellular and molecular mechanisms involved in the cancer progression, including the proposed cellular and molecular mechanisms in cancer cells trajectory. AT1: alveolar type 1 cells; AT2: alveolar type 2 cells; AAH: atypical adenomatous hyperplasia; AIS: adenocarcinoma in situ; MIA: minimally invasive adenocarcinoma; IA: invasive adenocarcinoma; EMT: epithelial-mesenchymal transition

Home

Download

Statistics

Help

Contact

Center for Computational Systems Medicine
leaf

Gene summary

leaf

Malignant transformation analysis

leaf

Malignant transformation related pathway analysis

leaf

Cell-cell communication analysis

leaf

Single-cell gene regulatory network inference analysis

leaf

Somatic mutation of malignant transformation related genes

leaf

Related drugs of malignant transformation related genes

Gene: RBM5

Gene summary for RBM5

check button Gene summary.

Gene informationSpeciesHuman
Gene symbol

RBM5

Gene ID

10181

Gene nameRNA binding motif protein 5
Gene AliasG15
Cytomap3p21.31
Gene Typeprotein-coding
GO ID

GO:0000245

UniProtAcc

A0A024R2U6


Top

Malignant transformation analysis

check button Identification of the aberrant gene expression in precancerous and cancerous lesions by comparing the gene expression of stem-like cells in diseased tissues with normal stem cells
check button Malignant transformation involving gene list.
Entrez IDSymbolReplicatesSpeciesOrganTissueAdj P-valueLog2FCMalignancy
10181RBM5LZE4THumanEsophagusESCC2.79e-254.32e-010.0811
10181RBM5LZE5THumanEsophagusESCC4.30e-103.52e-010.0514
10181RBM5LZE7THumanEsophagusESCC1.19e-092.77e-010.0667
10181RBM5LZE8THumanEsophagusESCC1.48e-077.36e-020.067
10181RBM5LZE20THumanEsophagusESCC2.95e-051.02e-010.0662
10181RBM5LZE21D1HumanEsophagusHGIN6.42e-055.66e-010.0632
10181RBM5LZE22THumanEsophagusESCC6.63e-083.03e-010.068
10181RBM5LZE24THumanEsophagusESCC2.17e-182.71e-010.0596
10181RBM5LZE21THumanEsophagusESCC8.87e-059.24e-020.0655
10181RBM5P1T-EHumanEsophagusESCC1.42e-042.10e-010.0875
10181RBM5P2T-EHumanEsophagusESCC7.24e-282.26e-010.1177
10181RBM5P4T-EHumanEsophagusESCC1.37e-132.43e-010.1323
10181RBM5P5T-EHumanEsophagusESCC8.73e-191.14e-010.1327
10181RBM5P8T-EHumanEsophagusESCC1.39e-272.96e-010.0889
10181RBM5P9T-EHumanEsophagusESCC4.95e-202.75e-010.1131
10181RBM5P10T-EHumanEsophagusESCC1.25e-213.50e-010.116
10181RBM5P11T-EHumanEsophagusESCC4.19e-093.77e-010.1426
10181RBM5P12T-EHumanEsophagusESCC6.09e-224.72e-010.1122
10181RBM5P15T-EHumanEsophagusESCC1.59e-192.68e-010.1149
10181RBM5P16T-EHumanEsophagusESCC1.76e-212.80e-010.1153
Page: 1 2 3 4 5 6 7 

check button Transcriptomic changes along malignancy continuum.
TissueExpression DynamicsAbbreviation
EsophagusThe image shows the transcriptomic changes along malignancy continuum.log2FC in expression of this searched gene in stem-like cells from each diseased tissue sample relative to stem-like cells in normal samples in each tissue plotted against the malignancy continuum. Samples are colored based on if they are from different disease stage.ESCC: Esophageal squamous cell carcinoma
HGIN: High-grade intraepithelial neoplasias
LGIN: Low-grade intraepithelial neoplasias
LiverThe image shows the transcriptomic changes along malignancy continuum.log2FC in expression of this searched gene in stem-like cells from each diseased tissue sample relative to stem-like cells in normal samples in each tissue plotted against the malignancy continuum. Samples are colored based on if they are from different disease stage.
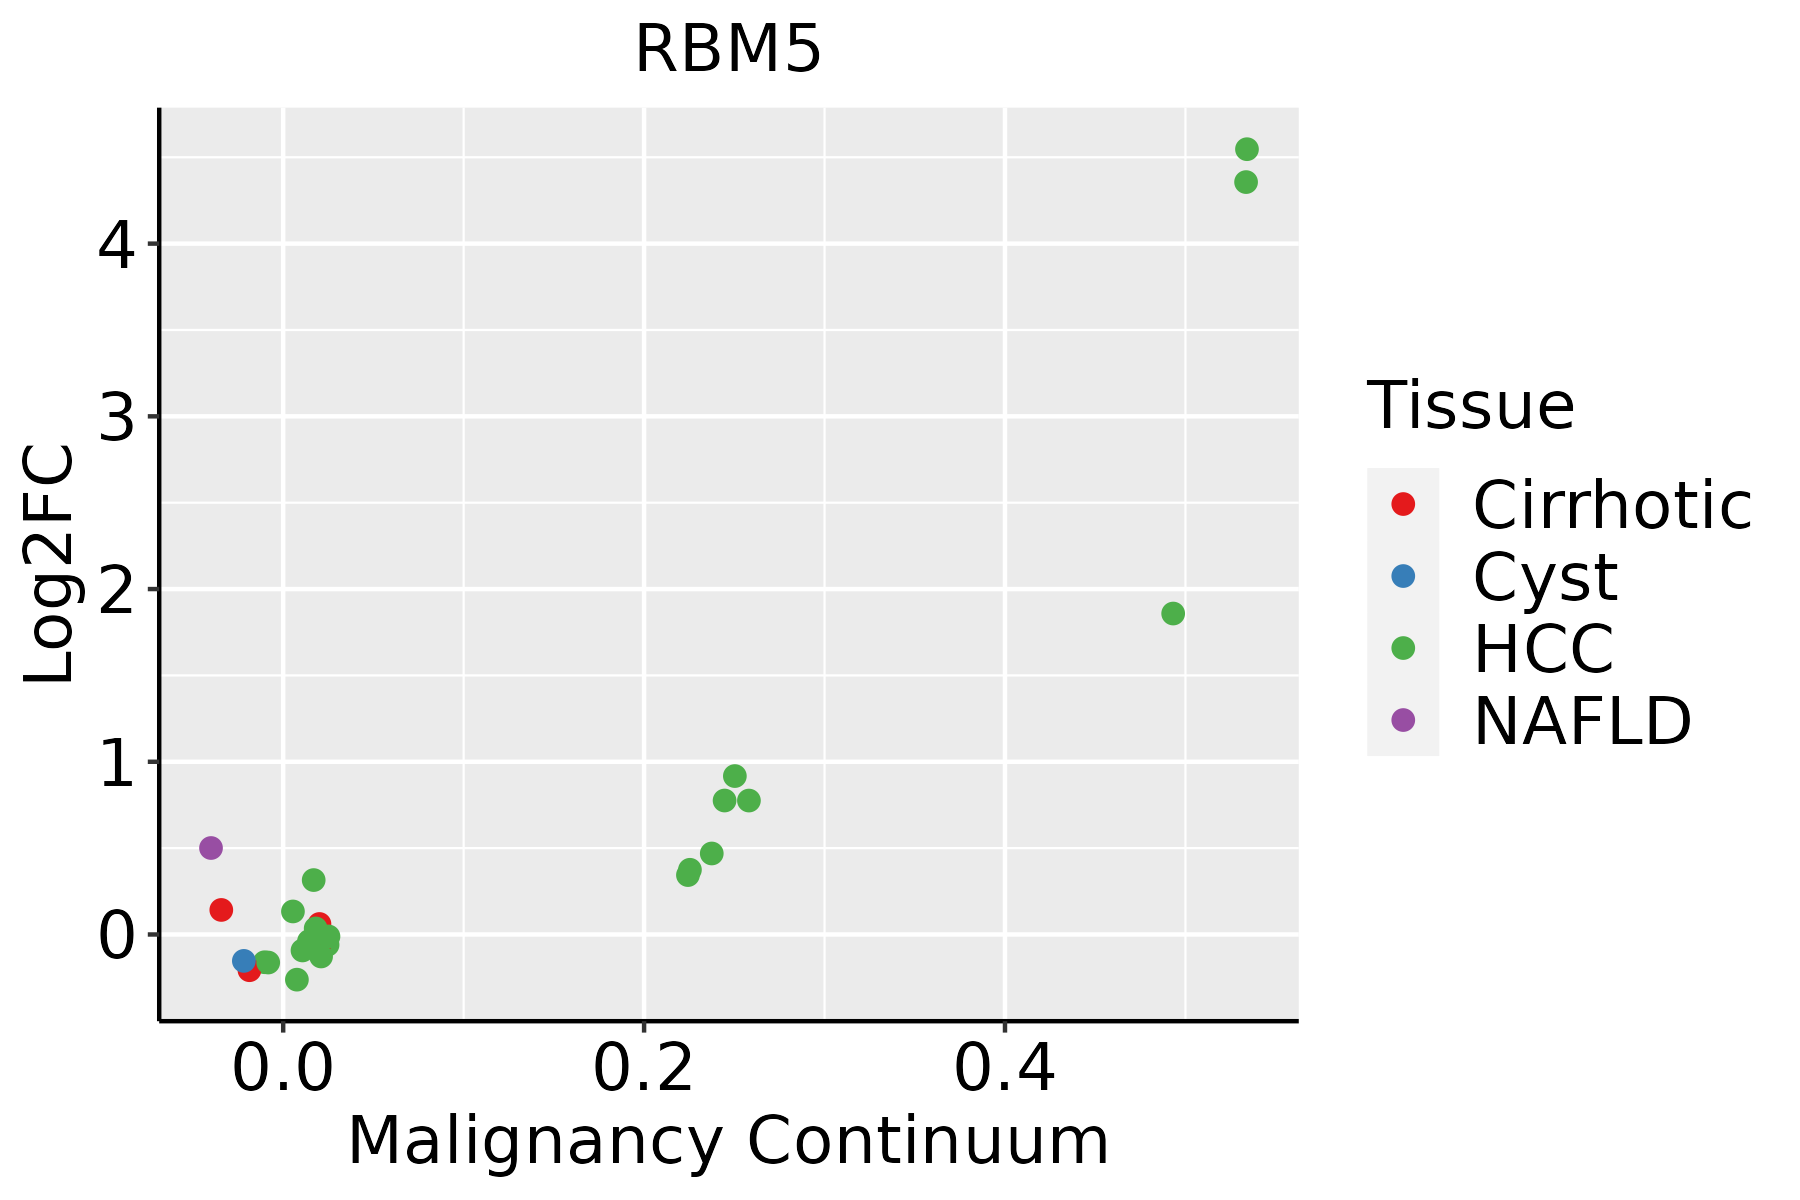
HCC: Hepatocellular carcinoma
NAFLD: Non-alcoholic fatty liver disease
Oral CavityThe image shows the transcriptomic changes along malignancy continuum.log2FC in expression of this searched gene in stem-like cells from each diseased tissue sample relative to stem-like cells in normal samples in each tissue plotted against the malignancy continuum. Samples are colored based on if they are from different disease stage.EOLP: Erosive Oral lichen planus
LP: leukoplakia
NEOLP: Non-erosive oral lichen planus
OSCC: Oral squamous cell carcinoma
ProstateThe image shows the transcriptomic changes along malignancy continuum.log2FC in expression of this searched gene in stem-like cells from each diseased tissue sample relative to stem-like cells in normal samples in each tissue plotted against the malignancy continuum. Samples are colored based on if they are from different disease stage.
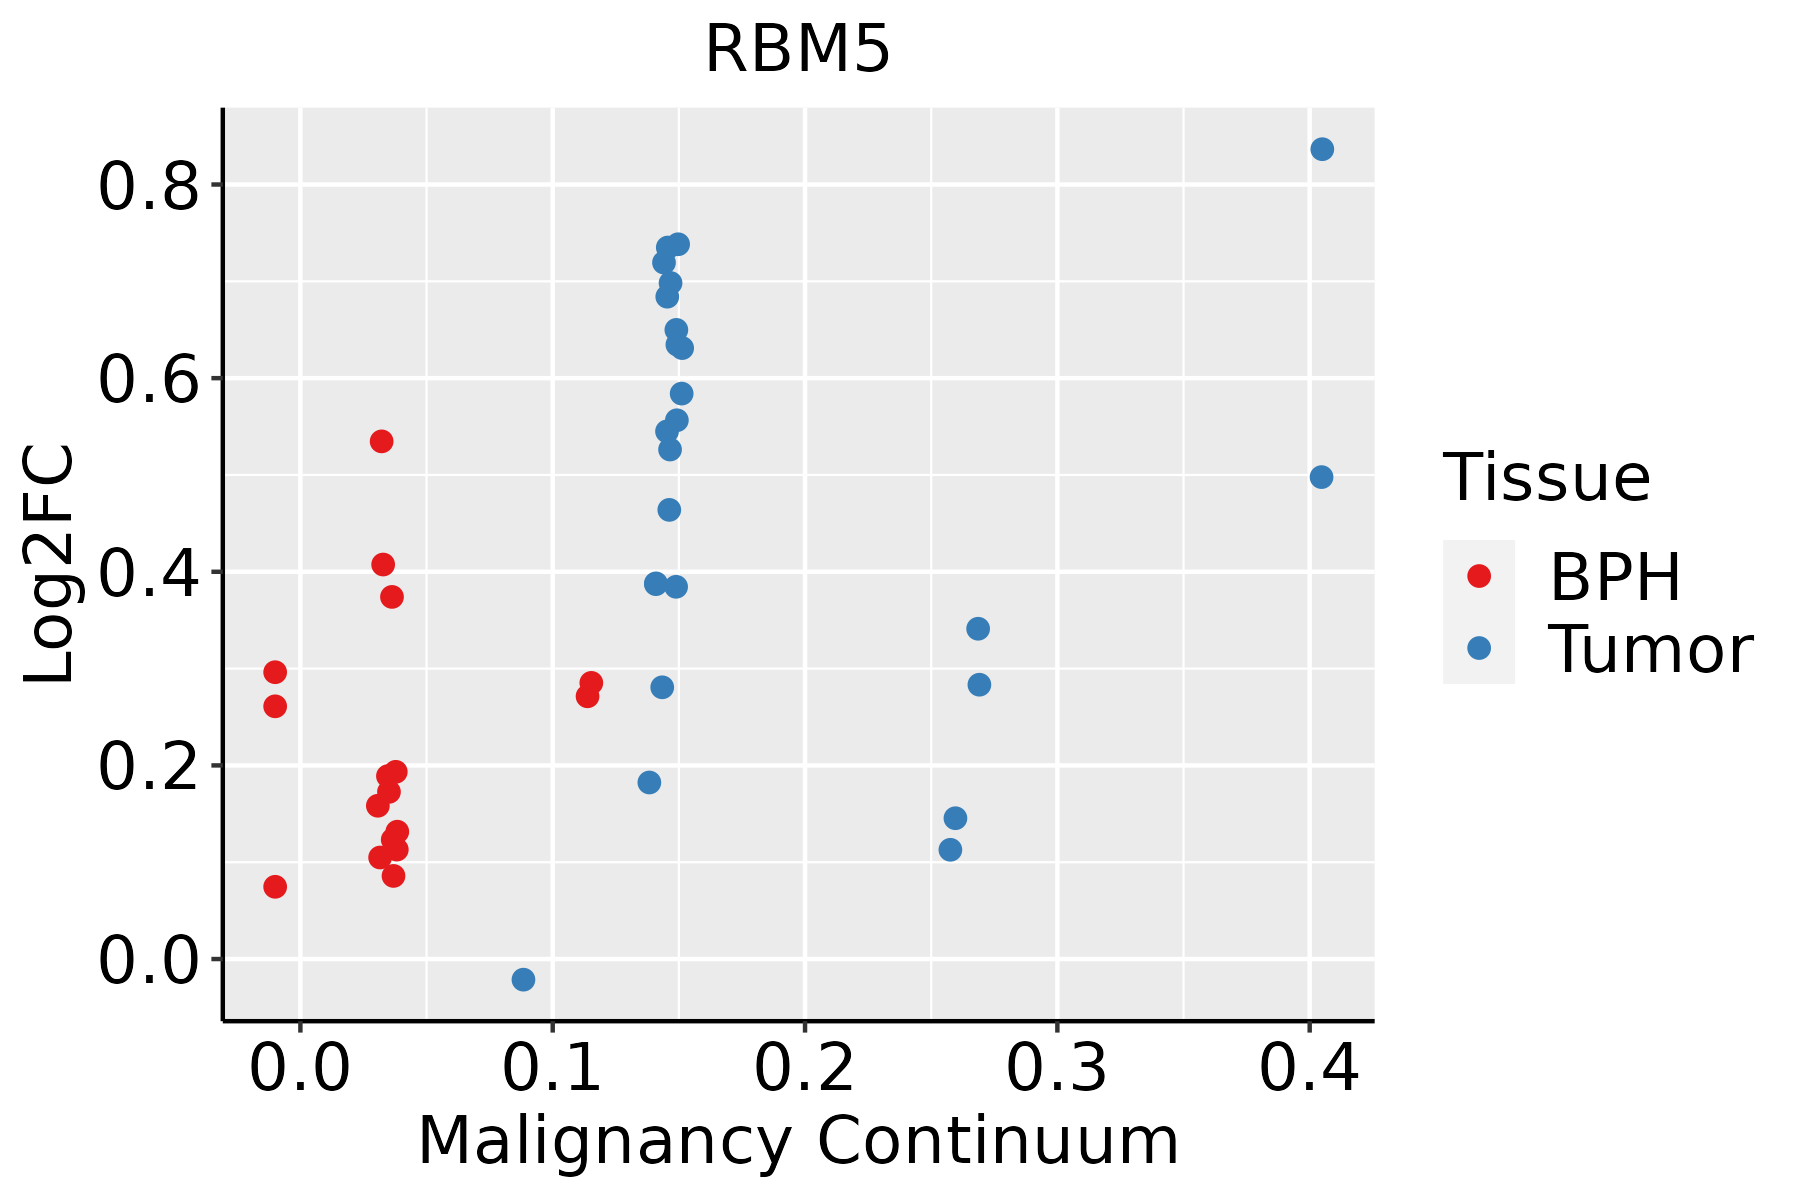
BPH: Benign Prostatic Hyperplasia
SkinThe image shows the transcriptomic changes along malignancy continuum.log2FC in expression of this searched gene in stem-like cells from each diseased tissue sample relative to stem-like cells in normal samples in each tissue plotted against the malignancy continuum. Samples are colored based on if they are from different disease stage.AK: Actinic keratosis
cSCC: Cutaneous squamous cell carcinoma
SCCIS:squamous cell carcinoma in situ
ThyroidThe image shows the transcriptomic changes along malignancy continuum.log2FC in expression of this searched gene in stem-like cells from each diseased tissue sample relative to stem-like cells in normal samples in each tissue plotted against the malignancy continuum. Samples are colored based on if they are from different disease stage.
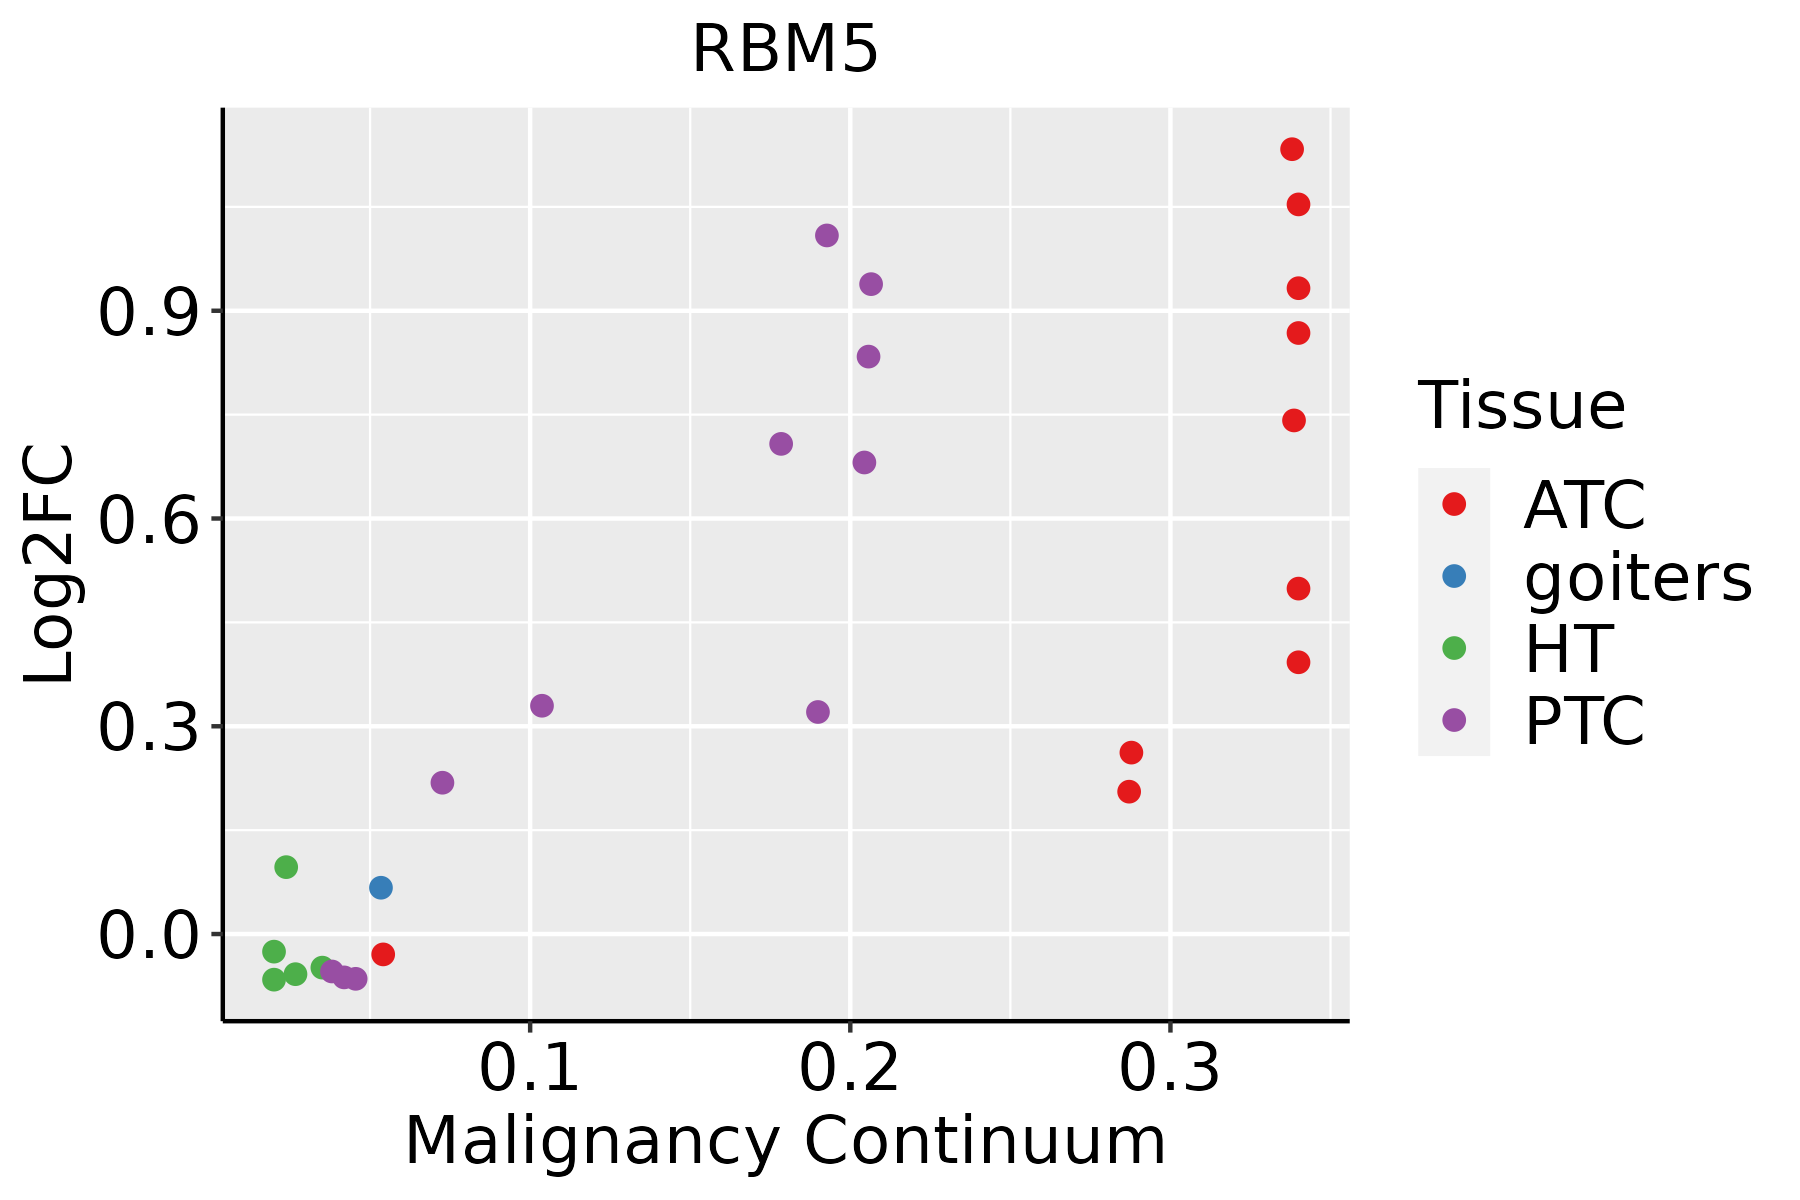
ATC: Anaplastic thyroid cancer
HT: Hashimoto's thyroiditis
PTC: Papillary thyroid cancer
∗log2FC in expression of this searched gene in stem-like cells from each diseased tissue sample relative to stem-like cells in normal samples in each tissue plotted against the malignancy continuum. Samples are colored based on if they are from different disease stage.

Top

Malignant transformation related pathway analysis

check buttonFind out the enriched GO biological processes and KEGG pathways involved in transition from healthy to precancer to cancer
check button Figure of enriched GO biological processes.
TissueDisease StageEnriched GO biological Processes
ColorectumADGO analysis - Figure of enriched GO biological processes: Top 15 enriched GO BP terms are showed in the bar plot of each disease state in each tissue. Each row represents a significant GO biological process which is colored according to the -log10(p.adjust).
ColorectumSERGO analysis - Figure of enriched GO biological processes: Top 15 enriched GO BP terms are showed in the bar plot of each disease state in each tissue. Each row represents a significant GO biological process which is colored according to the -log10(p.adjust).
ColorectumMSSGO analysis - Figure of enriched GO biological processes: Top 15 enriched GO BP terms are showed in the bar plot of each disease state in each tissue. Each row represents a significant GO biological process which is colored according to the -log10(p.adjust).
ColorectumMSI-HGO analysis - Figure of enriched GO biological processes: Top 15 enriched GO BP terms are showed in the bar plot of each disease state in each tissue. Each row represents a significant GO biological process which is colored according to the -log10(p.adjust).
ColorectumFAPGO analysis - Figure of enriched GO biological processes: Top 15 enriched GO BP terms are showed in the bar plot of each disease state in each tissue. Each row represents a significant GO biological process which is colored according to the -log10(p.adjust).
∗Top 15 enriched GO BP terms are showed in the bar plot of each disease state in each tissue. Each row represents a significant GO biological process which is colored according to the -log10(p.adjust).
Page: 1 2 3 4 5 6 7 8 9 

check button Enriched GO biological processes.
GO IDTissueDisease StageDescriptionGene RatioBg Ratiopvaluep.adjustCount
GO:000838026EsophagusHGINRNA splicing160/2587434/187233.74e-341.12e-30160
GO:002261327EsophagusHGINribonucleoprotein complex biogenesis158/2587463/187232.61e-295.23e-26158
GO:000037520EsophagusHGINRNA splicing, via transesterification reactions115/2587324/187233.16e-233.80e-20115
GO:000037720EsophagusHGINRNA splicing, via transesterification reactions with bulged adenosine as nucleophile113/2587320/187231.24e-229.26e-20113
GO:000039820EsophagusHGINmRNA splicing, via spliceosome113/2587320/187231.24e-229.26e-20113
GO:007182627EsophagusHGINribonucleoprotein complex subunit organization84/2587227/187231.34e-185.37e-1684
GO:002261827EsophagusHGINribonucleoprotein complex assembly82/2587220/187232.07e-187.36e-1682
GO:004348427EsophagusHGINregulation of RNA splicing59/2587148/187233.61e-157.22e-1359
GO:190331120EsophagusHGINregulation of mRNA metabolic process91/2587288/187235.06e-159.78e-1391
GO:005068419EsophagusHGINregulation of mRNA processing55/2587137/187232.17e-143.94e-1255
GO:004802426EsophagusHGINregulation of mRNA splicing, via spliceosome42/2587101/187236.35e-127.78e-1042
GO:000038018EsophagusHGINalternative mRNA splicing, via spliceosome32/258777/187232.06e-091.54e-0732
GO:000038118EsophagusHGINregulation of alternative mRNA splicing, via spliceosome22/258760/187237.92e-062.40e-0422
GO:00002457EsophagusHGINspliceosomal complex assembly25/258779/187233.74e-059.30e-0425
GO:0022613111EsophagusESCCribonucleoprotein complex biogenesis365/8552463/187231.74e-491.11e-45365
GO:0008380111EsophagusESCCRNA splicing336/8552434/187231.74e-423.67e-39336
GO:0000375111EsophagusESCCRNA splicing, via transesterification reactions248/8552324/187233.05e-301.49e-27248
GO:0000377111EsophagusESCCRNA splicing, via transesterification reactions with bulged adenosine as nucleophile244/8552320/187232.52e-291.07e-26244
GO:0000398111EsophagusESCCmRNA splicing, via spliceosome244/8552320/187232.52e-291.07e-26244
GO:1903311110EsophagusESCCregulation of mRNA metabolic process210/8552288/187233.25e-215.56e-19210
Page: 1 2 3 4 5 6 7 8 9 

check button Enriched KEGG pathways.
Pathway IDTissueDisease StageDescriptionGene RatioBg Ratiopvaluep.adjustqvalueCount
Page: 1 

Top

Cell-cell communication analysis

check buttonIdentification of potential cell-cell interactions between two cell types and their ligand-receptor pairs for different disease states
LigandReceptorLRpairPathwayTissueDisease Stage
Page: 1 

Top

Single-cell gene regulatory network inference analysis

check buttonFind out the significant the regulons (TFs) and the target genes of each regulon across cell types for different disease states
TFCell TypeTissueDisease StageTarget GeneRSSRegulon Activity
∗The dot plots of a searched regulon are shown for all cell subpopulations in each disease state of each tissue based on the regulon specific score inferred using pySCENIC and by calculating the average expression.
Page: 1 

Top

Somatic mutation of malignant transformation related genes

check buttonAnnotation of somatic variants for genes involved in malignant transformation
Hugo SymbolVariant ClassVariant ClassificationdbSNP RSHGVScHGVSpHGVSp ShortSWISSPROTBIOTYPESIFTPolyPhenTumor Sample BarcodeTissueHistologySexAgeStageTherapy TypesDrugsOutcome
RBM5SNVMissense_Mutationnovelc.1909N>Ap.Glu637Lysp.E637KP52756protein_codingtolerated(0.36)benign(0.012)TCGA-A2-A3XZ-01Breastbreast invasive carcinomaFemale<65I/IIChemotherapycarboplatinCR
RBM5SNVMissense_Mutationnovelc.443A>Gp.Tyr148Cysp.Y148CP52756protein_codingtolerated(0.09)probably_damaging(0.998)TCGA-OL-A66I-01Breastbreast invasive carcinomaFemale<65I/IIChemotherapyadriamycinCR
RBM5insertionIn_Frame_Insnovelc.476_477insAGTGAGAGAp.Ala159_Asn160insValArgAspp.A159_N160insVRDP52756protein_codingTCGA-A8-A097-01Breastbreast invasive carcinomaFemale>=65I/IIHormone TherapytamoxiphenSD
RBM5insertionFrame_Shift_Insnovelc.477_478insAGAGACTCCCATCTTAp.Asn160ArgfsTer22p.N160Rfs*22P52756protein_codingTCGA-A8-A097-01Breastbreast invasive carcinomaFemale>=65I/IIHormone TherapytamoxiphenSD
RBM5insertionNonsense_Mutationnovelc.497_498insAGTGGCATTAACATTCTAATCTCCTTGAGAATGCCTTTTATAGp.Gln167ValfsTer6p.Q167Vfs*6P52756protein_codingTCGA-BH-A0EB-01Breastbreast invasive carcinomaFemale>=65I/IIHormone TherapyarimidexSD
RBM5deletionFrame_Shift_Delnovelc.1046delNp.Ser350ValfsTer52p.S350Vfs*52P52756protein_codingTCGA-EW-A2FV-01Breastbreast invasive carcinomaFemale<65III/IVChemotherapydocetaxelSD
RBM5SNVMissense_Mutationrs147593355c.1217C>Tp.Ala406Valp.A406VP52756protein_codingtolerated(0.21)benign(0.039)TCGA-2W-A8YY-01Cervixcervical & endocervical cancerFemale<65I/IIChemotherapycisplatinCR
RBM5SNVMissense_Mutationrs145873632c.2185G>Ap.Gly729Serp.G729SP52756protein_codingtolerated(0.25)benign(0.083)TCGA-2W-A8YY-01Cervixcervical & endocervical cancerFemale<65I/IIChemotherapycisplatinCR
RBM5SNVMissense_Mutationnovelc.593N>Cp.Arg198Thrp.R198TP52756protein_codingdeleterious(0)probably_damaging(0.991)TCGA-C5-A1M7-01Cervixcervical & endocervical cancerFemale<65I/IIUnknownUnknownSD
RBM5SNVMissense_Mutationnovelc.2111N>Ap.Arg704Glnp.R704QP52756protein_codingdeleterious(0)probably_damaging(0.963)TCGA-C5-A7UI-01Cervixcervical & endocervical cancerFemale<65I/IIUnknownUnknownSD
Page: 1 2 3 4 5 6 7 8 

Top

Related drugs of malignant transformation related genes

check buttonIdentification of chemicals and drugs interact with genes involved in malignant transfromation
(DGIdb 4.0)
Entrez IDSymbolCategoryInteraction TypesDrug Claim NameDrug NamePMIDs
Page: 1