
|
|||||
|
 | |
| |
| |
| |
| |
| |
|
Gene: RBM4B |
Gene summary for RBM4B |
| Gene information | Species | Human | Gene symbol | RBM4B | Gene ID | 83759 |
| Gene name | RNA binding motif protein 4B | |
| Gene Alias | RBM30 | |
| Cytomap | 11q13.2 | |
| Gene Type | protein-coding | GO ID | GO:0000375 | UniProtAcc | E9PLB0 |
Top |
Malignant transformation analysis |
| Identification of the aberrant gene expression in precancerous and cancerous lesions by comparing the gene expression of stem-like cells in diseased tissues with normal stem cells |
| Entrez ID | Symbol | Replicates | Species | Organ | Tissue | Adj P-value | Log2FC | Malignancy |
| 83759 | RBM4B | LZE2T | Human | Esophagus | ESCC | 2.16e-04 | 3.90e-01 | 0.082 |
| 83759 | RBM4B | LZE4T | Human | Esophagus | ESCC | 1.34e-07 | 2.17e-01 | 0.0811 |
| 83759 | RBM4B | LZE7T | Human | Esophagus | ESCC | 2.70e-05 | 3.26e-01 | 0.0667 |
| 83759 | RBM4B | LZE8T | Human | Esophagus | ESCC | 1.84e-03 | 1.65e-01 | 0.067 |
| 83759 | RBM4B | LZE20T | Human | Esophagus | ESCC | 1.37e-07 | 3.27e-01 | 0.0662 |
| 83759 | RBM4B | LZE22T | Human | Esophagus | ESCC | 6.43e-04 | 2.83e-01 | 0.068 |
| 83759 | RBM4B | LZE24T | Human | Esophagus | ESCC | 1.00e-15 | 4.31e-01 | 0.0596 |
| 83759 | RBM4B | LZE6T | Human | Esophagus | ESCC | 4.58e-04 | 1.95e-01 | 0.0845 |
| 83759 | RBM4B | P1T-E | Human | Esophagus | ESCC | 1.18e-05 | 3.06e-01 | 0.0875 |
| 83759 | RBM4B | P2T-E | Human | Esophagus | ESCC | 1.16e-24 | 3.53e-01 | 0.1177 |
| 83759 | RBM4B | P4T-E | Human | Esophagus | ESCC | 1.51e-32 | 7.52e-01 | 0.1323 |
| 83759 | RBM4B | P5T-E | Human | Esophagus | ESCC | 1.34e-15 | 3.51e-01 | 0.1327 |
| 83759 | RBM4B | P8T-E | Human | Esophagus | ESCC | 1.08e-26 | 4.97e-01 | 0.0889 |
| 83759 | RBM4B | P9T-E | Human | Esophagus | ESCC | 2.74e-16 | 3.19e-01 | 0.1131 |
| 83759 | RBM4B | P10T-E | Human | Esophagus | ESCC | 3.18e-24 | 3.63e-01 | 0.116 |
| 83759 | RBM4B | P11T-E | Human | Esophagus | ESCC | 9.86e-19 | 6.60e-01 | 0.1426 |
| 83759 | RBM4B | P12T-E | Human | Esophagus | ESCC | 1.95e-26 | 4.95e-01 | 0.1122 |
| 83759 | RBM4B | P15T-E | Human | Esophagus | ESCC | 8.83e-13 | 3.41e-01 | 0.1149 |
| 83759 | RBM4B | P16T-E | Human | Esophagus | ESCC | 6.81e-23 | 4.35e-01 | 0.1153 |
| 83759 | RBM4B | P17T-E | Human | Esophagus | ESCC | 3.85e-05 | 2.13e-01 | 0.1278 |
| Page: 1 2 3 4 |
| Tissue | Expression Dynamics | Abbreviation |
| Esophagus | 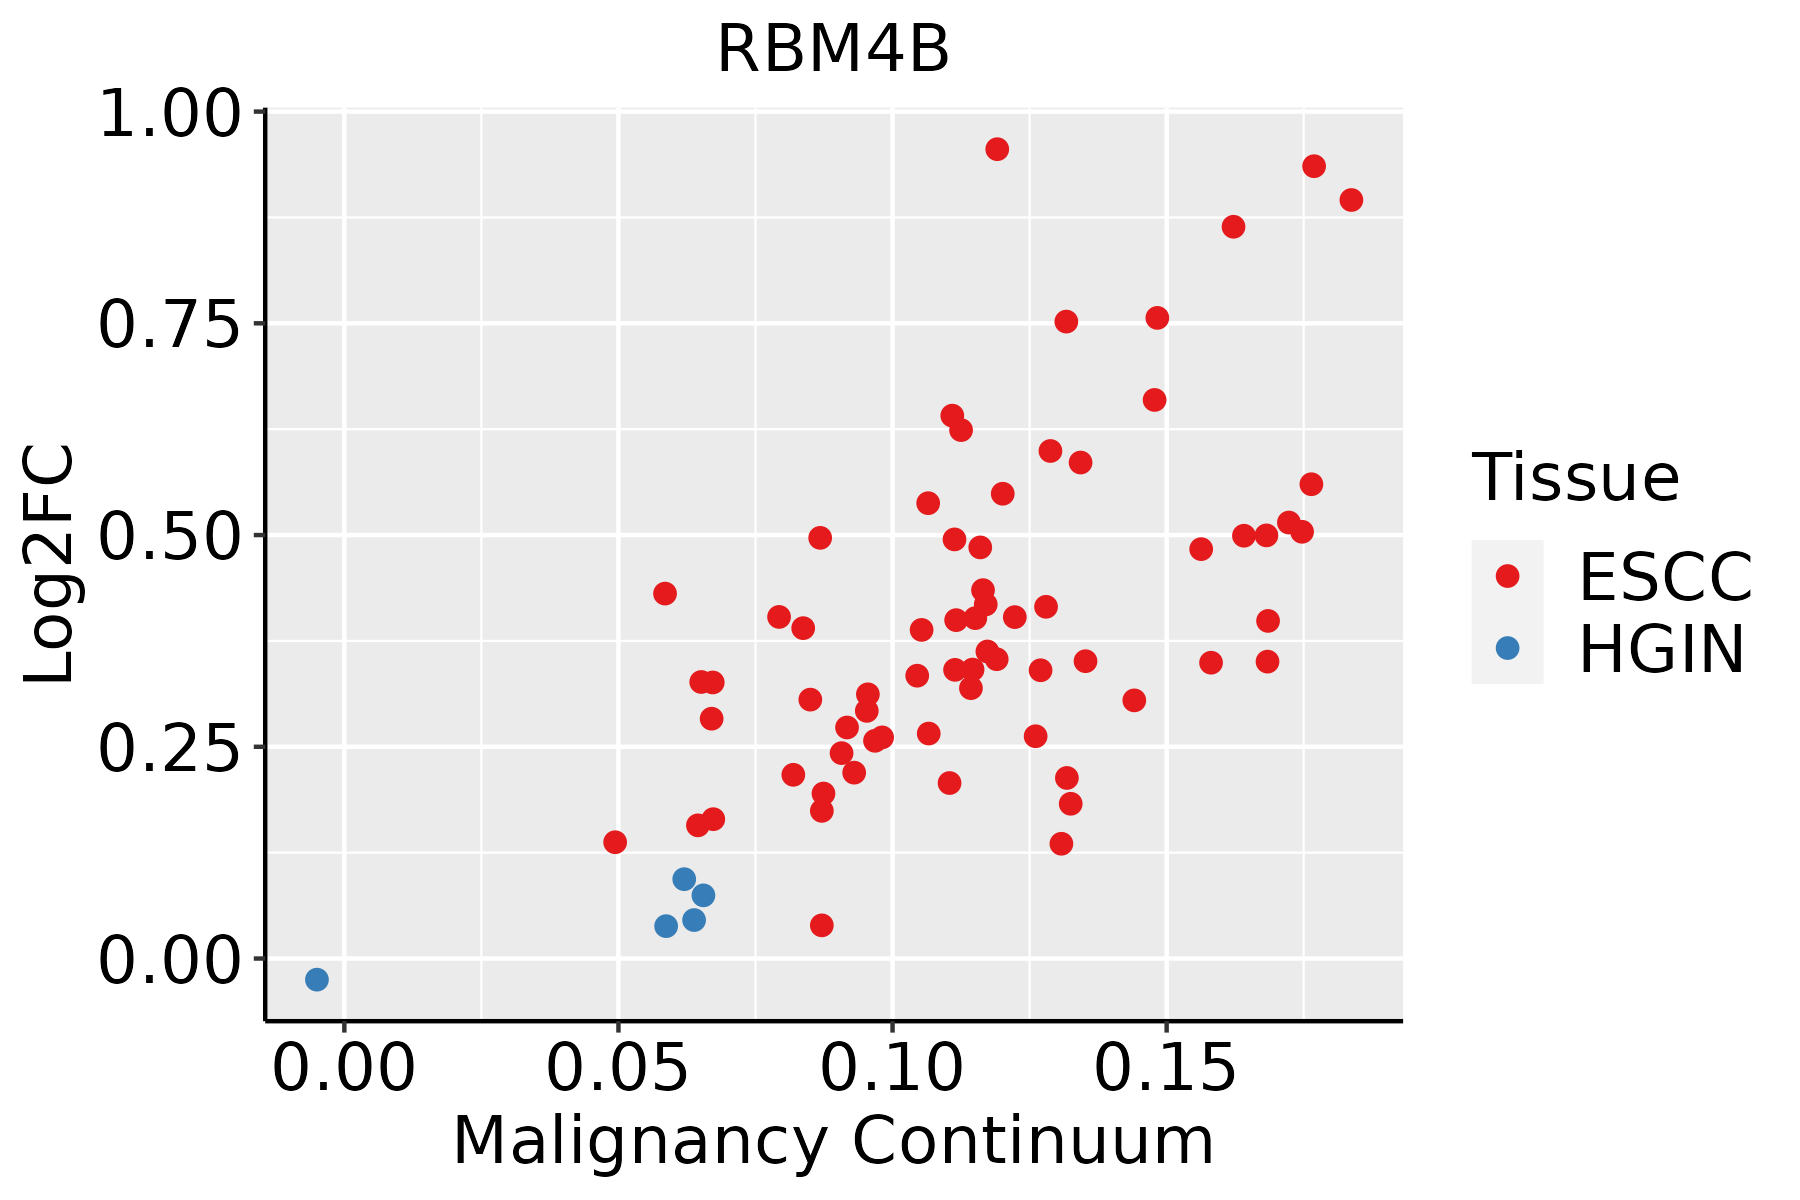 | ESCC: Esophageal squamous cell carcinoma |
| HGIN: High-grade intraepithelial neoplasias | ||
| LGIN: Low-grade intraepithelial neoplasias | ||
| Oral Cavity | 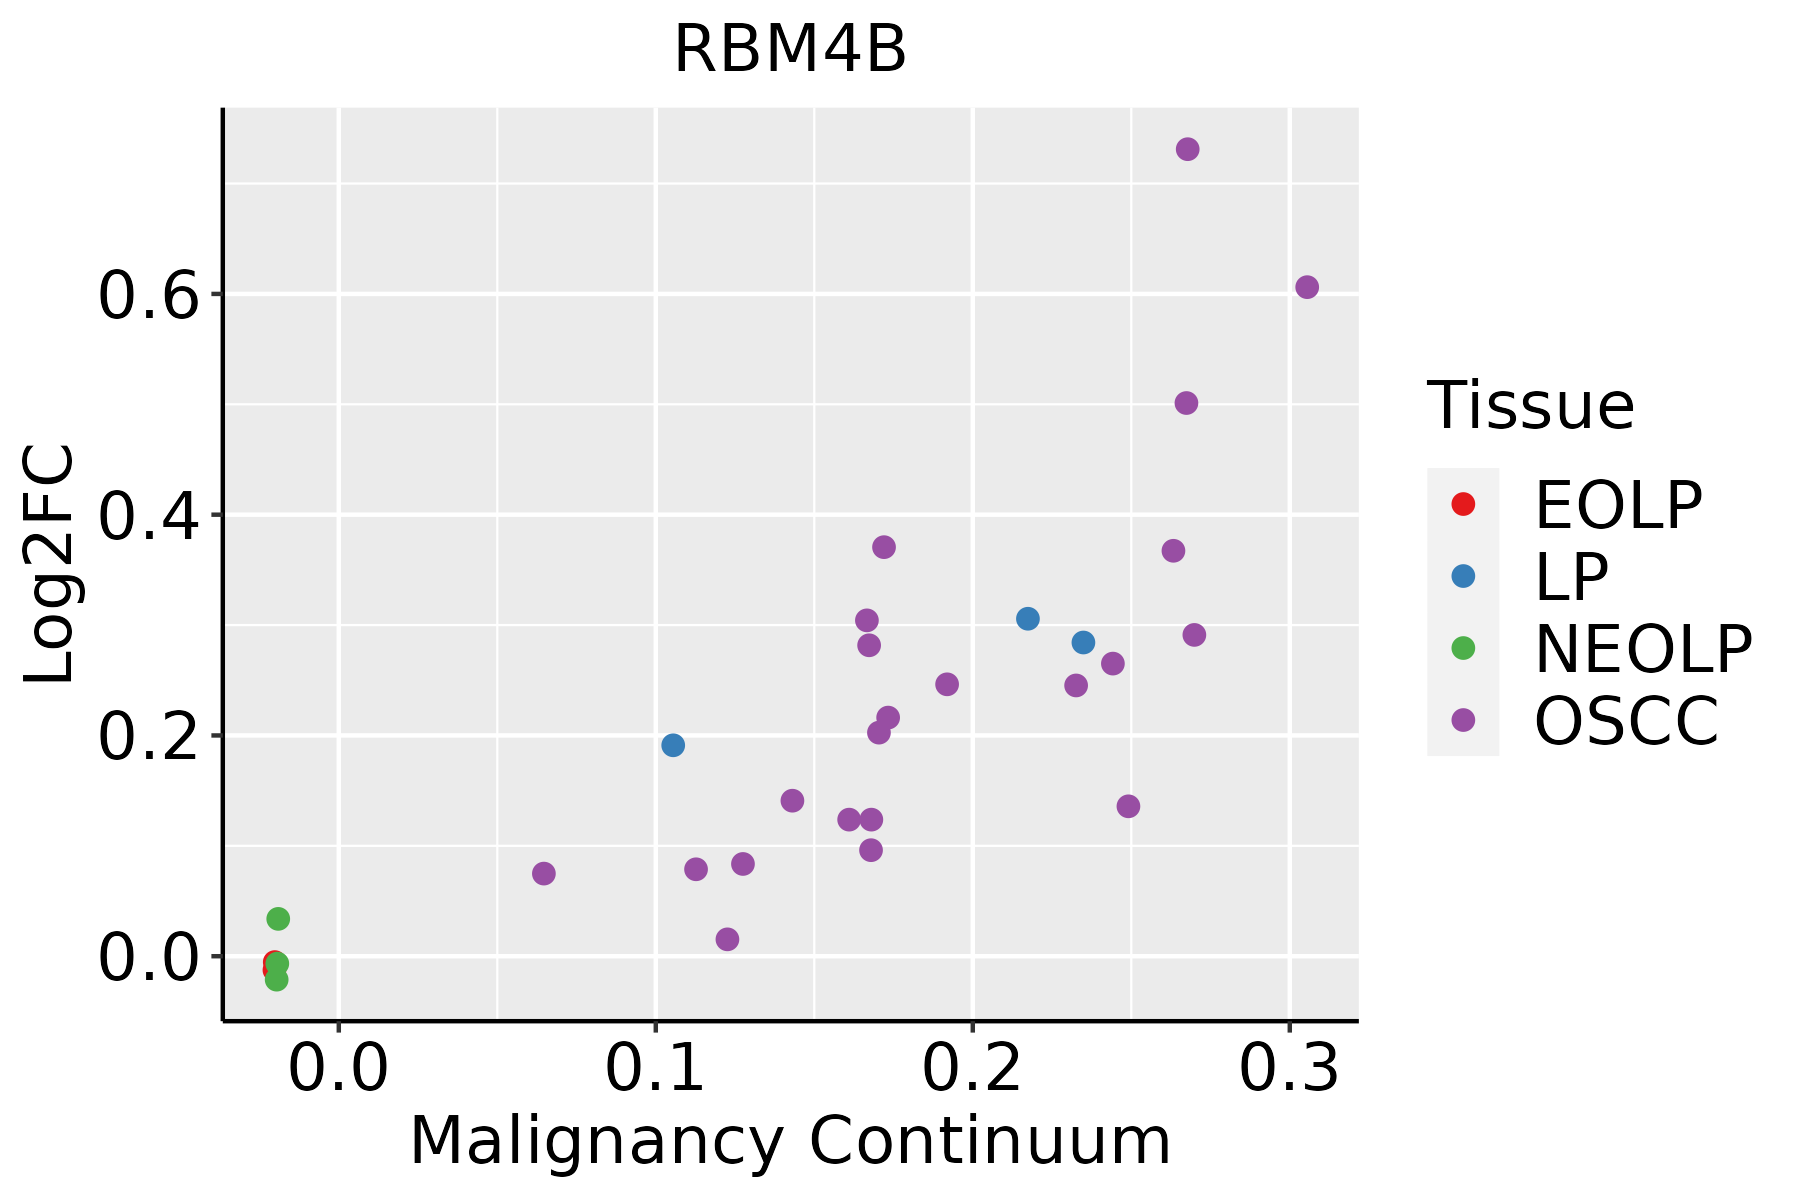 | EOLP: Erosive Oral lichen planus |
| LP: leukoplakia | ||
| NEOLP: Non-erosive oral lichen planus | ||
| OSCC: Oral squamous cell carcinoma |
| ∗log2FC in expression of this searched gene in stem-like cells from each diseased tissue sample relative to stem-like cells in normal samples in each tissue plotted against the malignancy continuum. Samples are colored based on if they are from different disease stage. |
Top |
Malignant transformation related pathway analysis |
| Find out the enriched GO biological processes and KEGG pathways involved in transition from healthy to precancer to cancer |
| Tissue | Disease Stage | Enriched GO biological Processes |
| Colorectum | AD |  |
| Colorectum | SER |  |
| Colorectum | MSS |  |
| Colorectum | MSI-H |  |
| Colorectum | FAP |  |
| ∗Top 15 enriched GO BP terms are showed in the bar plot of each disease state in each tissue. Each row represents a significant GO biological process which is colored according to the -log10(p.adjust). |
| Page: 1 2 3 4 5 6 7 8 9 |
| GO ID | Tissue | Disease Stage | Description | Gene Ratio | Bg Ratio | pvalue | p.adjust | Count |
| GO:0008380111 | Esophagus | ESCC | RNA splicing | 336/8552 | 434/18723 | 1.74e-42 | 3.67e-39 | 336 |
| GO:0000375111 | Esophagus | ESCC | RNA splicing, via transesterification reactions | 248/8552 | 324/18723 | 3.05e-30 | 1.49e-27 | 248 |
| GO:0000377111 | Esophagus | ESCC | RNA splicing, via transesterification reactions with bulged adenosine as nucleophile | 244/8552 | 320/18723 | 2.52e-29 | 1.07e-26 | 244 |
| GO:0000398111 | Esophagus | ESCC | mRNA splicing, via spliceosome | 244/8552 | 320/18723 | 2.52e-29 | 1.07e-26 | 244 |
| GO:0006417111 | Esophagus | ESCC | regulation of translation | 304/8552 | 468/18723 | 1.53e-17 | 1.33e-15 | 304 |
| GO:000931419 | Esophagus | ESCC | response to radiation | 277/8552 | 456/18723 | 4.42e-11 | 1.43e-09 | 277 |
| GO:000941611 | Esophagus | ESCC | response to light stimulus | 183/8552 | 320/18723 | 2.03e-05 | 1.76e-04 | 183 |
| GO:003292215 | Esophagus | ESCC | circadian regulation of gene expression | 48/8552 | 68/18723 | 2.76e-05 | 2.30e-04 | 48 |
| GO:004851118 | Esophagus | ESCC | rhythmic process | 164/8552 | 298/18723 | 6.80e-04 | 3.57e-03 | 164 |
| GO:000762319 | Esophagus | ESCC | circadian rhythm | 119/8552 | 210/18723 | 8.47e-04 | 4.36e-03 | 119 |
| GO:00427529 | Esophagus | ESCC | regulation of circadian rhythm | 68/8552 | 121/18723 | 1.27e-02 | 4.21e-02 | 68 |
| GO:000838020 | Oral cavity | OSCC | RNA splicing | 308/7305 | 434/18723 | 2.43e-42 | 7.70e-39 | 308 |
| GO:000037519 | Oral cavity | OSCC | RNA splicing, via transesterification reactions | 225/7305 | 324/18723 | 5.20e-29 | 2.99e-26 | 225 |
| GO:000037719 | Oral cavity | OSCC | RNA splicing, via transesterification reactions with bulged adenosine as nucleophile | 221/7305 | 320/18723 | 5.50e-28 | 2.18e-25 | 221 |
| GO:000039819 | Oral cavity | OSCC | mRNA splicing, via spliceosome | 221/7305 | 320/18723 | 5.50e-28 | 2.18e-25 | 221 |
| GO:000641720 | Oral cavity | OSCC | regulation of translation | 274/7305 | 468/18723 | 4.39e-18 | 4.63e-16 | 274 |
| GO:000931416 | Oral cavity | OSCC | response to radiation | 241/7305 | 456/18723 | 9.76e-10 | 2.40e-08 | 241 |
| GO:004851116 | Oral cavity | OSCC | rhythmic process | 157/7305 | 298/18723 | 1.00e-06 | 1.36e-05 | 157 |
| GO:000762316 | Oral cavity | OSCC | circadian rhythm | 110/7305 | 210/18723 | 5.40e-05 | 4.48e-04 | 110 |
| GO:00094164 | Oral cavity | OSCC | response to light stimulus | 159/7305 | 320/18723 | 5.98e-05 | 4.92e-04 | 159 |
| Page: 1 2 |
| Pathway ID | Tissue | Disease Stage | Description | Gene Ratio | Bg Ratio | pvalue | p.adjust | qvalue | Count |
| Page: 1 |
Top |
Cell-cell communication analysis |
| Identification of potential cell-cell interactions between two cell types and their ligand-receptor pairs for different disease states |
| Ligand | Receptor | LRpair | Pathway | Tissue | Disease Stage |
| Page: 1 |
Top |
Single-cell gene regulatory network inference analysis |
| Find out the significant the regulons (TFs) and the target genes of each regulon across cell types for different disease states |
| TF | Cell Type | Tissue | Disease Stage | Target Gene | RSS | Regulon Activity |
| ∗The dot plots of a searched regulon are shown for all cell subpopulations in each disease state of each tissue based on the regulon specific score inferred using pySCENIC and by calculating the average expression. |
| Page: 1 |
Top |
Somatic mutation of malignant transformation related genes |
| Annotation of somatic variants for genes involved in malignant transformation |
| Hugo Symbol | Variant Class | Variant Classification | dbSNP RS | HGVSc | HGVSp | HGVSp Short | SWISSPROT | BIOTYPE | SIFT | PolyPhen | Tumor Sample Barcode | Tissue | Histology | Sex | Age | Stage | Therapy Types | Drugs | Outcome |
| RBM4B | SNV | Missense_Mutation | novel | c.587C>A | p.Ala196Glu | p.A196E | Q9BQ04 | protein_coding | tolerated(0.05) | benign(0.198) | TCGA-BH-A0BM-01 | Breast | breast invasive carcinoma | Female | <65 | I/II | Chemotherapy | adriamycin | SD |
| RBM4B | SNV | Missense_Mutation | novel | c.446N>A | p.Arg149Gln | p.R149Q | Q9BQ04 | protein_coding | deleterious(0) | benign(0.071) | TCGA-HN-A2NL-01 | Breast | breast invasive carcinoma | Female | <65 | I/II | Chemotherapy | cyclophosphamide | SD |
| RBM4B | SNV | Missense_Mutation | novel | c.890C>G | p.Ser297Cys | p.S297C | Q9BQ04 | protein_coding | deleterious(0) | possibly_damaging(0.647) | TCGA-PL-A8LV-01 | Breast | breast invasive carcinoma | Female | <65 | III/IV | Unknown | Unknown | SD |
| RBM4B | insertion | Frame_Shift_Ins | novel | c.541_542insCTAGAGCCACCTGT | p.Gly181AlafsTer57 | p.G181Afs*57 | Q9BQ04 | protein_coding | TCGA-A2-A0EY-01 | Breast | breast invasive carcinoma | Female | <65 | I/II | Chemotherapy | adriamycin | SD | ||
| RBM4B | insertion | Nonsense_Mutation | novel | c.539_540insTTGAAAGAGACCCATGCTTCATAAAAGT | p.Gly181Ter | p.G181* | Q9BQ04 | protein_coding | TCGA-A2-A0EY-01 | Breast | breast invasive carcinoma | Female | <65 | I/II | Chemotherapy | adriamycin | SD | ||
| RBM4B | insertion | Nonsense_Mutation | novel | c.587_588insGATGGGTGGGAATGGTTAAAAG | p.Val197MetfsTer6 | p.V197Mfs*6 | Q9BQ04 | protein_coding | TCGA-BH-A0BM-01 | Breast | breast invasive carcinoma | Female | <65 | I/II | Chemotherapy | adriamycin | SD | ||
| RBM4B | SNV | Missense_Mutation | c.143C>T | p.Ala48Val | p.A48V | Q9BQ04 | protein_coding | deleterious(0) | probably_damaging(0.976) | TCGA-JX-A3Q0-01 | Cervix | cervical & endocervical cancer | Female | <65 | III/IV | Unknown | Unknown | SD | |
| RBM4B | SNV | Missense_Mutation | rs12224194 | c.877N>A | p.Ala293Thr | p.A293T | Q9BQ04 | protein_coding | tolerated(0.22) | benign(0.091) | TCGA-A6-6780-01 | Colorectum | colon adenocarcinoma | Male | >=65 | I/II | Unknown | Unknown | SD |
| RBM4B | SNV | Missense_Mutation | c.55N>T | p.Arg19Cys | p.R19C | Q9BQ04 | protein_coding | deleterious(0.04) | benign(0.12) | TCGA-AA-3510-01 | Colorectum | colon adenocarcinoma | Male | >=65 | I/II | Unknown | Unknown | SD | |
| RBM4B | SNV | Missense_Mutation | rs746480100 | c.704N>T | p.Ala235Val | p.A235V | Q9BQ04 | protein_coding | tolerated(0.32) | benign(0.085) | TCGA-AA-A010-01 | Colorectum | colon adenocarcinoma | Female | <65 | I/II | Chemotherapy | folinic | CR |
| Page: 1 2 3 4 5 |
Top |
Related drugs of malignant transformation related genes |
| Identification of chemicals and drugs interact with genes involved in malignant transfromation |
| (DGIdb 4.0) |
| Entrez ID | Symbol | Category | Interaction Types | Drug Claim Name | Drug Name | PMIDs |
| Page: 1 |

Copyright 2023-Present -The University of Texas Health Science Center at Houston |