
|
|||||
|
 | |
| |
| |
| |
| |
| |
|
Gene: RBM47 |
Gene summary for RBM47 |
| Gene information | Species | Human | Gene symbol | RBM47 | Gene ID | 54502 |
| Gene name | RNA binding motif protein 47 | |
| Gene Alias | NET18 | |
| Cytomap | 4p14 | |
| Gene Type | protein-coding | GO ID | GO:0002244 | UniProtAcc | A0AV96 |
Top |
Malignant transformation analysis |
| Identification of the aberrant gene expression in precancerous and cancerous lesions by comparing the gene expression of stem-like cells in diseased tissues with normal stem cells |
| Entrez ID | Symbol | Replicates | Species | Organ | Tissue | Adj P-value | Log2FC | Malignancy |
| 54502 | RBM47 | CA_HPV_1 | Human | Cervix | CC | 1.71e-03 | 1.24e-01 | 0.0264 |
| 54502 | RBM47 | HSIL_HPV_2 | Human | Cervix | HSIL_HPV | 2.05e-05 | 2.31e-01 | 0.0208 |
| 54502 | RBM47 | CCI_1 | Human | Cervix | CC | 6.33e-05 | 1.15e+00 | 0.528 |
| 54502 | RBM47 | CCI_2 | Human | Cervix | CC | 1.75e-08 | 1.26e+00 | 0.5249 |
| 54502 | RBM47 | CCI_3 | Human | Cervix | CC | 8.10e-07 | 8.33e-01 | 0.516 |
| 54502 | RBM47 | H2 | Human | Cervix | HSIL_HPV | 1.91e-14 | 4.81e-01 | 0.0632 |
| 54502 | RBM47 | HTA11_3410_2000001011 | Human | Colorectum | AD | 2.60e-11 | -4.54e-01 | 0.0155 |
| 54502 | RBM47 | HTA11_2487_2000001011 | Human | Colorectum | SER | 3.07e-02 | 3.80e-01 | -0.1808 |
| 54502 | RBM47 | HTA11_347_2000001011 | Human | Colorectum | AD | 1.10e-38 | 1.14e+00 | -0.1954 |
| 54502 | RBM47 | HTA11_411_2000001011 | Human | Colorectum | SER | 4.08e-15 | 8.68e-01 | -0.2602 |
| 54502 | RBM47 | HTA11_2112_2000001011 | Human | Colorectum | SER | 1.12e-03 | 5.04e-01 | -0.2196 |
| 54502 | RBM47 | HTA11_83_2000001011 | Human | Colorectum | SER | 1.09e-02 | 5.06e-01 | -0.1526 |
| 54502 | RBM47 | HTA11_696_2000001011 | Human | Colorectum | AD | 6.39e-05 | 5.24e-01 | -0.1464 |
| 54502 | RBM47 | HTA11_866_2000001011 | Human | Colorectum | AD | 2.35e-03 | 4.64e-01 | -0.1001 |
| 54502 | RBM47 | HTA11_1391_2000001011 | Human | Colorectum | AD | 6.49e-04 | 5.13e-01 | -0.059 |
| 54502 | RBM47 | HTA11_7663_2000001011 | Human | Colorectum | SER | 9.93e-04 | 5.52e-01 | 0.0131 |
| 54502 | RBM47 | HTA11_10623_2000001011 | Human | Colorectum | AD | 9.02e-07 | 3.72e-01 | -0.0177 |
| 54502 | RBM47 | HTA11_7469_2000001011 | Human | Colorectum | AD | 6.04e-03 | -4.50e-01 | -0.0124 |
| 54502 | RBM47 | HTA11_99999965062_69753 | Human | Colorectum | MSI-H | 1.07e-10 | 8.50e-01 | 0.3487 |
| 54502 | RBM47 | HTA11_99999973899_84307 | Human | Colorectum | MSS | 2.51e-06 | -5.69e-01 | 0.2585 |
| Page: 1 2 3 4 5 6 7 8 9 10 11 12 13 |
| Tissue | Expression Dynamics | Abbreviation |
| Cervix |  | CC: Cervix cancer |
| HSIL_HPV: HPV-infected high-grade squamous intraepithelial lesions | ||
| N_HPV: HPV-infected normal cervix | ||
| Colorectum (GSE201348) | 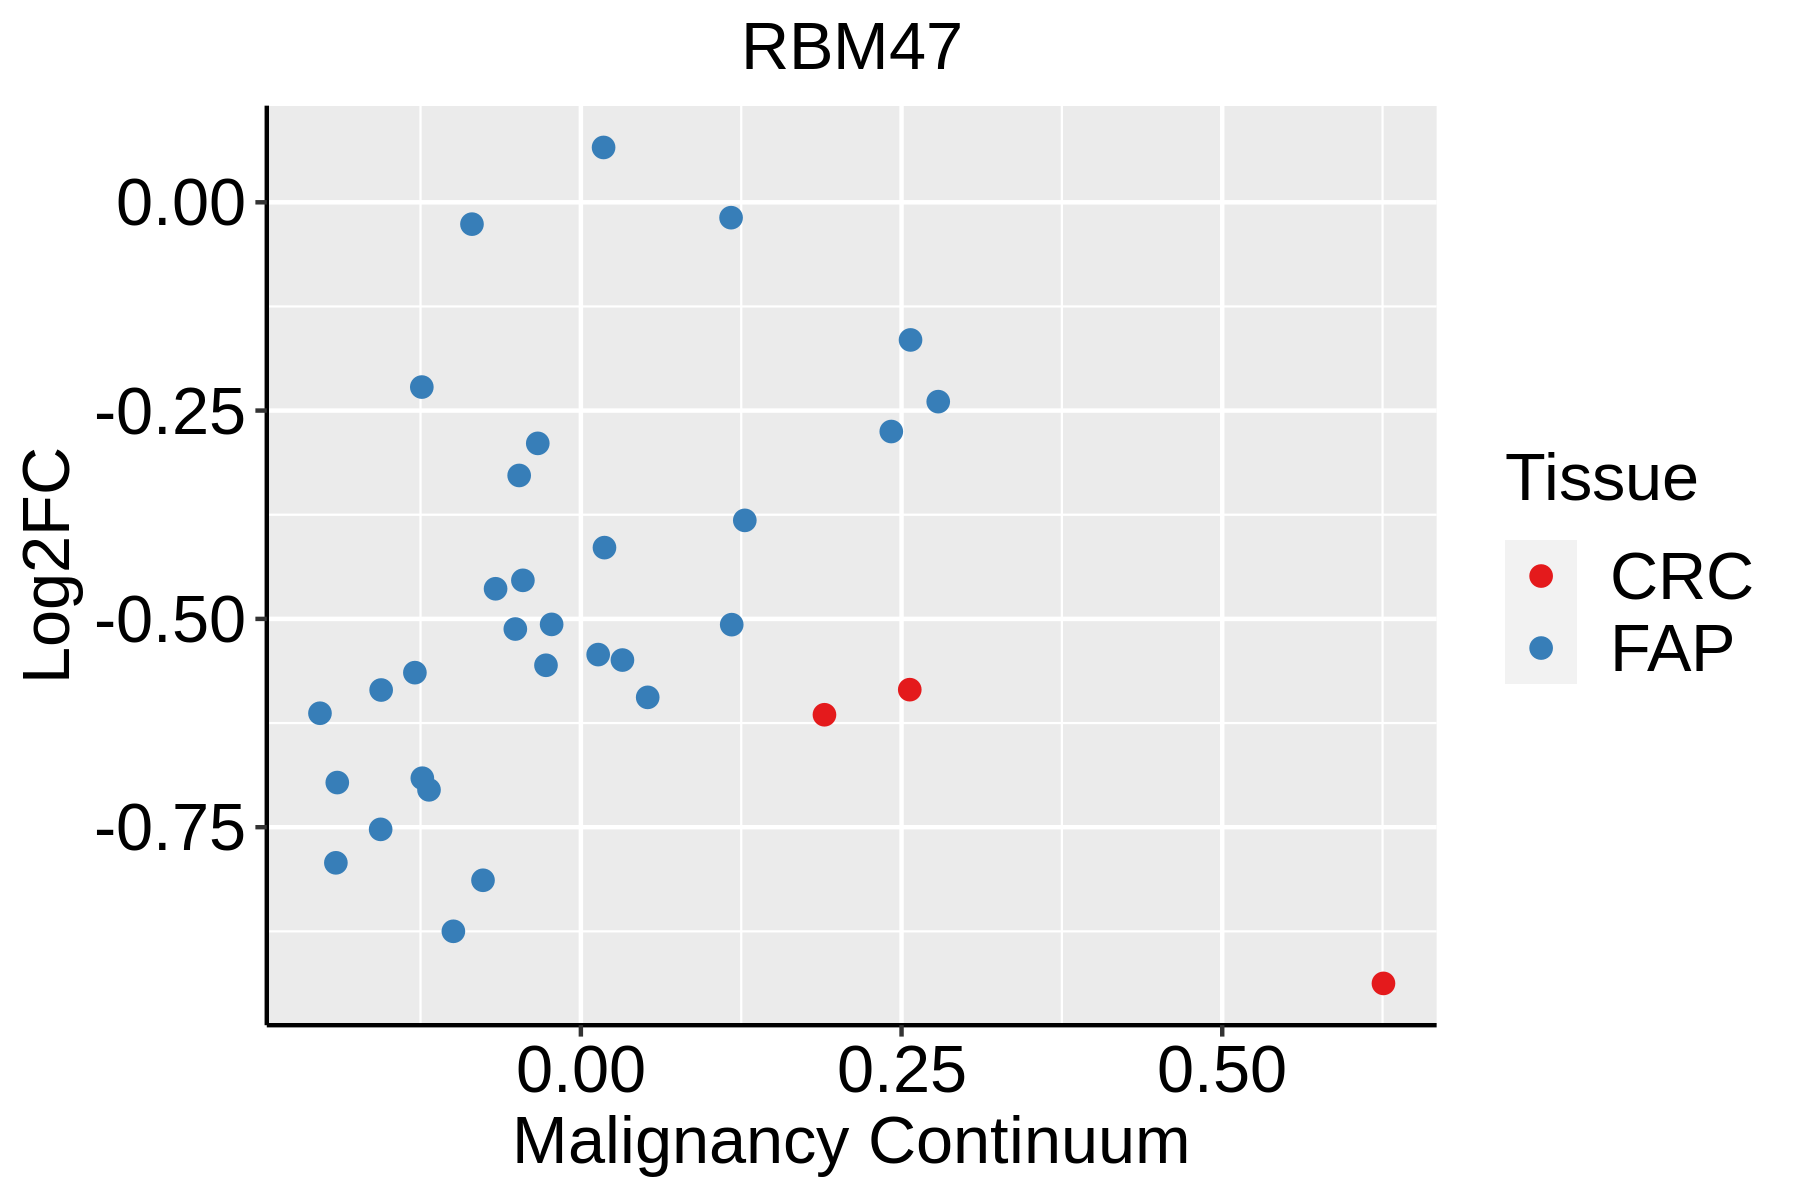 | FAP: Familial adenomatous polyposis |
| CRC: Colorectal cancer | ||
| Colorectum (HTA11) |  | AD: Adenomas |
| SER: Sessile serrated lesions | ||
| MSI-H: Microsatellite-high colorectal cancer | ||
| MSS: Microsatellite stable colorectal cancer | ||
| Endometrium | 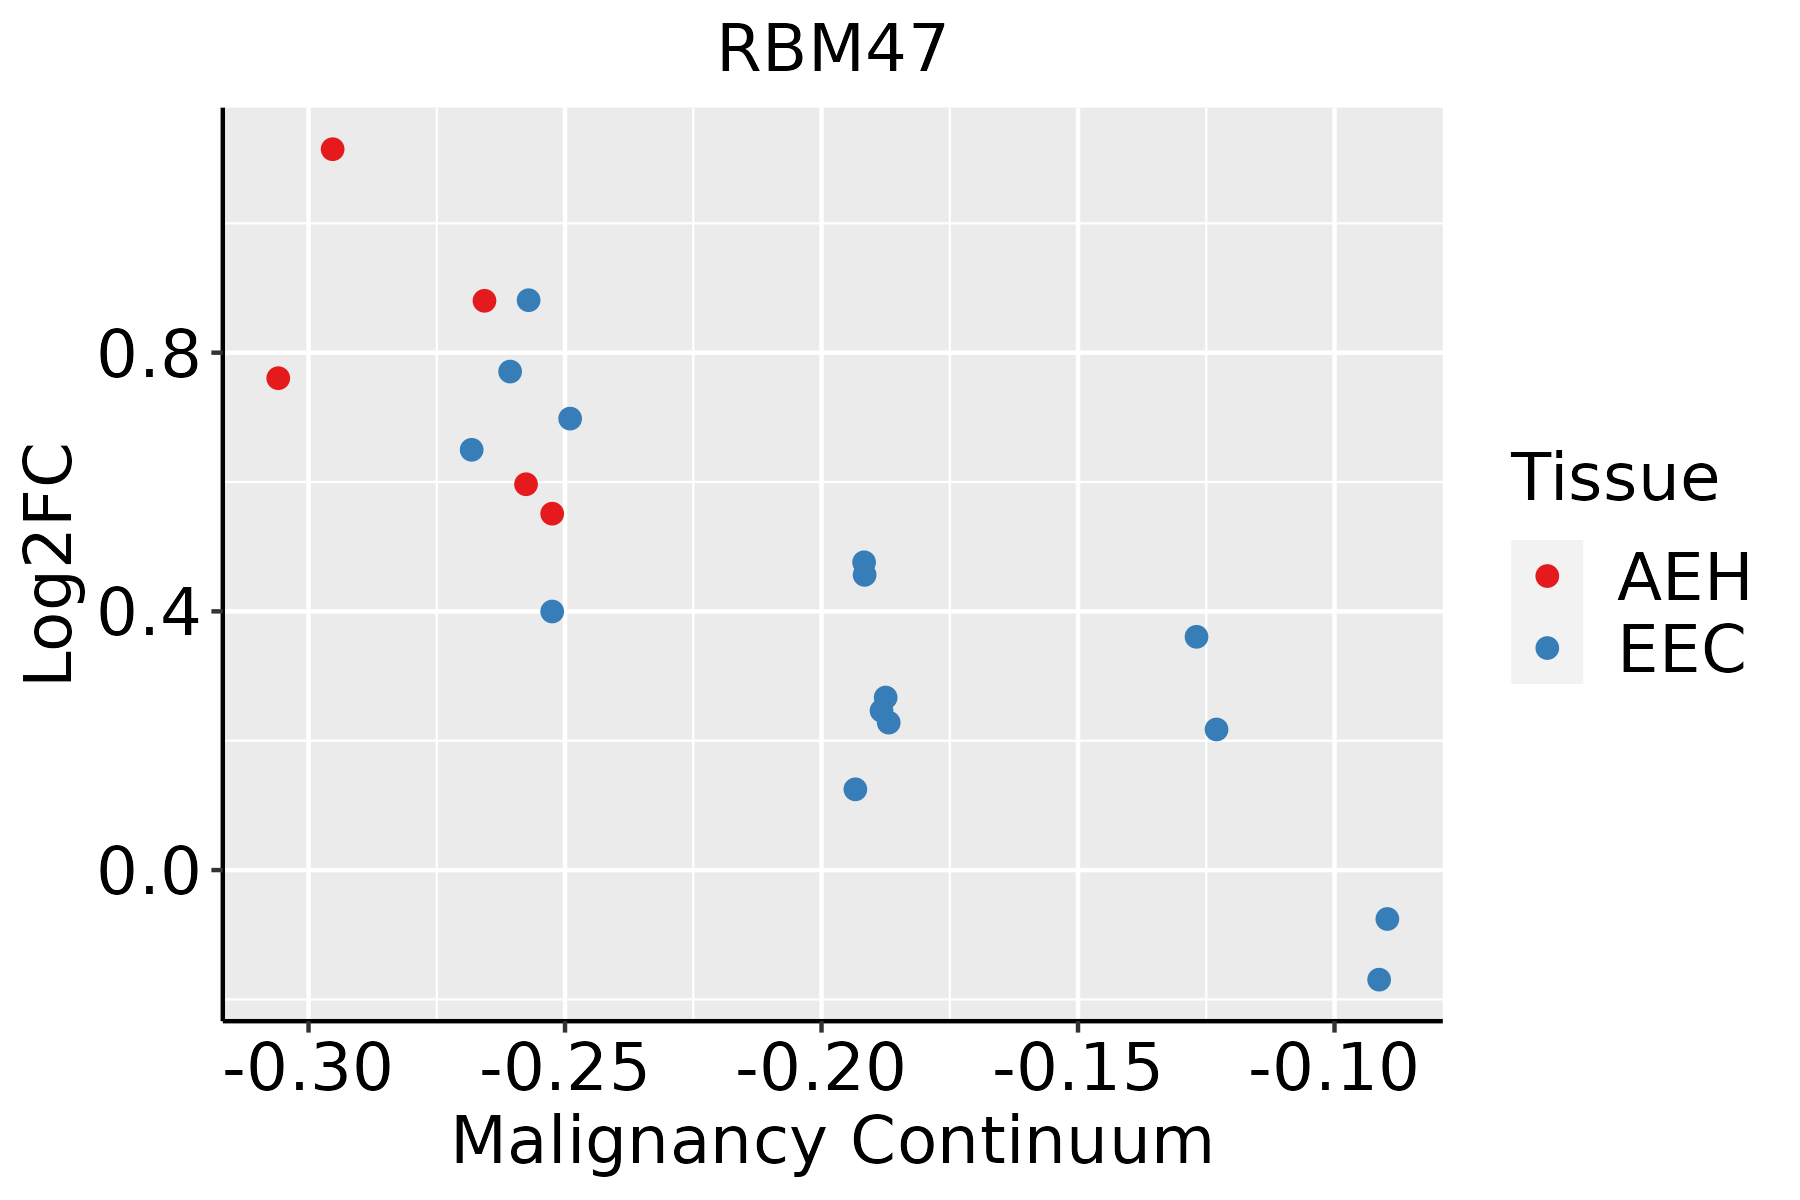 | AEH: Atypical endometrial hyperplasia |
| EEC: Endometrioid Cancer | ||
| Esophagus |  | ESCC: Esophageal squamous cell carcinoma |
| HGIN: High-grade intraepithelial neoplasias | ||
| LGIN: Low-grade intraepithelial neoplasias | ||
| GC |  | CAG: Chronic atrophic gastritis |
| CAG with IM: Chronic atrophic gastritis with intestinal metaplasia | ||
| CSG: Chronic superficial gastritis | ||
| GC: Gastric cancer | ||
| SIM: Severe intestinal metaplasia | ||
| WIM: Wild intestinal metaplasia | ||
| Liver | 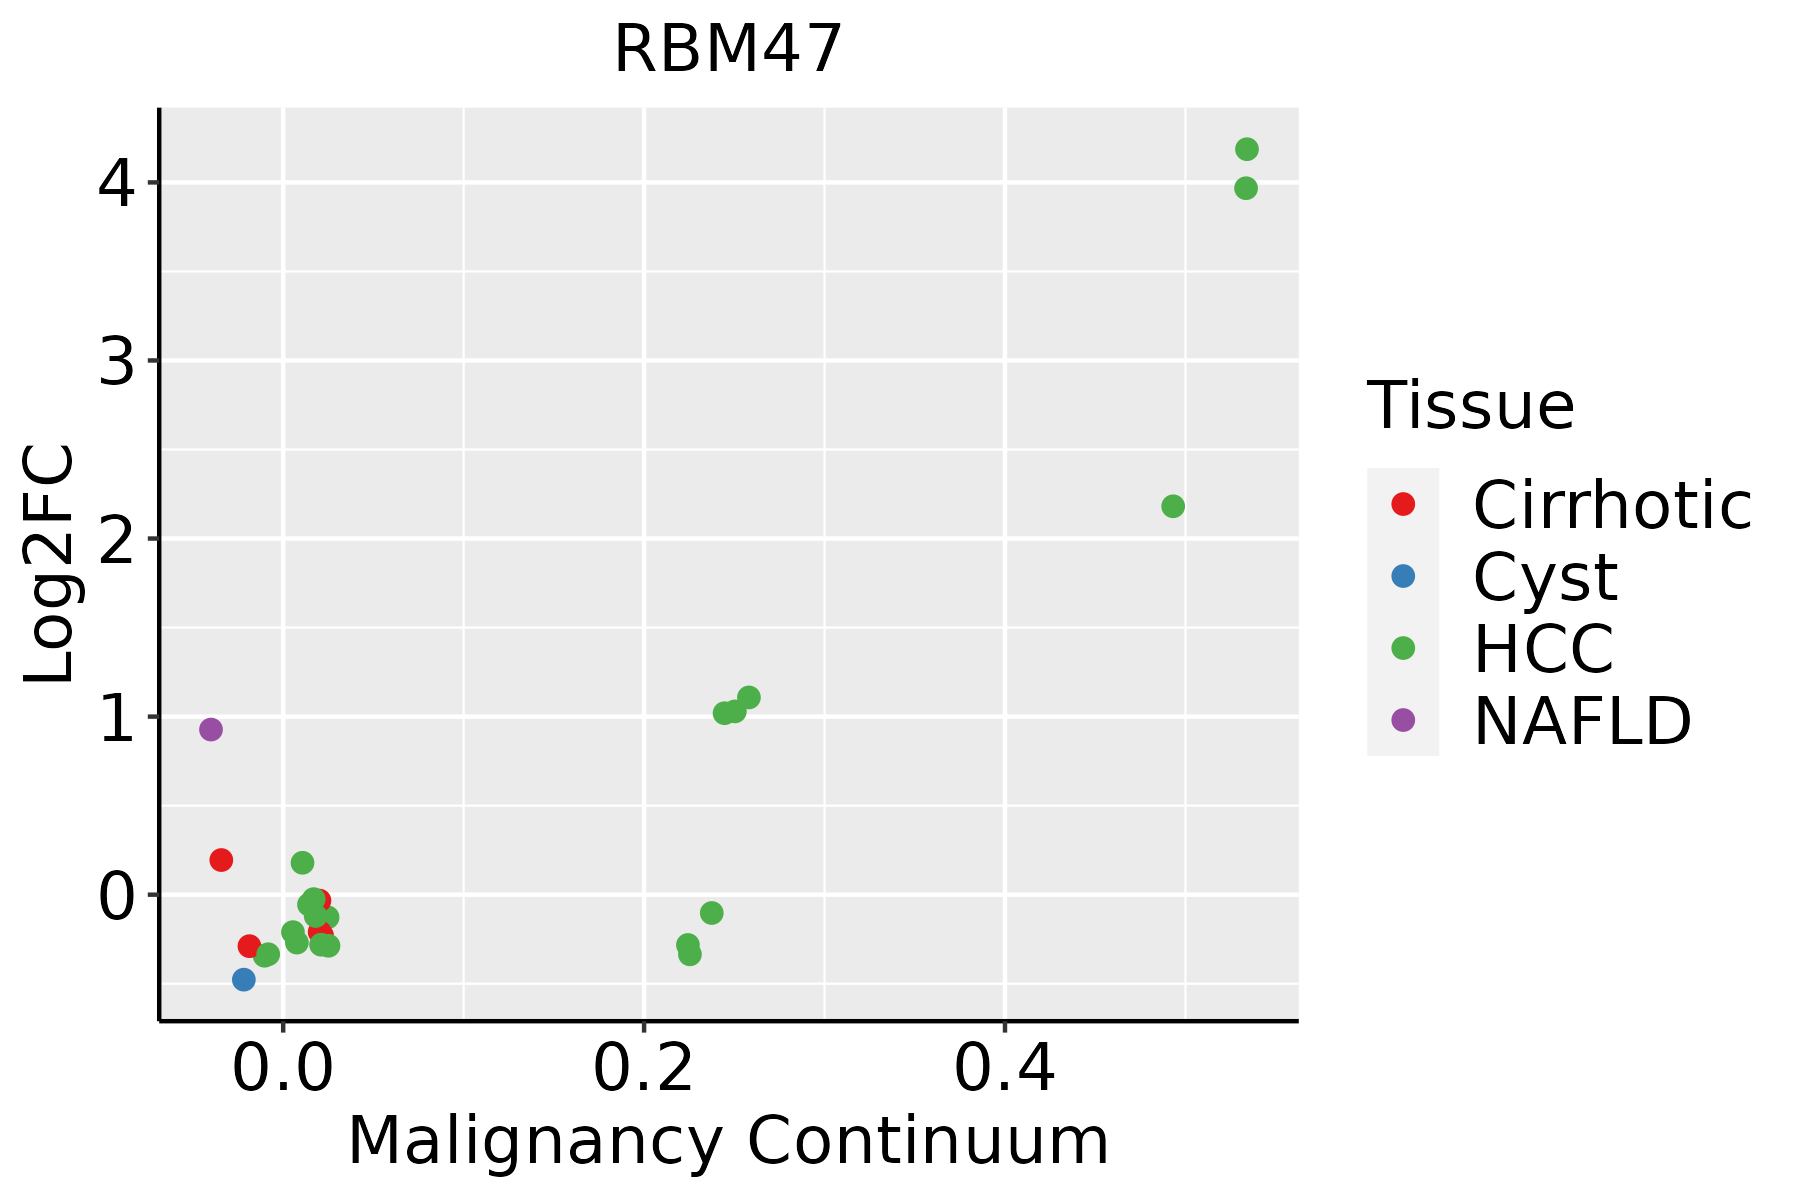 | HCC: Hepatocellular carcinoma |
| NAFLD: Non-alcoholic fatty liver disease | ||
| Lung | 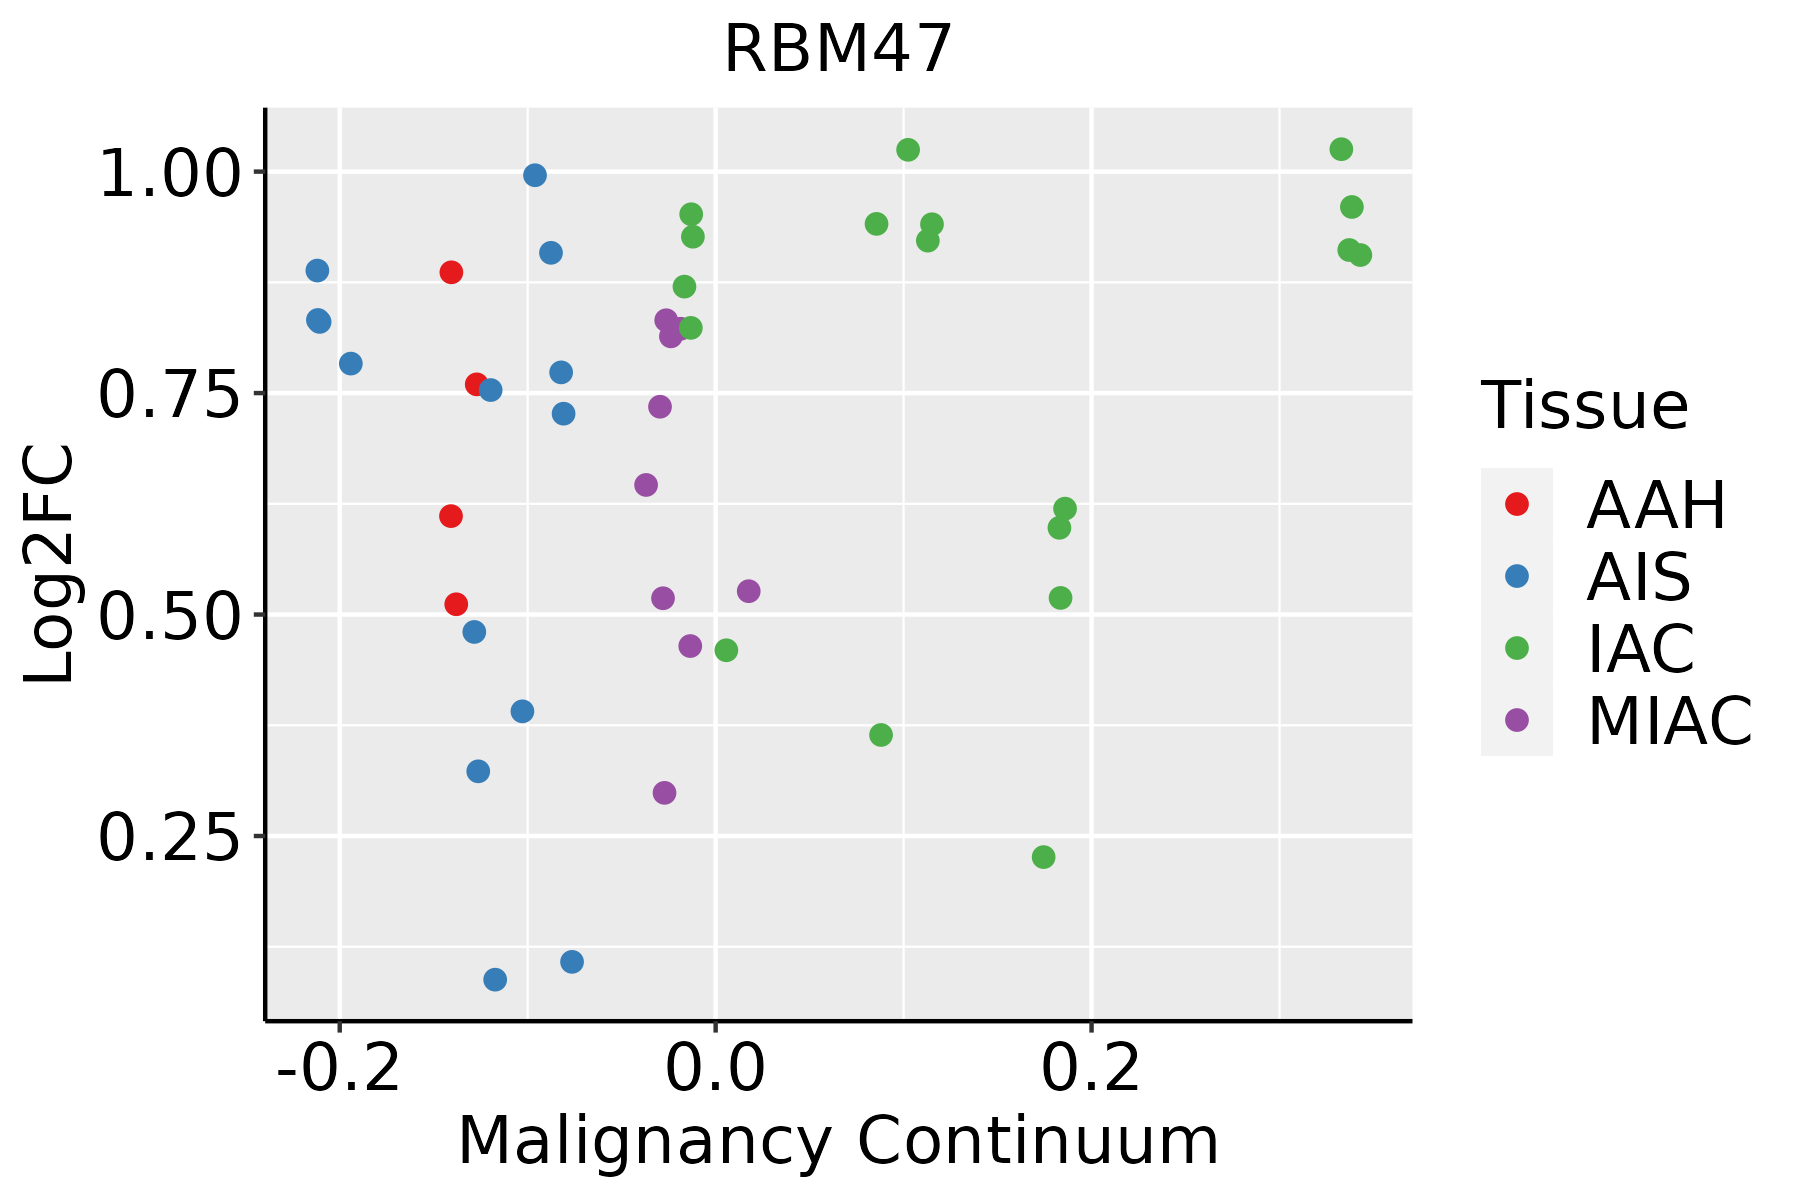 | AAH: Atypical adenomatous hyperplasia |
| AIS: Adenocarcinoma in situ | ||
| IAC: Invasive lung adenocarcinoma | ||
| MIA: Minimally invasive adenocarcinoma | ||
| Oral Cavity | 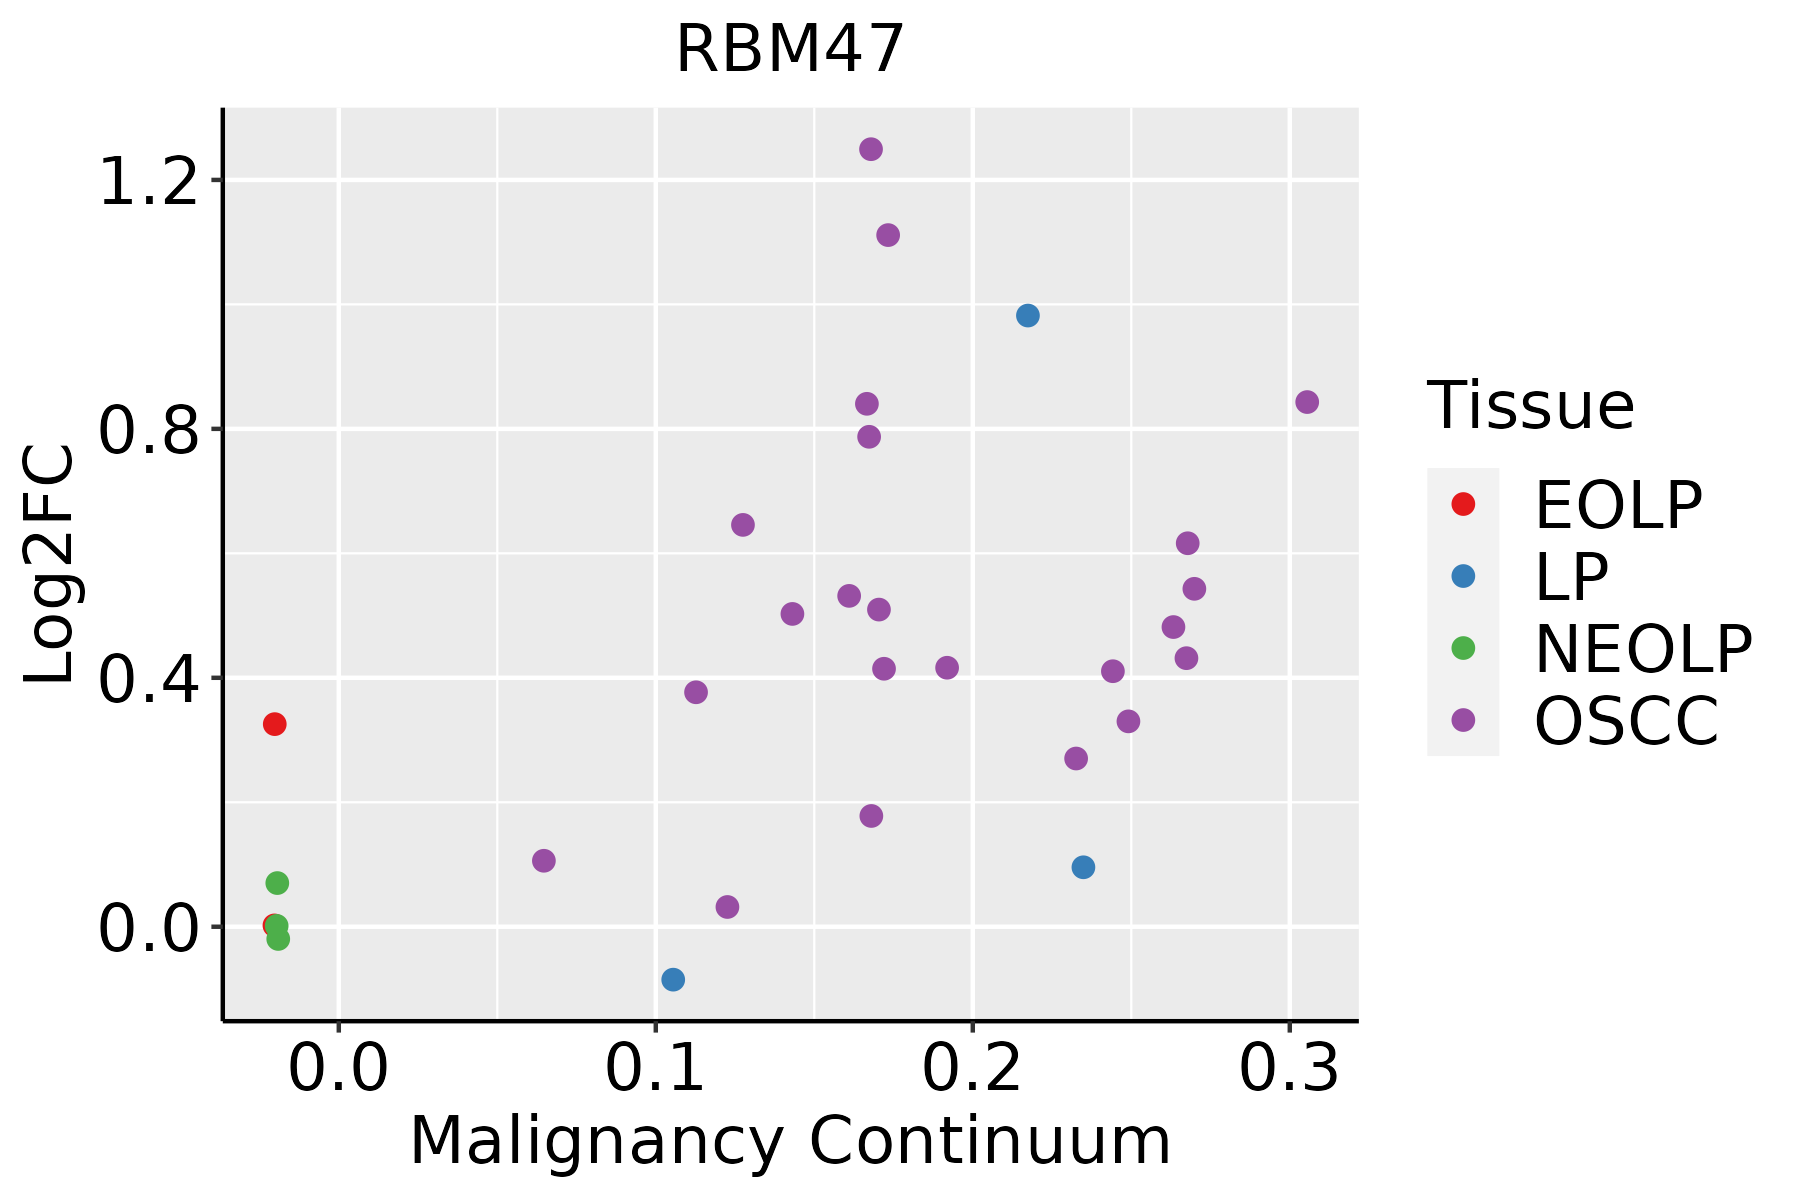 | EOLP: Erosive Oral lichen planus |
| LP: leukoplakia | ||
| NEOLP: Non-erosive oral lichen planus | ||
| OSCC: Oral squamous cell carcinoma | ||
| Prostate | 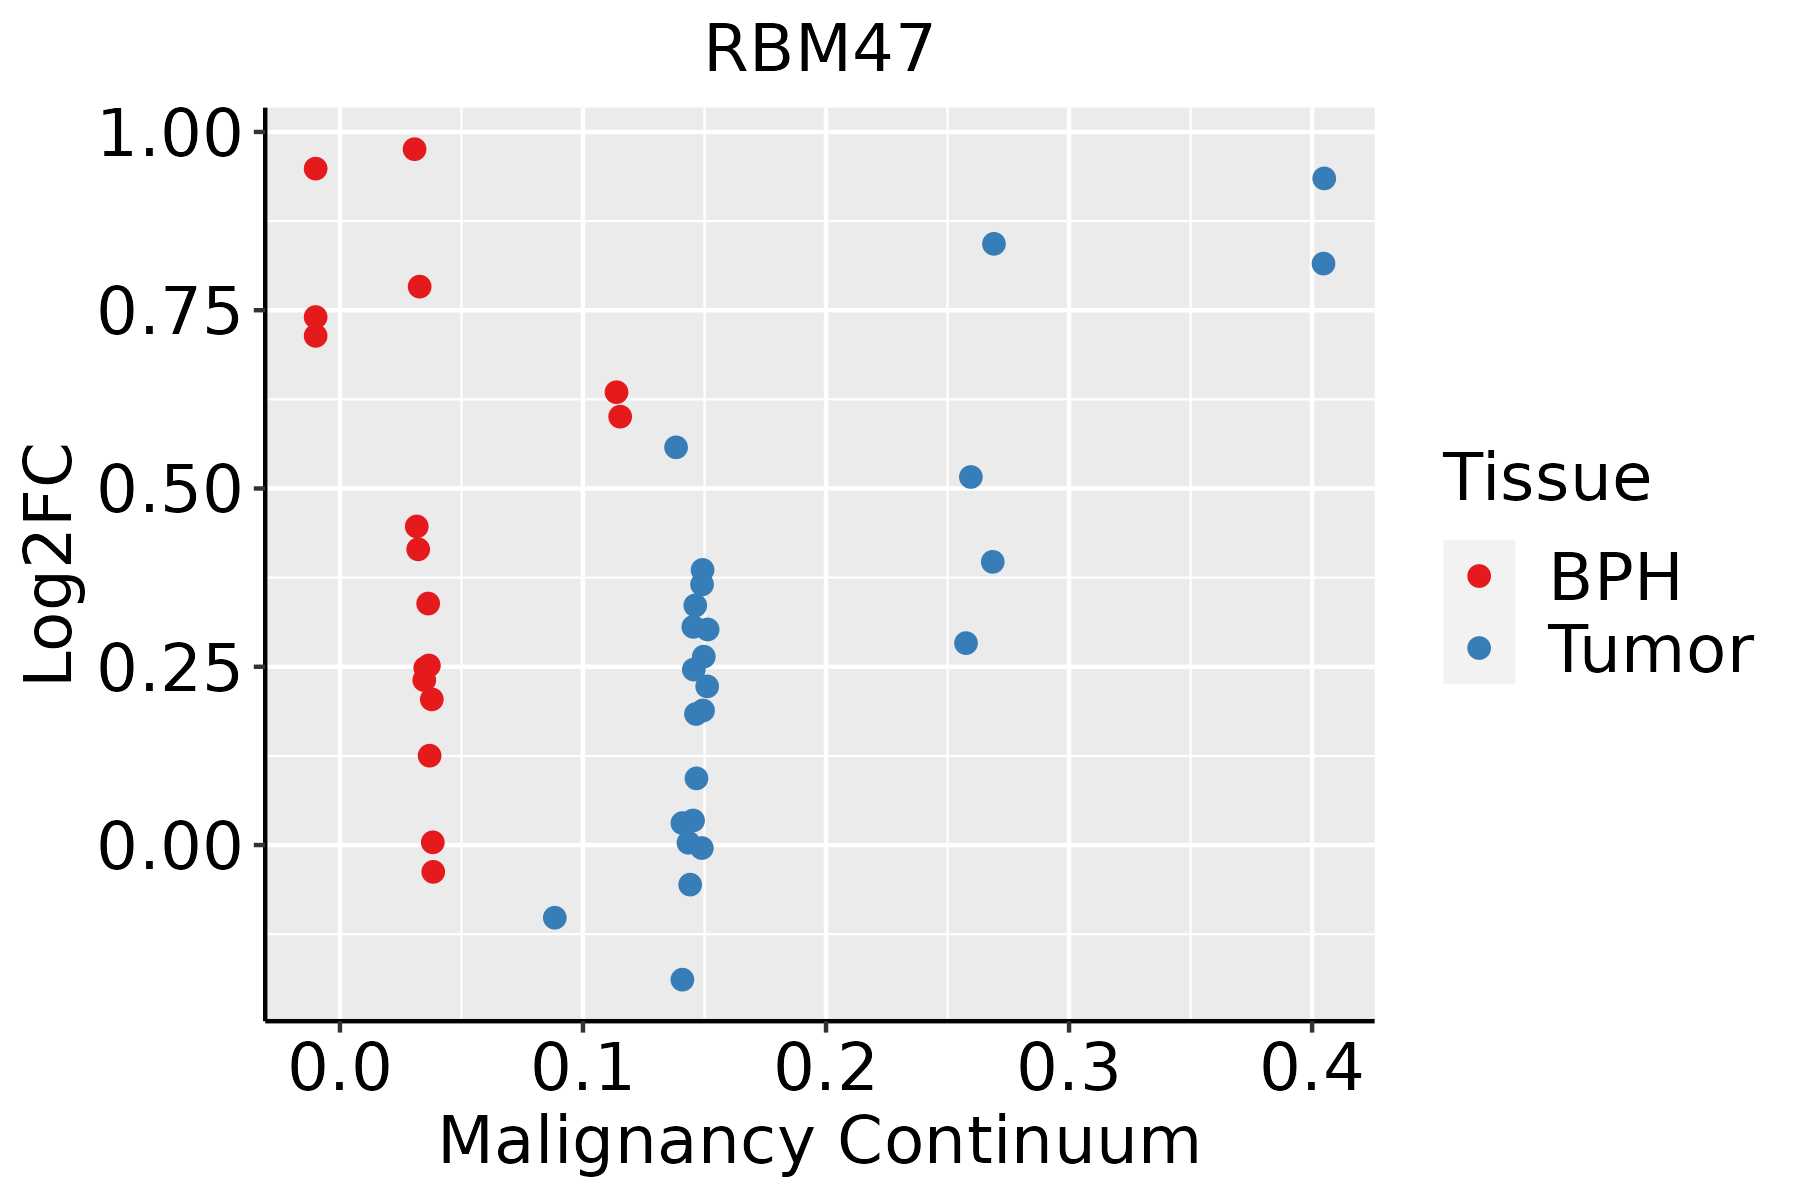 | BPH: Benign Prostatic Hyperplasia |
| Thyroid | 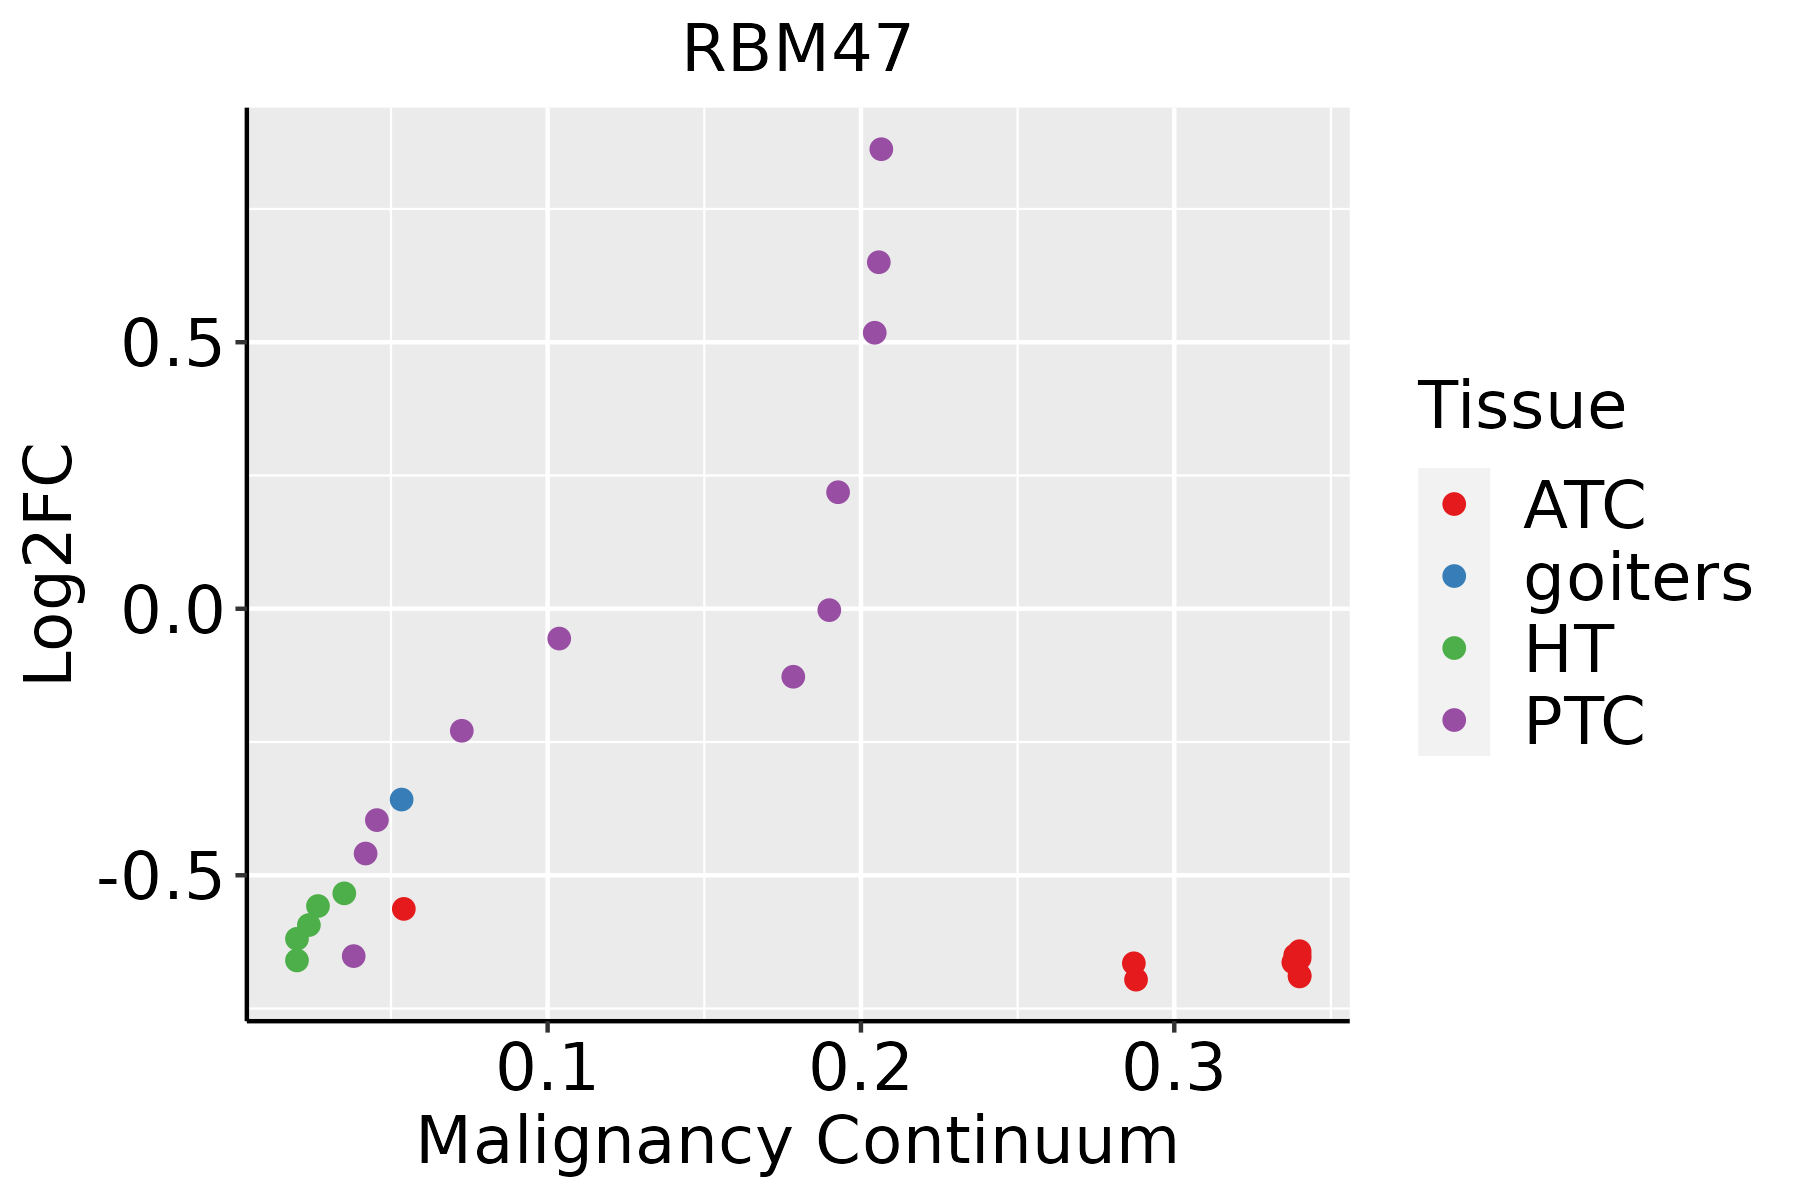 | ATC: Anaplastic thyroid cancer |
| HT: Hashimoto's thyroiditis | ||
| PTC: Papillary thyroid cancer |
| ∗log2FC in expression of this searched gene in stem-like cells from each diseased tissue sample relative to stem-like cells in normal samples in each tissue plotted against the malignancy continuum. Samples are colored based on if they are from different disease stage. |
Top |
Malignant transformation related pathway analysis |
| Find out the enriched GO biological processes and KEGG pathways involved in transition from healthy to precancer to cancer |
| Tissue | Disease Stage | Enriched GO biological Processes |
| Colorectum | AD |  |
| Colorectum | SER |  |
| Colorectum | MSS |  |
| Colorectum | MSI-H |  |
| Colorectum | FAP |  |
| ∗Top 15 enriched GO BP terms are showed in the bar plot of each disease state in each tissue. Each row represents a significant GO biological process which is colored according to the -log10(p.adjust). |
| Page: 1 2 3 4 5 6 7 8 9 |
| GO ID | Tissue | Disease Stage | Description | Gene Ratio | Bg Ratio | pvalue | p.adjust | Count |
| GO:00022443 | Cervix | CC | hematopoietic progenitor cell differentiation | 26/2311 | 114/18723 | 1.30e-03 | 1.03e-02 | 26 |
| GO:0002244 | Colorectum | MSS | hematopoietic progenitor cell differentiation | 32/3467 | 114/18723 | 8.07e-03 | 4.91e-02 | 32 |
| GO:00022441 | Colorectum | FAP | hematopoietic progenitor cell differentiation | 29/2622 | 114/18723 | 8.35e-04 | 8.71e-03 | 29 |
| GO:00022442 | Colorectum | CRC | hematopoietic progenitor cell differentiation | 23/2078 | 114/18723 | 3.20e-03 | 2.79e-02 | 23 |
| GO:00094512 | Esophagus | ESCC | RNA modification | 114/8552 | 167/18723 | 2.76e-09 | 6.04e-08 | 114 |
| GO:00022446 | Esophagus | ESCC | hematopoietic progenitor cell differentiation | 66/8552 | 114/18723 | 5.74e-03 | 2.13e-02 | 66 |
| GO:0009451 | Liver | HCC | RNA modification | 101/7958 | 167/18723 | 2.02e-06 | 2.78e-05 | 101 |
| GO:00094511 | Oral cavity | OSCC | RNA modification | 95/7305 | 167/18723 | 2.05e-06 | 2.62e-05 | 95 |
| GO:00022445 | Oral cavity | OSCC | hematopoietic progenitor cell differentiation | 57/7305 | 114/18723 | 1.09e-02 | 3.71e-02 | 57 |
| GO:00022444 | Prostate | BPH | hematopoietic progenitor cell differentiation | 34/3107 | 114/18723 | 3.08e-04 | 2.37e-03 | 34 |
| GO:000224411 | Prostate | Tumor | hematopoietic progenitor cell differentiation | 34/3246 | 114/18723 | 7.00e-04 | 4.92e-03 | 34 |
| GO:00022448 | Thyroid | ATC | hematopoietic progenitor cell differentiation | 51/6293 | 114/18723 | 8.62e-03 | 3.28e-02 | 51 |
| Page: 1 |
| Pathway ID | Tissue | Disease Stage | Description | Gene Ratio | Bg Ratio | pvalue | p.adjust | qvalue | Count |
| Page: 1 |
Top |
Cell-cell communication analysis |
| Identification of potential cell-cell interactions between two cell types and their ligand-receptor pairs for different disease states |
| Ligand | Receptor | LRpair | Pathway | Tissue | Disease Stage |
| Page: 1 |
Top |
Single-cell gene regulatory network inference analysis |
| Find out the significant the regulons (TFs) and the target genes of each regulon across cell types for different disease states |
| TF | Cell Type | Tissue | Disease Stage | Target Gene | RSS | Regulon Activity |
| ∗The dot plots of a searched regulon are shown for all cell subpopulations in each disease state of each tissue based on the regulon specific score inferred using pySCENIC and by calculating the average expression. |
| Page: 1 |
Top |
Somatic mutation of malignant transformation related genes |
| Annotation of somatic variants for genes involved in malignant transformation |
| Hugo Symbol | Variant Class | Variant Classification | dbSNP RS | HGVSc | HGVSp | HGVSp Short | SWISSPROT | BIOTYPE | SIFT | PolyPhen | Tumor Sample Barcode | Tissue | Histology | Sex | Age | Stage | Therapy Types | Drugs | Outcome |
| RBM47 | SNV | Missense_Mutation | c.1732N>A | p.Pro578Thr | p.P578T | A0AV96 | protein_coding | deleterious_low_confidence(0) | probably_damaging(0.915) | TCGA-A8-A08R-01 | Breast | breast invasive carcinoma | Female | <65 | I/II | Unknown | Unknown | SD | |
| RBM47 | SNV | Missense_Mutation | novel | c.710N>A | p.Val237Glu | p.V237E | A0AV96 | protein_coding | deleterious(0) | possibly_damaging(0.826) | TCGA-A8-A09E-01 | Breast | breast invasive carcinoma | Female | >=65 | III/IV | Hormone Therapy | anastrozole | SD |
| RBM47 | SNV | Missense_Mutation | novel | c.855N>A | p.Phe285Leu | p.F285L | A0AV96 | protein_coding | deleterious(0) | probably_damaging(0.922) | TCGA-C8-A273-01 | Breast | breast invasive carcinoma | Female | <65 | I/II | Hormone Therapy | tamoxiphen | SD |
| RBM47 | SNV | Missense_Mutation | c.883G>A | p.Val295Met | p.V295M | A0AV96 | protein_coding | tolerated(0.05) | benign(0.108) | TCGA-D8-A27G-01 | Breast | breast invasive carcinoma | Female | >=65 | I/II | Unknown | Unknown | SD | |
| RBM47 | insertion | Nonsense_Mutation | novel | c.660_661insTAGTCC | p.Gln220_Leu221insTer | p.Q220_L221ins* | A0AV96 | protein_coding | TCGA-A2-A0CX-01 | Breast | breast invasive carcinoma | Female | <65 | I/II | Chemotherapy | adriamycin | SD | ||
| RBM47 | insertion | Frame_Shift_Ins | novel | c.130_131insT | p.Tyr44LeufsTer64 | p.Y44Lfs*64 | A0AV96 | protein_coding | TCGA-A2-A0T2-01 | Breast | breast invasive carcinoma | Female | >=65 | III/IV | Chemotherapy | xeloda | PD | ||
| RBM47 | insertion | Nonsense_Mutation | novel | c.660_661insTAGTCC | p.Gln220_Leu221insTer | p.Q220_L221ins* | A0AV96 | protein_coding | TCGA-A8-A08T-01 | Breast | breast invasive carcinoma | Female | <65 | III/IV | Unknown | Unknown | PD | ||
| RBM47 | insertion | Frame_Shift_Ins | novel | c.811_812insAGAAGGCAGC | p.Pro271GlnfsTer38 | p.P271Qfs*38 | A0AV96 | protein_coding | TCGA-BH-A0B1-01 | Breast | breast invasive carcinoma | Female | >=65 | I/II | Chemotherapy | adriamycin | SD | ||
| RBM47 | deletion | Frame_Shift_Del | c.1761delN | p.Asp588ThrfsTer21 | p.D588Tfs*21 | A0AV96 | protein_coding | TCGA-D8-A27V-01 | Breast | breast invasive carcinoma | Female | <65 | I/II | Hormone Therapy | tamoxiphen | SD | |||
| RBM47 | deletion | Frame_Shift_Del | novel | c.1184delN | p.Gly395ValfsTer50 | p.G395Vfs*50 | A0AV96 | protein_coding | TCGA-D8-A27V-01 | Breast | breast invasive carcinoma | Female | <65 | I/II | Hormone Therapy | tamoxiphen | SD |
| Page: 1 2 3 4 5 6 7 8 |
Top |
Related drugs of malignant transformation related genes |
| Identification of chemicals and drugs interact with genes involved in malignant transfromation |
| (DGIdb 4.0) |
| Entrez ID | Symbol | Category | Interaction Types | Drug Claim Name | Drug Name | PMIDs |
| Page: 1 |

Copyright 2023-Present -The University of Texas Health Science Center at Houston |