
|
|||||
|
 | |
| |
| |
| |
| |
| |
|
Gene: RBM41 |
Gene summary for RBM41 |
| Gene information | Species | Human | Gene symbol | RBM41 | Gene ID | 55285 |
| Gene name | RNA binding motif protein 41 | |
| Gene Alias | RBM41 | |
| Cytomap | Xq22.3 | |
| Gene Type | protein-coding | GO ID | GO:0000375 | UniProtAcc | Q96IZ5 |
Top |
Malignant transformation analysis |
| Identification of the aberrant gene expression in precancerous and cancerous lesions by comparing the gene expression of stem-like cells in diseased tissues with normal stem cells |
| Entrez ID | Symbol | Replicates | Species | Organ | Tissue | Adj P-value | Log2FC | Malignancy |
| 55285 | RBM41 | LZE4T | Human | Esophagus | ESCC | 1.89e-05 | 2.05e-01 | 0.0811 |
| 55285 | RBM41 | LZE24T | Human | Esophagus | ESCC | 7.32e-17 | 3.64e-01 | 0.0596 |
| 55285 | RBM41 | LZE6T | Human | Esophagus | ESCC | 6.18e-04 | 2.69e-01 | 0.0845 |
| 55285 | RBM41 | P2T-E | Human | Esophagus | ESCC | 7.94e-14 | 3.20e-01 | 0.1177 |
| 55285 | RBM41 | P4T-E | Human | Esophagus | ESCC | 1.05e-10 | 2.46e-01 | 0.1323 |
| 55285 | RBM41 | P5T-E | Human | Esophagus | ESCC | 2.60e-02 | 4.64e-02 | 0.1327 |
| 55285 | RBM41 | P8T-E | Human | Esophagus | ESCC | 2.46e-11 | 1.91e-01 | 0.0889 |
| 55285 | RBM41 | P9T-E | Human | Esophagus | ESCC | 4.35e-10 | 1.82e-01 | 0.1131 |
| 55285 | RBM41 | P10T-E | Human | Esophagus | ESCC | 1.03e-09 | 1.92e-01 | 0.116 |
| 55285 | RBM41 | P11T-E | Human | Esophagus | ESCC | 4.67e-08 | 2.95e-01 | 0.1426 |
| 55285 | RBM41 | P12T-E | Human | Esophagus | ESCC | 3.13e-11 | 1.23e-01 | 0.1122 |
| 55285 | RBM41 | P15T-E | Human | Esophagus | ESCC | 7.86e-08 | 1.71e-01 | 0.1149 |
| 55285 | RBM41 | P16T-E | Human | Esophagus | ESCC | 1.94e-07 | 1.66e-01 | 0.1153 |
| 55285 | RBM41 | P20T-E | Human | Esophagus | ESCC | 9.97e-10 | 2.52e-01 | 0.1124 |
| 55285 | RBM41 | P21T-E | Human | Esophagus | ESCC | 4.76e-09 | 1.44e-01 | 0.1617 |
| 55285 | RBM41 | P22T-E | Human | Esophagus | ESCC | 7.74e-18 | 3.02e-01 | 0.1236 |
| 55285 | RBM41 | P24T-E | Human | Esophagus | ESCC | 4.52e-04 | 1.62e-01 | 0.1287 |
| 55285 | RBM41 | P26T-E | Human | Esophagus | ESCC | 4.34e-11 | 2.34e-01 | 0.1276 |
| 55285 | RBM41 | P27T-E | Human | Esophagus | ESCC | 2.10e-02 | 8.80e-02 | 0.1055 |
| 55285 | RBM41 | P28T-E | Human | Esophagus | ESCC | 4.03e-04 | 8.13e-02 | 0.1149 |
| Page: 1 2 3 4 |
| Tissue | Expression Dynamics | Abbreviation |
| Esophagus |  | ESCC: Esophageal squamous cell carcinoma |
| HGIN: High-grade intraepithelial neoplasias | ||
| LGIN: Low-grade intraepithelial neoplasias | ||
| Liver | 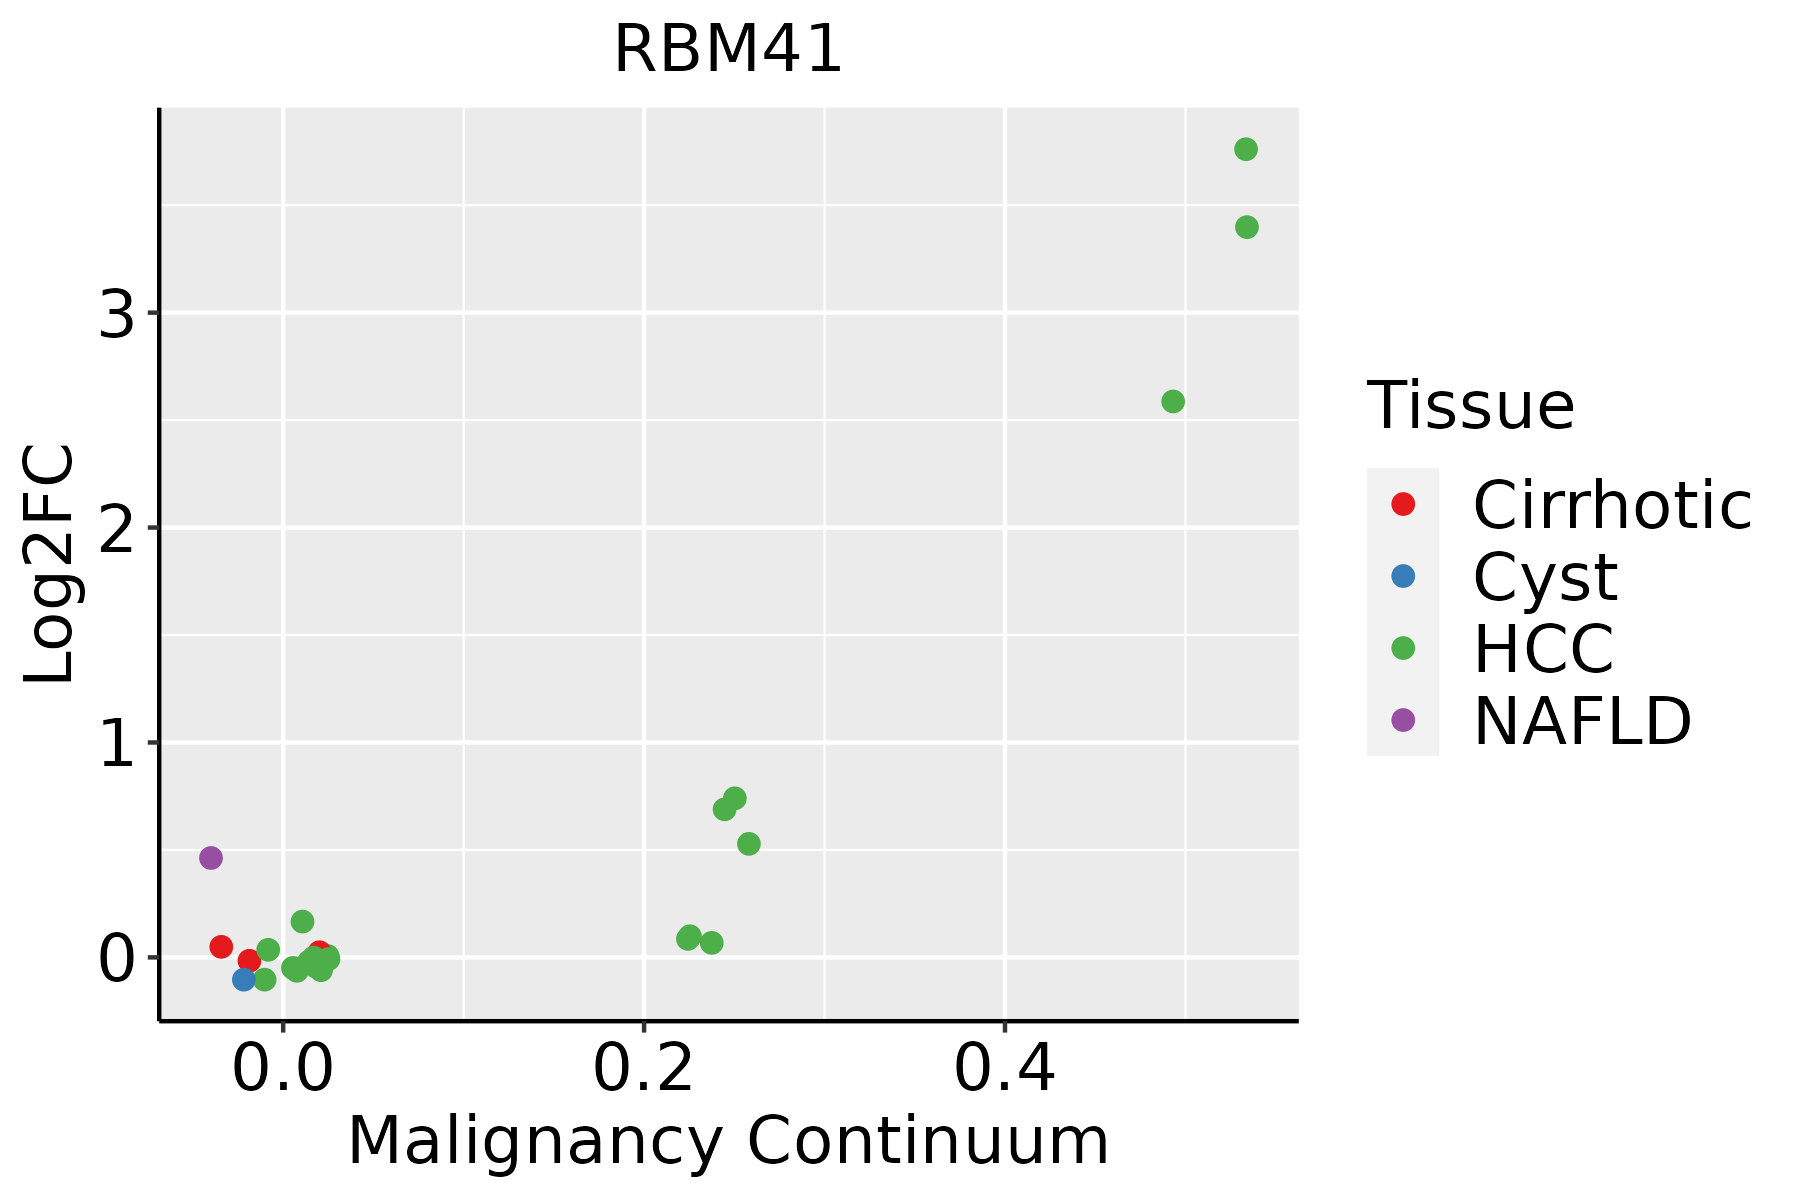 | HCC: Hepatocellular carcinoma |
| NAFLD: Non-alcoholic fatty liver disease | ||
| Thyroid |  | ATC: Anaplastic thyroid cancer |
| HT: Hashimoto's thyroiditis | ||
| PTC: Papillary thyroid cancer |
| ∗log2FC in expression of this searched gene in stem-like cells from each diseased tissue sample relative to stem-like cells in normal samples in each tissue plotted against the malignancy continuum. Samples are colored based on if they are from different disease stage. |
Top |
Malignant transformation related pathway analysis |
| Find out the enriched GO biological processes and KEGG pathways involved in transition from healthy to precancer to cancer |
| Tissue | Disease Stage | Enriched GO biological Processes |
| Colorectum | AD |  |
| Colorectum | SER |  |
| Colorectum | MSS |  |
| Colorectum | MSI-H |  |
| Colorectum | FAP |  |
| ∗Top 15 enriched GO BP terms are showed in the bar plot of each disease state in each tissue. Each row represents a significant GO biological process which is colored according to the -log10(p.adjust). |
| Page: 1 2 3 4 5 6 7 8 9 |
| GO ID | Tissue | Disease Stage | Description | Gene Ratio | Bg Ratio | pvalue | p.adjust | Count |
| GO:0008380111 | Esophagus | ESCC | RNA splicing | 336/8552 | 434/18723 | 1.74e-42 | 3.67e-39 | 336 |
| GO:0000375111 | Esophagus | ESCC | RNA splicing, via transesterification reactions | 248/8552 | 324/18723 | 3.05e-30 | 1.49e-27 | 248 |
| GO:0000377111 | Esophagus | ESCC | RNA splicing, via transesterification reactions with bulged adenosine as nucleophile | 244/8552 | 320/18723 | 2.52e-29 | 1.07e-26 | 244 |
| GO:0000398111 | Esophagus | ESCC | mRNA splicing, via spliceosome | 244/8552 | 320/18723 | 2.52e-29 | 1.07e-26 | 244 |
| GO:00083807 | Liver | NAFLD | RNA splicing | 70/1882 | 434/18723 | 4.62e-05 | 1.10e-03 | 70 |
| GO:00003777 | Liver | NAFLD | RNA splicing, via transesterification reactions with bulged adenosine as nucleophile | 51/1882 | 320/18723 | 6.21e-04 | 8.18e-03 | 51 |
| GO:00003987 | Liver | NAFLD | mRNA splicing, via spliceosome | 51/1882 | 320/18723 | 6.21e-04 | 8.18e-03 | 51 |
| GO:00003757 | Liver | NAFLD | RNA splicing, via transesterification reactions | 51/1882 | 324/18723 | 8.28e-04 | 1.02e-02 | 51 |
| GO:000838022 | Liver | HCC | RNA splicing | 313/7958 | 434/18723 | 1.36e-36 | 1.73e-33 | 313 |
| GO:000037522 | Liver | HCC | RNA splicing, via transesterification reactions | 228/7958 | 324/18723 | 1.47e-24 | 4.06e-22 | 228 |
| GO:000037722 | Liver | HCC | RNA splicing, via transesterification reactions with bulged adenosine as nucleophile | 224/7958 | 320/18723 | 1.16e-23 | 2.62e-21 | 224 |
| GO:000039822 | Liver | HCC | mRNA splicing, via spliceosome | 224/7958 | 320/18723 | 1.16e-23 | 2.62e-21 | 224 |
| GO:0008380113 | Thyroid | PTC | RNA splicing | 273/5968 | 434/18723 | 4.44e-41 | 1.40e-37 | 273 |
| GO:0000375113 | Thyroid | PTC | RNA splicing, via transesterification reactions | 202/5968 | 324/18723 | 6.81e-30 | 3.91e-27 | 202 |
| GO:0000377113 | Thyroid | PTC | RNA splicing, via transesterification reactions with bulged adenosine as nucleophile | 199/5968 | 320/18723 | 2.96e-29 | 1.44e-26 | 199 |
| GO:0000398113 | Thyroid | PTC | mRNA splicing, via spliceosome | 199/5968 | 320/18723 | 2.96e-29 | 1.44e-26 | 199 |
| GO:000838034 | Thyroid | ATC | RNA splicing | 270/6293 | 434/18723 | 7.50e-35 | 1.19e-31 | 270 |
| GO:000037534 | Thyroid | ATC | RNA splicing, via transesterification reactions | 200/6293 | 324/18723 | 1.75e-25 | 7.39e-23 | 200 |
| GO:000037734 | Thyroid | ATC | RNA splicing, via transesterification reactions with bulged adenosine as nucleophile | 197/6293 | 320/18723 | 6.54e-25 | 2.18e-22 | 197 |
| GO:000039834 | Thyroid | ATC | mRNA splicing, via spliceosome | 197/6293 | 320/18723 | 6.54e-25 | 2.18e-22 | 197 |
| Page: 1 |
| Pathway ID | Tissue | Disease Stage | Description | Gene Ratio | Bg Ratio | pvalue | p.adjust | qvalue | Count |
| Page: 1 |
Top |
Cell-cell communication analysis |
| Identification of potential cell-cell interactions between two cell types and their ligand-receptor pairs for different disease states |
| Ligand | Receptor | LRpair | Pathway | Tissue | Disease Stage |
| Page: 1 |
Top |
Single-cell gene regulatory network inference analysis |
| Find out the significant the regulons (TFs) and the target genes of each regulon across cell types for different disease states |
| TF | Cell Type | Tissue | Disease Stage | Target Gene | RSS | Regulon Activity |
| ∗The dot plots of a searched regulon are shown for all cell subpopulations in each disease state of each tissue based on the regulon specific score inferred using pySCENIC and by calculating the average expression. |
| Page: 1 |
Top |
Somatic mutation of malignant transformation related genes |
| Annotation of somatic variants for genes involved in malignant transformation |
| Hugo Symbol | Variant Class | Variant Classification | dbSNP RS | HGVSc | HGVSp | HGVSp Short | SWISSPROT | BIOTYPE | SIFT | PolyPhen | Tumor Sample Barcode | Tissue | Histology | Sex | Age | Stage | Therapy Types | Drugs | Outcome |
| RBM41 | SNV | Missense_Mutation | c.735N>C | p.Gln245His | p.Q245H | Q96IZ5 | protein_coding | tolerated(0.21) | benign(0.066) | TCGA-B6-A0X1-01 | Breast | breast invasive carcinoma | Female | <65 | I/II | Unknown | Unknown | PD | |
| RBM41 | SNV | Missense_Mutation | novel | c.374N>C | p.Glu125Ala | p.E125A | Q96IZ5 | protein_coding | deleterious(0.03) | benign(0.033) | TCGA-F5-6814-01 | Colorectum | rectum adenocarcinoma | Male | <65 | I/II | Unknown | Unknown | SD |
| RBM41 | deletion | Frame_Shift_Del | c.892_893delNN | p.Met298ValfsTer5 | p.M298Vfs*5 | Q96IZ5 | protein_coding | TCGA-A6-2686-01 | Colorectum | colon adenocarcinoma | Female | >=65 | I/II | Unknown | Unknown | SD | |||
| RBM41 | SNV | Missense_Mutation | novel | c.36G>T | p.Glu12Asp | p.E12D | Q96IZ5 | protein_coding | tolerated(0.38) | benign(0) | TCGA-A5-A1OF-01 | Endometrium | uterine corpus endometrioid carcinoma | Female | <65 | I/II | Unknown | Unknown | SD |
| RBM41 | SNV | Missense_Mutation | novel | c.265N>T | p.Gly89Trp | p.G89W | Q96IZ5 | protein_coding | deleterious(0) | probably_damaging(1) | TCGA-A5-A2K5-01 | Endometrium | uterine corpus endometrioid carcinoma | Female | >=65 | I/II | Unknown | Unknown | SD |
| RBM41 | SNV | Missense_Mutation | novel | c.520C>G | p.Gln174Glu | p.Q174E | Q96IZ5 | protein_coding | tolerated(0.11) | possibly_damaging(0.743) | TCGA-AJ-A3BK-01 | Endometrium | uterine corpus endometrioid carcinoma | Female | >=65 | I/II | Unknown | Unknown | SD |
| RBM41 | SNV | Missense_Mutation | rs757123103 | c.859N>T | p.Arg287Cys | p.R287C | Q96IZ5 | protein_coding | deleterious(0) | probably_damaging(0.999) | TCGA-AJ-A3EL-01 | Endometrium | uterine corpus endometrioid carcinoma | Female | <65 | I/II | Unknown | Unknown | SD |
| RBM41 | SNV | Missense_Mutation | novel | c.470N>A | p.Ser157Tyr | p.S157Y | Q96IZ5 | protein_coding | deleterious(0) | possibly_damaging(0.726) | TCGA-AJ-A3EL-01 | Endometrium | uterine corpus endometrioid carcinoma | Female | <65 | I/II | Unknown | Unknown | SD |
| RBM41 | SNV | Missense_Mutation | novel | c.282N>C | p.Glu94Asp | p.E94D | Q96IZ5 | protein_coding | deleterious(0) | probably_damaging(0.991) | TCGA-AJ-A3EL-01 | Endometrium | uterine corpus endometrioid carcinoma | Female | <65 | I/II | Unknown | Unknown | SD |
| RBM41 | SNV | Missense_Mutation | novel | c.490N>T | p.Arg164Cys | p.R164C | Q96IZ5 | protein_coding | deleterious(0) | probably_damaging(1) | TCGA-AP-A0LM-01 | Endometrium | uterine corpus endometrioid carcinoma | Female | <65 | III/IV | Chemotherapy | cisplatin | SD |
| Page: 1 2 3 4 5 |
Top |
Related drugs of malignant transformation related genes |
| Identification of chemicals and drugs interact with genes involved in malignant transfromation |
| (DGIdb 4.0) |
| Entrez ID | Symbol | Category | Interaction Types | Drug Claim Name | Drug Name | PMIDs |
| Page: 1 |

Copyright 2023-Present -The University of Texas Health Science Center at Houston |