
|
|||||
|
 | |
| |
| |
| |
| |
| |
|
Gene: RBM4 |
Gene summary for RBM4 |
| Gene information | Species | Human | Gene symbol | RBM4 | Gene ID | 5936 |
| Gene name | RNA binding motif protein 4 | |
| Gene Alias | LARK | |
| Cytomap | 11q13.2 | |
| Gene Type | protein-coding | GO ID | GO:0000375 | UniProtAcc | Q9BWF3 |
Top |
Malignant transformation analysis |
| Identification of the aberrant gene expression in precancerous and cancerous lesions by comparing the gene expression of stem-like cells in diseased tissues with normal stem cells |
| Entrez ID | Symbol | Replicates | Species | Organ | Tissue | Adj P-value | Log2FC | Malignancy |
| 5936 | RBM4 | HTA11_3410_2000001011 | Human | Colorectum | AD | 1.39e-04 | 2.59e-01 | 0.0155 |
| 5936 | RBM4 | HTA11_2487_2000001011 | Human | Colorectum | SER | 1.64e-12 | 6.76e-01 | -0.1808 |
| 5936 | RBM4 | HTA11_2951_2000001011 | Human | Colorectum | AD | 9.28e-03 | 6.44e-01 | 0.0216 |
| 5936 | RBM4 | HTA11_1938_2000001011 | Human | Colorectum | AD | 3.51e-14 | 7.49e-01 | -0.0811 |
| 5936 | RBM4 | HTA11_347_2000001011 | Human | Colorectum | AD | 4.11e-12 | 5.29e-01 | -0.1954 |
| 5936 | RBM4 | HTA11_2112_2000001011 | Human | Colorectum | SER | 3.87e-03 | 5.78e-01 | -0.2196 |
| 5936 | RBM4 | HTA11_3361_2000001011 | Human | Colorectum | AD | 5.02e-04 | 6.38e-01 | -0.1207 |
| 5936 | RBM4 | HTA11_696_2000001011 | Human | Colorectum | AD | 2.69e-21 | 6.31e-01 | -0.1464 |
| 5936 | RBM4 | HTA11_866_2000001011 | Human | Colorectum | AD | 2.98e-03 | 3.49e-01 | -0.1001 |
| 5936 | RBM4 | HTA11_1391_2000001011 | Human | Colorectum | AD | 1.19e-14 | 8.07e-01 | -0.059 |
| 5936 | RBM4 | HTA11_5212_2000001011 | Human | Colorectum | AD | 1.20e-04 | 5.90e-01 | -0.2061 |
| 5936 | RBM4 | HTA11_546_2000001011 | Human | Colorectum | AD | 1.21e-02 | 3.68e-01 | -0.0842 |
| 5936 | RBM4 | HTA11_866_3004761011 | Human | Colorectum | AD | 5.83e-16 | 6.80e-01 | 0.096 |
| 5936 | RBM4 | HTA11_4255_2000001011 | Human | Colorectum | SER | 2.41e-02 | 6.79e-01 | 0.0446 |
| 5936 | RBM4 | HTA11_8622_2000001021 | Human | Colorectum | SER | 4.20e-04 | 4.29e-01 | 0.0528 |
| 5936 | RBM4 | HTA11_7663_2000001011 | Human | Colorectum | SER | 6.32e-05 | 7.58e-01 | 0.0131 |
| 5936 | RBM4 | HTA11_10623_2000001011 | Human | Colorectum | AD | 1.88e-06 | 5.81e-01 | -0.0177 |
| 5936 | RBM4 | HTA11_6801_2000001011 | Human | Colorectum | SER | 8.45e-03 | 6.59e-01 | 0.0171 |
| 5936 | RBM4 | HTA11_10711_2000001011 | Human | Colorectum | AD | 1.84e-04 | 4.36e-01 | 0.0338 |
| 5936 | RBM4 | HTA11_7696_3000711011 | Human | Colorectum | AD | 7.86e-08 | 4.97e-01 | 0.0674 |
| Page: 1 2 3 4 5 6 7 8 9 |
| Tissue | Expression Dynamics | Abbreviation |
| Colorectum (GSE201348) |  | FAP: Familial adenomatous polyposis |
| CRC: Colorectal cancer | ||
| Colorectum (HTA11) |  | AD: Adenomas |
| SER: Sessile serrated lesions | ||
| MSI-H: Microsatellite-high colorectal cancer | ||
| MSS: Microsatellite stable colorectal cancer | ||
| Esophagus | 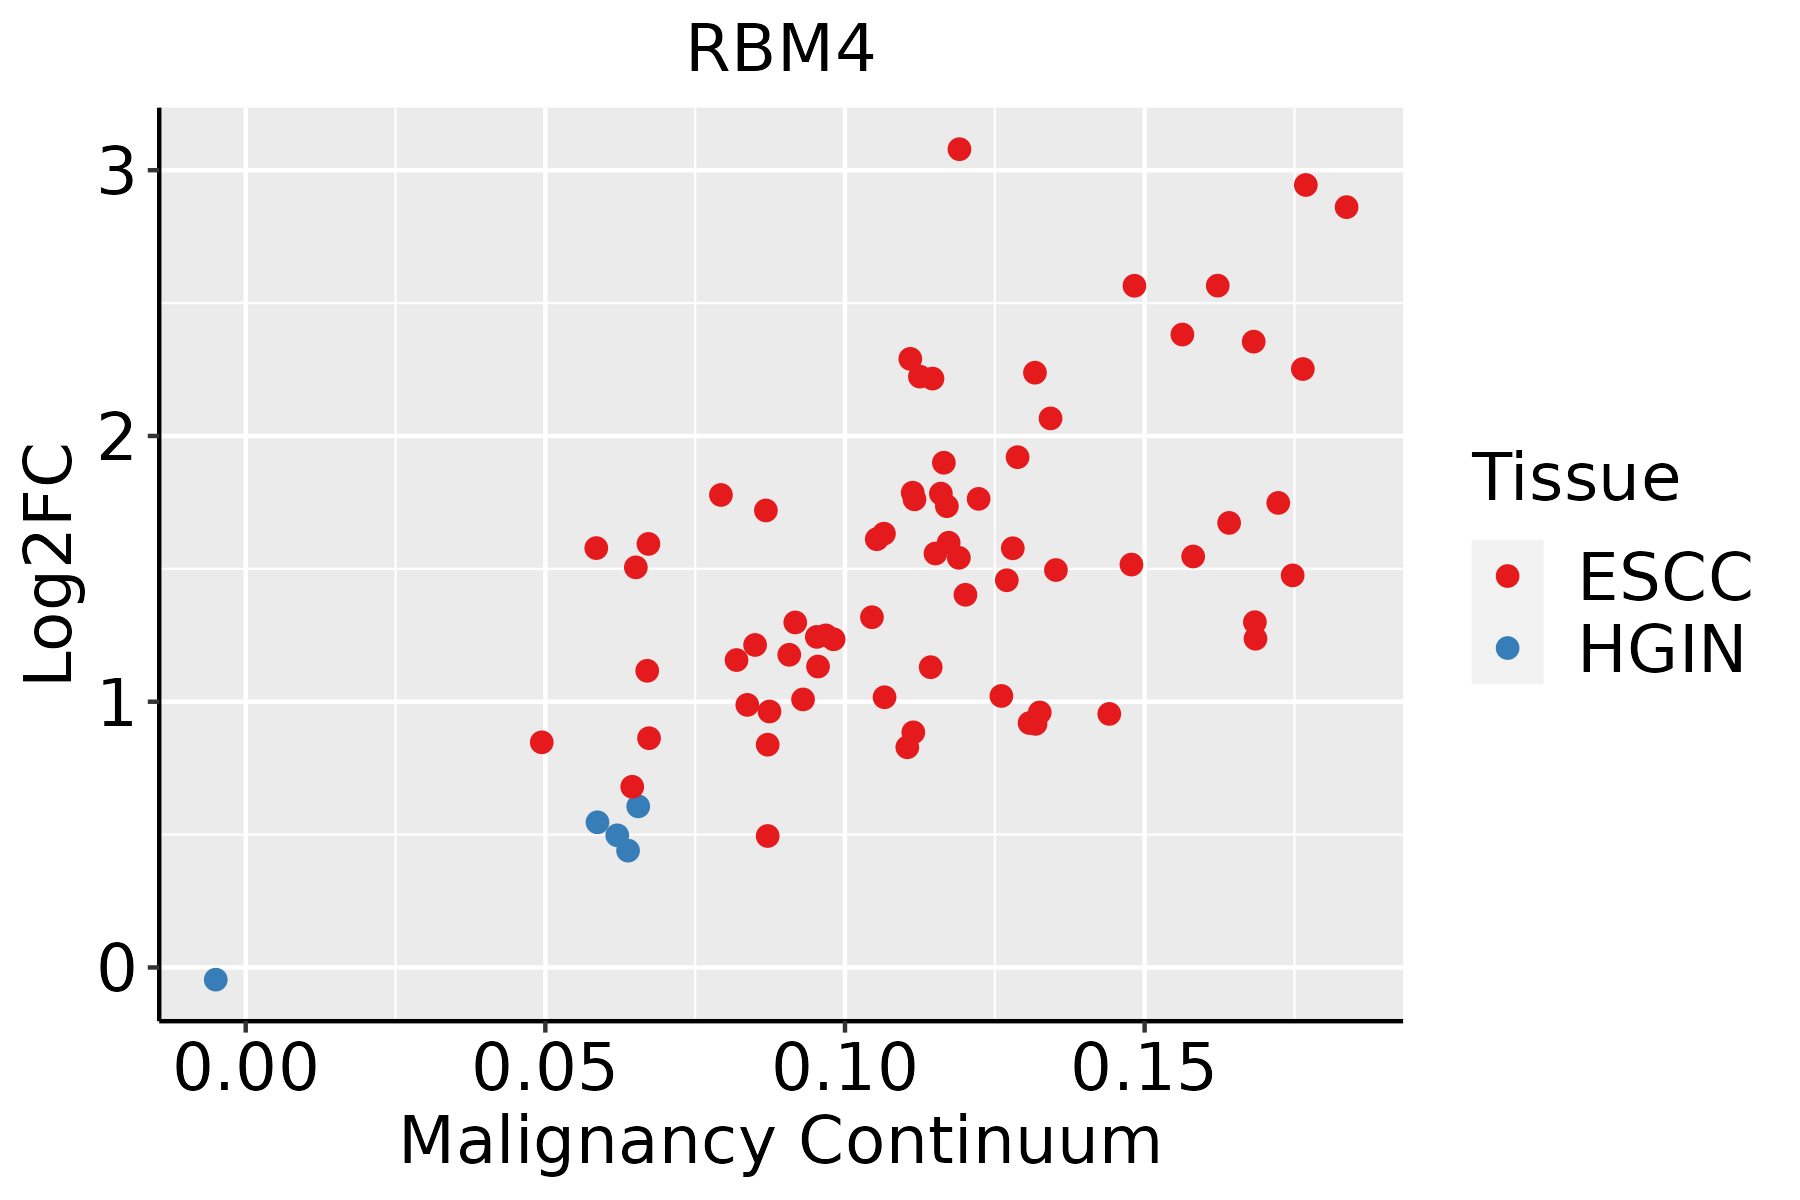 | ESCC: Esophageal squamous cell carcinoma |
| HGIN: High-grade intraepithelial neoplasias | ||
| LGIN: Low-grade intraepithelial neoplasias | ||
| Oral Cavity | 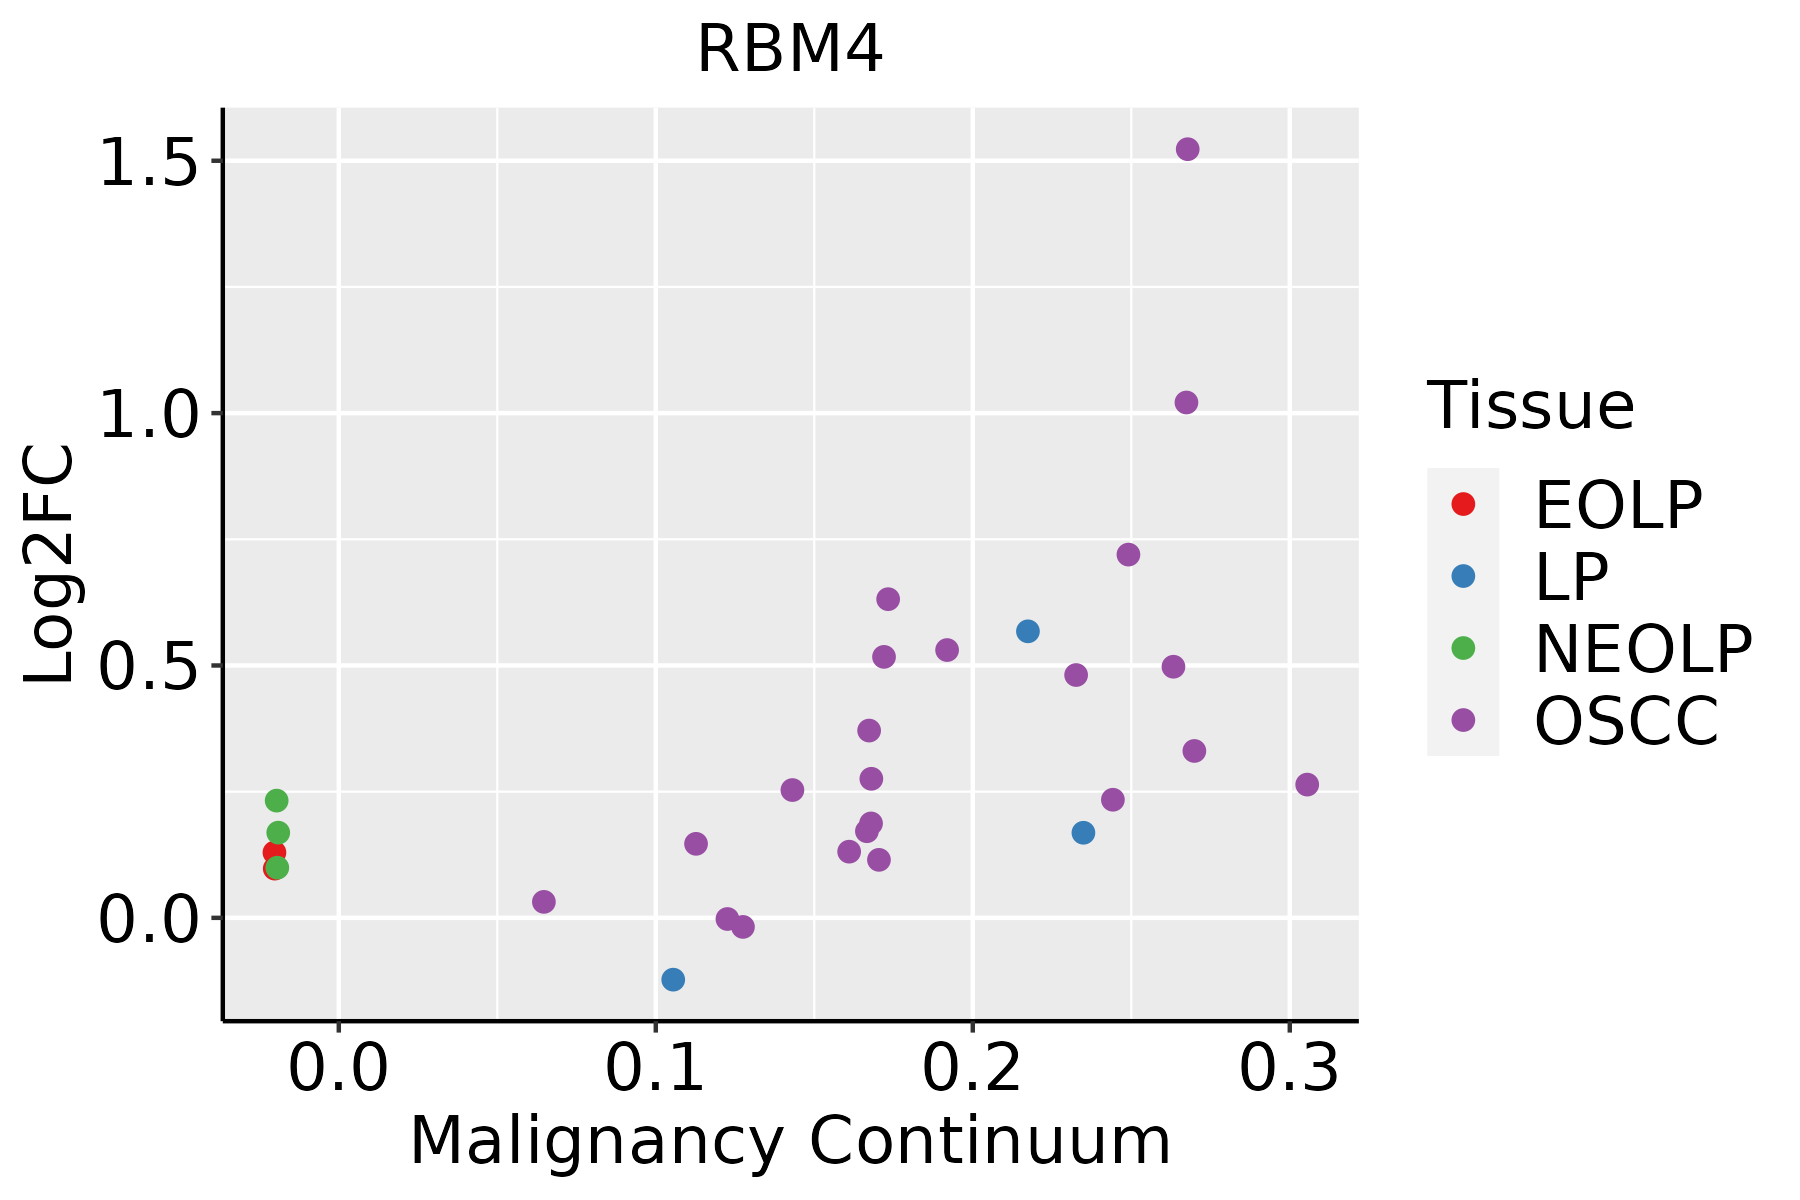 | EOLP: Erosive Oral lichen planus |
| LP: leukoplakia | ||
| NEOLP: Non-erosive oral lichen planus | ||
| OSCC: Oral squamous cell carcinoma | ||
| Prostate | 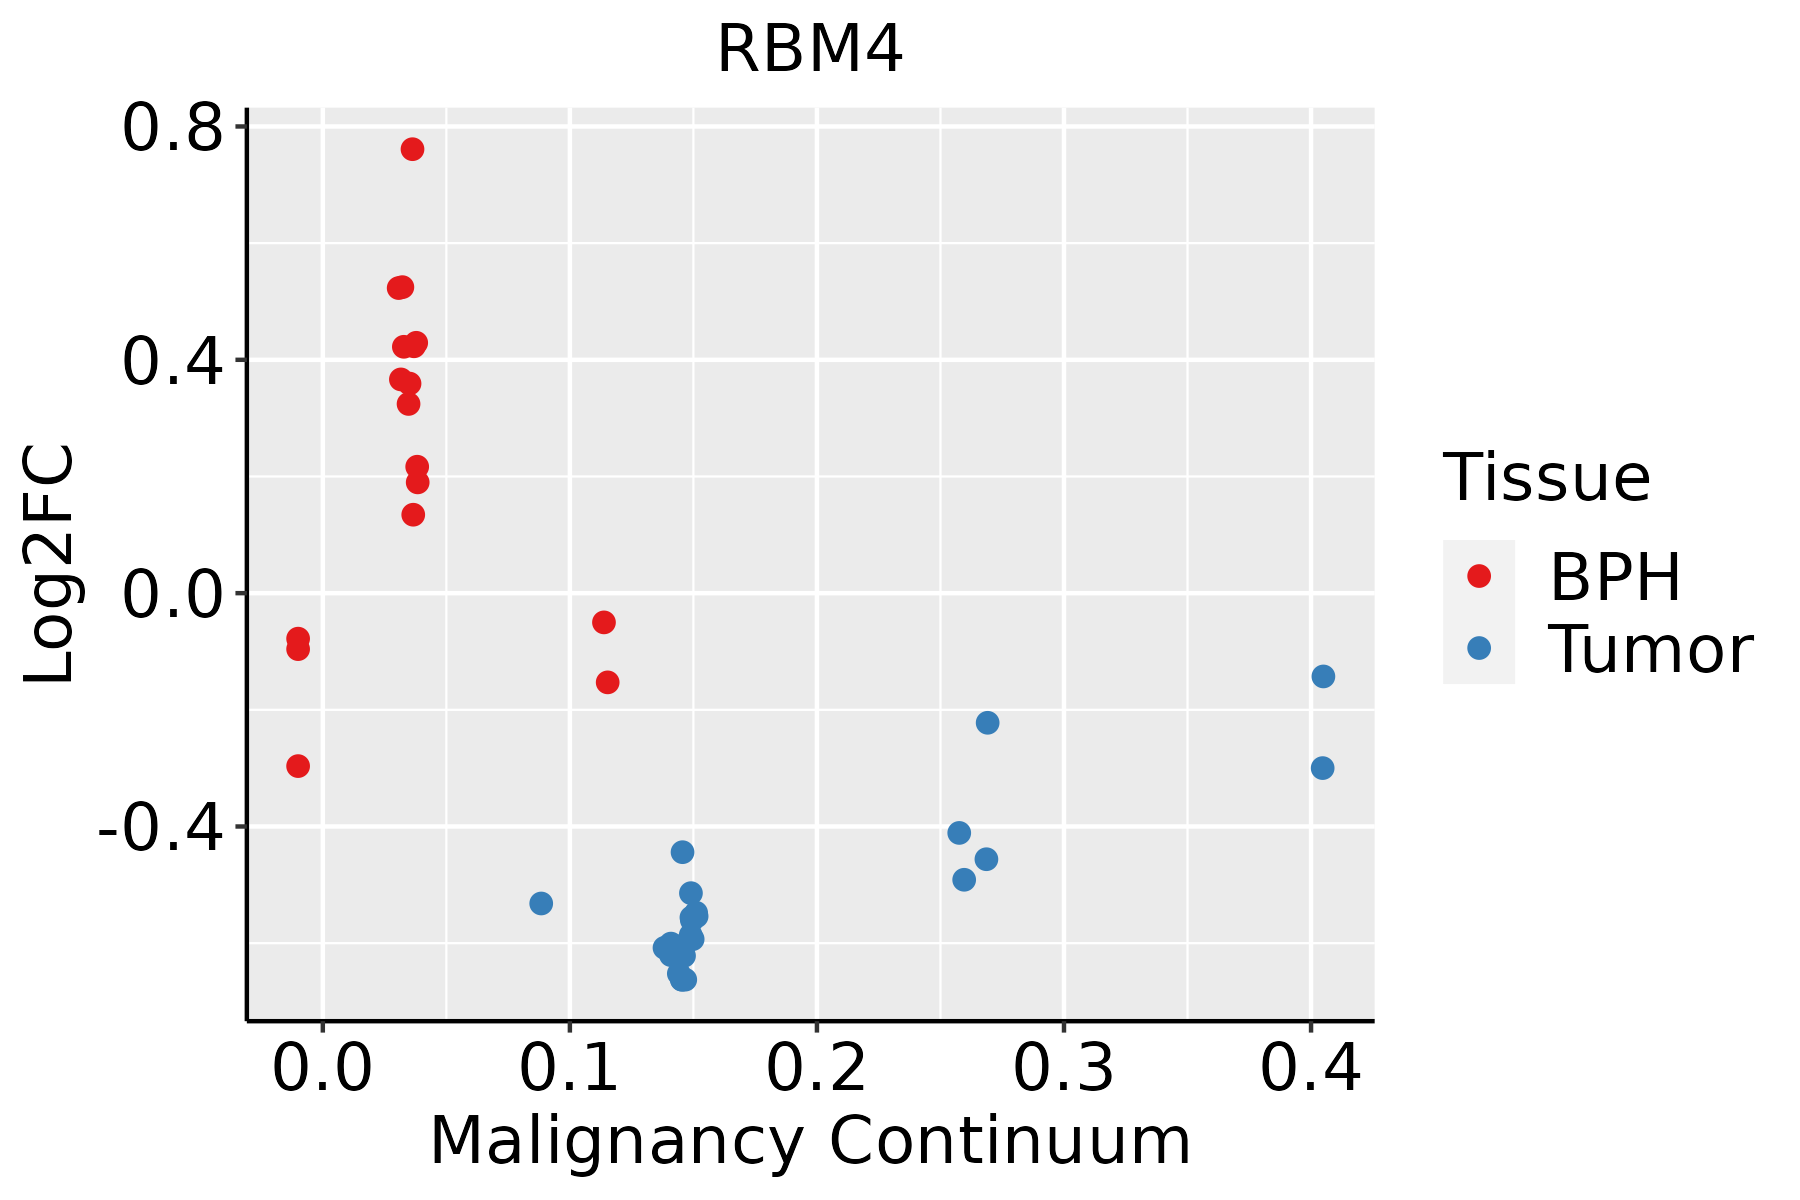 | BPH: Benign Prostatic Hyperplasia |
| Skin |  | AK: Actinic keratosis |
| cSCC: Cutaneous squamous cell carcinoma | ||
| SCCIS:squamous cell carcinoma in situ | ||
| Thyroid | 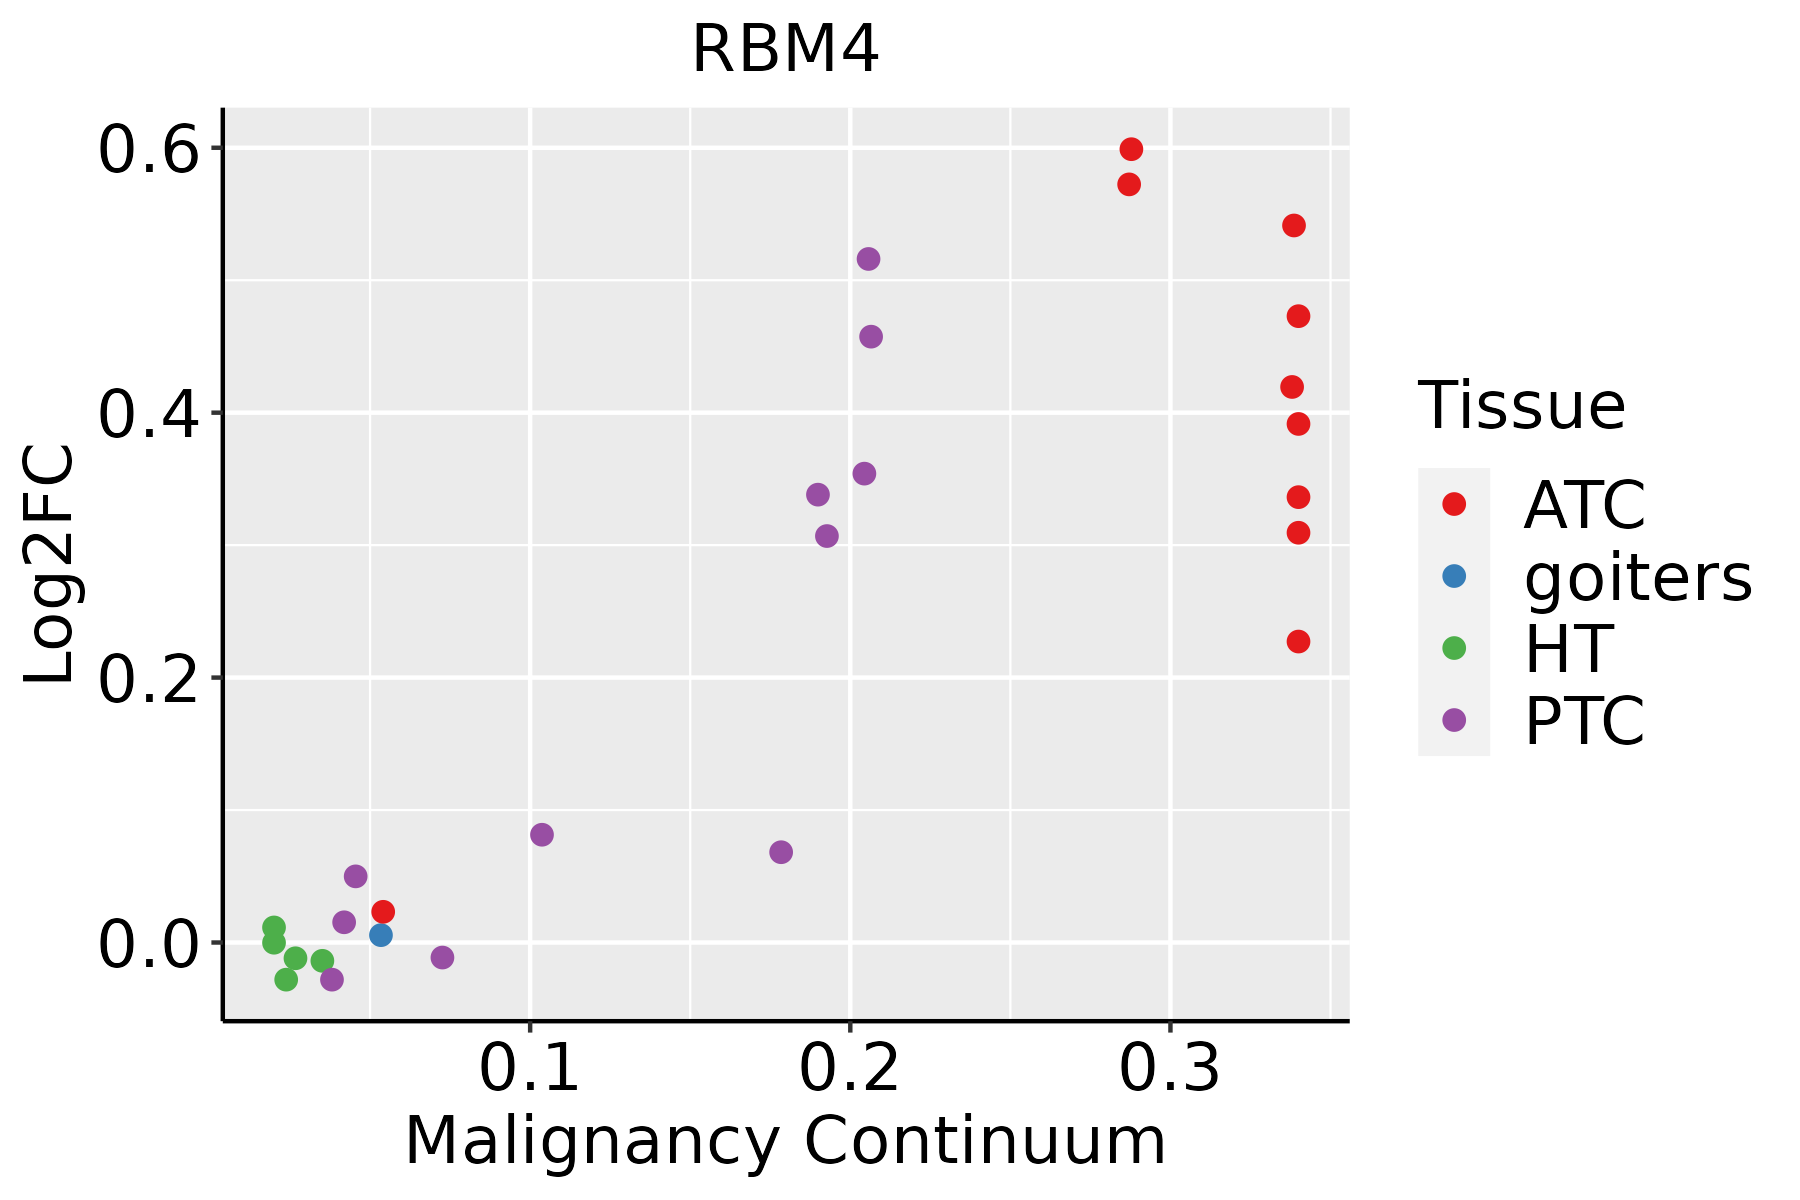 | ATC: Anaplastic thyroid cancer |
| HT: Hashimoto's thyroiditis | ||
| PTC: Papillary thyroid cancer |
| ∗log2FC in expression of this searched gene in stem-like cells from each diseased tissue sample relative to stem-like cells in normal samples in each tissue plotted against the malignancy continuum. Samples are colored based on if they are from different disease stage. |
Top |
Malignant transformation related pathway analysis |
| Find out the enriched GO biological processes and KEGG pathways involved in transition from healthy to precancer to cancer |
| Tissue | Disease Stage | Enriched GO biological Processes |
| Colorectum | AD |  |
| Colorectum | SER |  |
| Colorectum | MSS |  |
| Colorectum | MSI-H |  |
| Colorectum | FAP |  |
| ∗Top 15 enriched GO BP terms are showed in the bar plot of each disease state in each tissue. Each row represents a significant GO biological process which is colored according to the -log10(p.adjust). |
| Page: 1 2 3 4 5 6 7 8 9 |
| GO ID | Tissue | Disease Stage | Description | Gene Ratio | Bg Ratio | pvalue | p.adjust | Count |
| GO:00022443 | Cervix | CC | hematopoietic progenitor cell differentiation | 26/2311 | 114/18723 | 1.30e-03 | 1.03e-02 | 26 |
| GO:0002181 | Colorectum | AD | cytoplasmic translation | 109/3918 | 148/18723 | 3.40e-43 | 2.13e-39 | 109 |
| GO:0008380 | Colorectum | AD | RNA splicing | 169/3918 | 434/18723 | 3.59e-18 | 2.04e-15 | 169 |
| GO:0000377 | Colorectum | AD | RNA splicing, via transesterification reactions with bulged adenosine as nucleophile | 130/3918 | 320/18723 | 5.88e-16 | 2.16e-13 | 130 |
| GO:0000398 | Colorectum | AD | mRNA splicing, via spliceosome | 130/3918 | 320/18723 | 5.88e-16 | 2.16e-13 | 130 |
| GO:0000375 | Colorectum | AD | RNA splicing, via transesterification reactions | 131/3918 | 324/18723 | 7.11e-16 | 2.22e-13 | 131 |
| GO:1903311 | Colorectum | AD | regulation of mRNA metabolic process | 117/3918 | 288/18723 | 1.69e-14 | 4.23e-12 | 117 |
| GO:0043484 | Colorectum | AD | regulation of RNA splicing | 70/3918 | 148/18723 | 6.47e-13 | 1.16e-10 | 70 |
| GO:0048024 | Colorectum | AD | regulation of mRNA splicing, via spliceosome | 50/3918 | 101/18723 | 1.62e-10 | 1.56e-08 | 50 |
| GO:0050684 | Colorectum | AD | regulation of mRNA processing | 61/3918 | 137/18723 | 4.23e-10 | 3.58e-08 | 61 |
| GO:0006913 | Colorectum | AD | nucleocytoplasmic transport | 102/3918 | 301/18723 | 1.00e-07 | 4.85e-06 | 102 |
| GO:0051169 | Colorectum | AD | nuclear transport | 102/3918 | 301/18723 | 1.00e-07 | 4.85e-06 | 102 |
| GO:0002183 | Colorectum | AD | cytoplasmic translational initiation | 21/3918 | 34/18723 | 2.73e-07 | 1.09e-05 | 21 |
| GO:0032386 | Colorectum | AD | regulation of intracellular transport | 109/3918 | 337/18723 | 5.33e-07 | 1.95e-05 | 109 |
| GO:0006417 | Colorectum | AD | regulation of translation | 141/3918 | 468/18723 | 1.32e-06 | 4.22e-05 | 141 |
| GO:0007623 | Colorectum | AD | circadian rhythm | 72/3918 | 210/18723 | 4.50e-06 | 1.21e-04 | 72 |
| GO:0048511 | Colorectum | AD | rhythmic process | 94/3918 | 298/18723 | 1.00e-05 | 2.34e-04 | 94 |
| GO:0000380 | Colorectum | AD | alternative mRNA splicing, via spliceosome | 33/3918 | 77/18723 | 1.13e-05 | 2.55e-04 | 33 |
| GO:0006413 | Colorectum | AD | translational initiation | 45/3918 | 118/18723 | 1.35e-05 | 2.92e-04 | 45 |
| GO:0046822 | Colorectum | AD | regulation of nucleocytoplasmic transport | 41/3918 | 106/18723 | 2.17e-05 | 4.33e-04 | 41 |
| Page: 1 2 3 4 5 6 7 8 9 10 11 12 13 14 15 16 17 18 19 20 21 22 23 24 25 26 27 28 29 |
| Pathway ID | Tissue | Disease Stage | Description | Gene Ratio | Bg Ratio | pvalue | p.adjust | qvalue | Count |
| Page: 1 |
Top |
Cell-cell communication analysis |
| Identification of potential cell-cell interactions between two cell types and their ligand-receptor pairs for different disease states |
| Ligand | Receptor | LRpair | Pathway | Tissue | Disease Stage |
| Page: 1 |
Top |
Single-cell gene regulatory network inference analysis |
| Find out the significant the regulons (TFs) and the target genes of each regulon across cell types for different disease states |
| TF | Cell Type | Tissue | Disease Stage | Target Gene | RSS | Regulon Activity |
| ∗The dot plots of a searched regulon are shown for all cell subpopulations in each disease state of each tissue based on the regulon specific score inferred using pySCENIC and by calculating the average expression. |
| Page: 1 |
Top |
Somatic mutation of malignant transformation related genes |
| Annotation of somatic variants for genes involved in malignant transformation |
| Hugo Symbol | Variant Class | Variant Classification | dbSNP RS | HGVSc | HGVSp | HGVSp Short | SWISSPROT | BIOTYPE | SIFT | PolyPhen | Tumor Sample Barcode | Tissue | Histology | Sex | Age | Stage | Therapy Types | Drugs | Outcome |
| RBM4 | SNV | Missense_Mutation | c.477G>C | p.Gln159His | p.Q159H | Q9BWF3 | protein_coding | tolerated(0.33) | benign(0.007) | TCGA-AC-A23H-01 | Breast | breast invasive carcinoma | Female | >=65 | I/II | Unknown | Unknown | PD | |
| RBM4 | SNV | Missense_Mutation | rs771127066 | c.1079N>A | p.Arg360Gln | p.R360Q | Q9BWF3 | protein_coding | tolerated(0.09) | probably_damaging(0.968) | TCGA-C8-A135-01 | Breast | breast invasive carcinoma | Female | <65 | I/II | Chemotherapy | 5-fluorouracil | CR |
| RBM4 | SNV | Missense_Mutation | c.286N>A | p.Ala96Thr | p.A96T | Q9BWF3 | protein_coding | tolerated(0.09) | benign(0.292) | TCGA-D8-A1XQ-01 | Breast | breast invasive carcinoma | Female | >=65 | I/II | Unknown | Unknown | SD | |
| RBM4 | insertion | Frame_Shift_Ins | novel | c.751_752insT | p.Gln251LeufsTer24 | p.Q251Lfs*24 | Q9BWF3 | protein_coding | TCGA-A8-A0A6-01 | Breast | breast invasive carcinoma | Female | <65 | III/IV | Chemotherapy | epirubicin | CR | ||
| RBM4 | insertion | Frame_Shift_Ins | novel | c.753_754insATGTCCTCTTCCCTCTTGCCATCGTG | p.Leu252MetfsTer125 | p.L252Mfs*125 | Q9BWF3 | protein_coding | TCGA-A8-A0A6-01 | Breast | breast invasive carcinoma | Female | <65 | III/IV | Chemotherapy | epirubicin | CR | ||
| RBM4 | SNV | Missense_Mutation | rs752990000 | c.721G>A | p.Val241Met | p.V241M | Q9BWF3 | protein_coding | tolerated(0.21) | benign(0.003) | TCGA-C5-A1ML-01 | Cervix | cervical & endocervical cancer | Female | <65 | I/II | Unknown | Unknown | PD |
| RBM4 | SNV | Missense_Mutation | c.359G>A | p.Arg120Gln | p.R120Q | Q9BWF3 | protein_coding | tolerated(0.07) | benign(0.124) | TCGA-AA-3811-01 | Colorectum | colon adenocarcinoma | Female | >=65 | III/IV | Unknown | Unknown | PD | |
| RBM4 | SNV | Missense_Mutation | rs765301901 | c.158N>A | p.Arg53His | p.R53H | Q9BWF3 | protein_coding | tolerated(0.1) | benign(0.075) | TCGA-AA-3821-01 | Colorectum | colon adenocarcinoma | Female | >=65 | I/II | Unknown | Unknown | SD |
| RBM4 | SNV | Missense_Mutation | c.245N>C | p.Val82Ala | p.V82A | Q9BWF3 | protein_coding | deleterious(0) | probably_damaging(0.996) | TCGA-AD-6889-01 | Colorectum | colon adenocarcinoma | Male | >=65 | I/II | Chemotherapy | xeloda | PD | |
| RBM4 | SNV | Missense_Mutation | c.1046N>A | p.Arg349Gln | p.R349Q | Q9BWF3 | protein_coding | deleterious(0.02) | benign(0.174) | TCGA-AZ-6601-01 | Colorectum | colon adenocarcinoma | Male | >=65 | I/II | Unknown | Unknown | PD |
| Page: 1 2 3 4 |
Top |
Related drugs of malignant transformation related genes |
| Identification of chemicals and drugs interact with genes involved in malignant transfromation |
| (DGIdb 4.0) |
| Entrez ID | Symbol | Category | Interaction Types | Drug Claim Name | Drug Name | PMIDs |
| Page: 1 |

Copyright 2023-Present -The University of Texas Health Science Center at Houston |