
|
|||||
|
 | |
| |
| |
| |
| |
| |
|
Gene: RBM33 |
Gene summary for RBM33 |
| Gene information | Species | Human | Gene symbol | RBM33 | Gene ID | 155435 |
| Gene name | RNA binding motif protein 33 | |
| Gene Alias | PRR8 | |
| Cytomap | 7q36.3 | |
| Gene Type | protein-coding | GO ID | GO:0003674 | UniProtAcc | Q96EV2 |
Top |
Malignant transformation analysis |
| Identification of the aberrant gene expression in precancerous and cancerous lesions by comparing the gene expression of stem-like cells in diseased tissues with normal stem cells |
| Entrez ID | Symbol | Replicates | Species | Organ | Tissue | Adj P-value | Log2FC | Malignancy |
| 155435 | RBM33 | CA_HPV_1 | Human | Cervix | CC | 1.87e-04 | -9.60e-02 | 0.0264 |
| 155435 | RBM33 | CCI_2 | Human | Cervix | CC | 4.26e-03 | 5.96e-01 | 0.5249 |
| 155435 | RBM33 | CCI_3 | Human | Cervix | CC | 3.47e-03 | 5.46e-01 | 0.516 |
| 155435 | RBM33 | HTA11_3410_2000001011 | Human | Colorectum | AD | 3.16e-15 | -5.23e-01 | 0.0155 |
| 155435 | RBM33 | HTA11_2951_2000001011 | Human | Colorectum | AD | 3.53e-02 | -6.74e-01 | 0.0216 |
| 155435 | RBM33 | HTA11_3361_2000001011 | Human | Colorectum | AD | 6.69e-05 | -5.28e-01 | -0.1207 |
| 155435 | RBM33 | HTA11_696_2000001011 | Human | Colorectum | AD | 5.21e-08 | -3.45e-01 | -0.1464 |
| 155435 | RBM33 | HTA11_866_2000001011 | Human | Colorectum | AD | 3.17e-05 | -3.58e-01 | -0.1001 |
| 155435 | RBM33 | HTA11_866_3004761011 | Human | Colorectum | AD | 3.79e-08 | -4.44e-01 | 0.096 |
| 155435 | RBM33 | HTA11_8622_2000001021 | Human | Colorectum | SER | 1.11e-02 | -5.48e-01 | 0.0528 |
| 155435 | RBM33 | HTA11_10711_2000001011 | Human | Colorectum | AD | 1.87e-03 | -4.54e-01 | 0.0338 |
| 155435 | RBM33 | HTA11_7696_3000711011 | Human | Colorectum | AD | 1.74e-11 | -4.52e-01 | 0.0674 |
| 155435 | RBM33 | HTA11_99999971662_82457 | Human | Colorectum | MSS | 3.84e-04 | -2.57e-01 | 0.3859 |
| 155435 | RBM33 | HTA11_99999974143_84620 | Human | Colorectum | MSS | 3.58e-11 | -4.88e-01 | 0.3005 |
| 155435 | RBM33 | A002-C-010 | Human | Colorectum | FAP | 2.97e-03 | -7.78e-02 | 0.242 |
| 155435 | RBM33 | A015-C-203 | Human | Colorectum | FAP | 2.23e-29 | -3.38e-01 | -0.1294 |
| 155435 | RBM33 | A015-C-204 | Human | Colorectum | FAP | 4.65e-04 | -1.23e-01 | -0.0228 |
| 155435 | RBM33 | A014-C-040 | Human | Colorectum | FAP | 1.05e-05 | -2.16e-01 | -0.1184 |
| 155435 | RBM33 | A002-C-201 | Human | Colorectum | FAP | 3.78e-11 | -2.37e-01 | 0.0324 |
| 155435 | RBM33 | A002-C-203 | Human | Colorectum | FAP | 1.48e-04 | 1.53e-01 | 0.2786 |
| Page: 1 2 3 4 5 6 7 8 9 |
| Tissue | Expression Dynamics | Abbreviation |
| Cervix |  | CC: Cervix cancer |
| HSIL_HPV: HPV-infected high-grade squamous intraepithelial lesions | ||
| N_HPV: HPV-infected normal cervix | ||
| Colorectum (GSE201348) |  | FAP: Familial adenomatous polyposis |
| CRC: Colorectal cancer | ||
| Colorectum (HTA11) |  | AD: Adenomas |
| SER: Sessile serrated lesions | ||
| MSI-H: Microsatellite-high colorectal cancer | ||
| MSS: Microsatellite stable colorectal cancer | ||
| Esophagus | 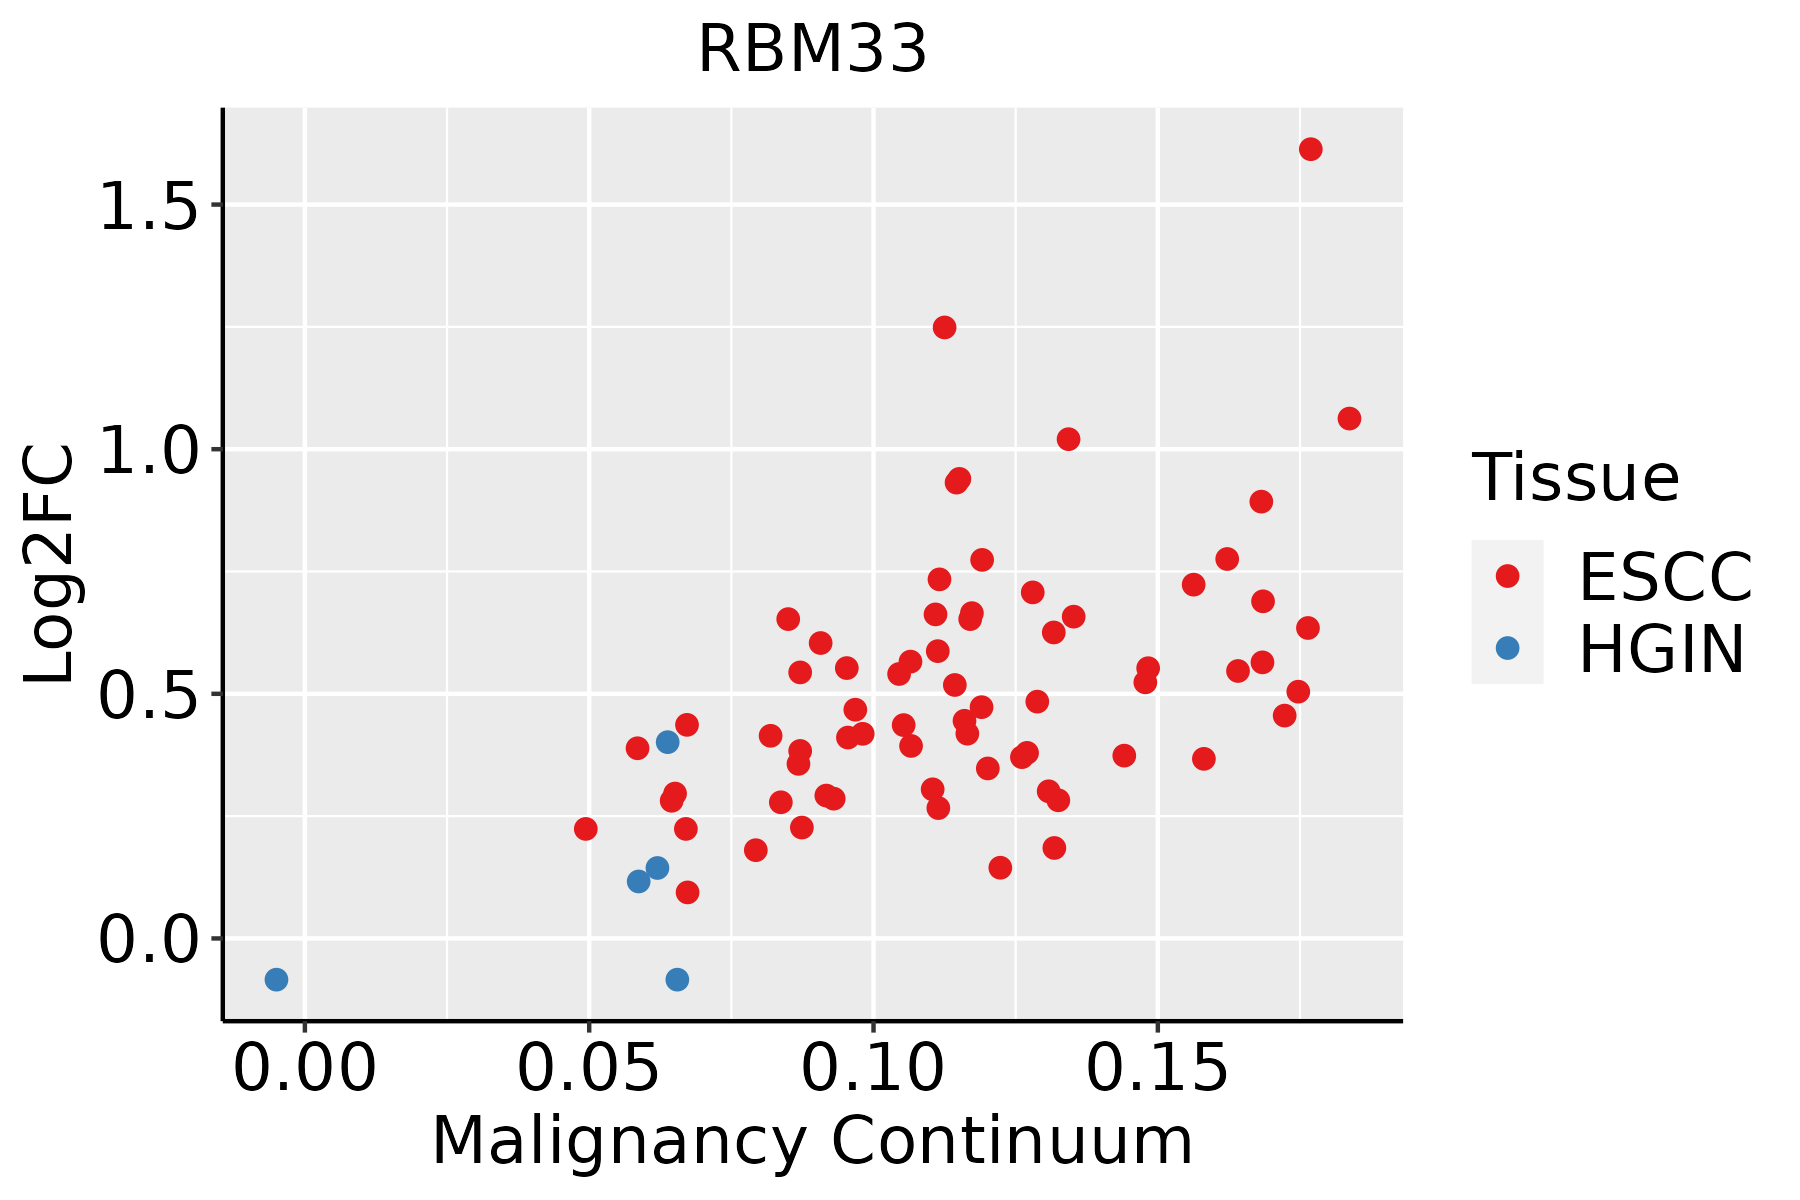 | ESCC: Esophageal squamous cell carcinoma |
| HGIN: High-grade intraepithelial neoplasias | ||
| LGIN: Low-grade intraepithelial neoplasias | ||
| Liver | 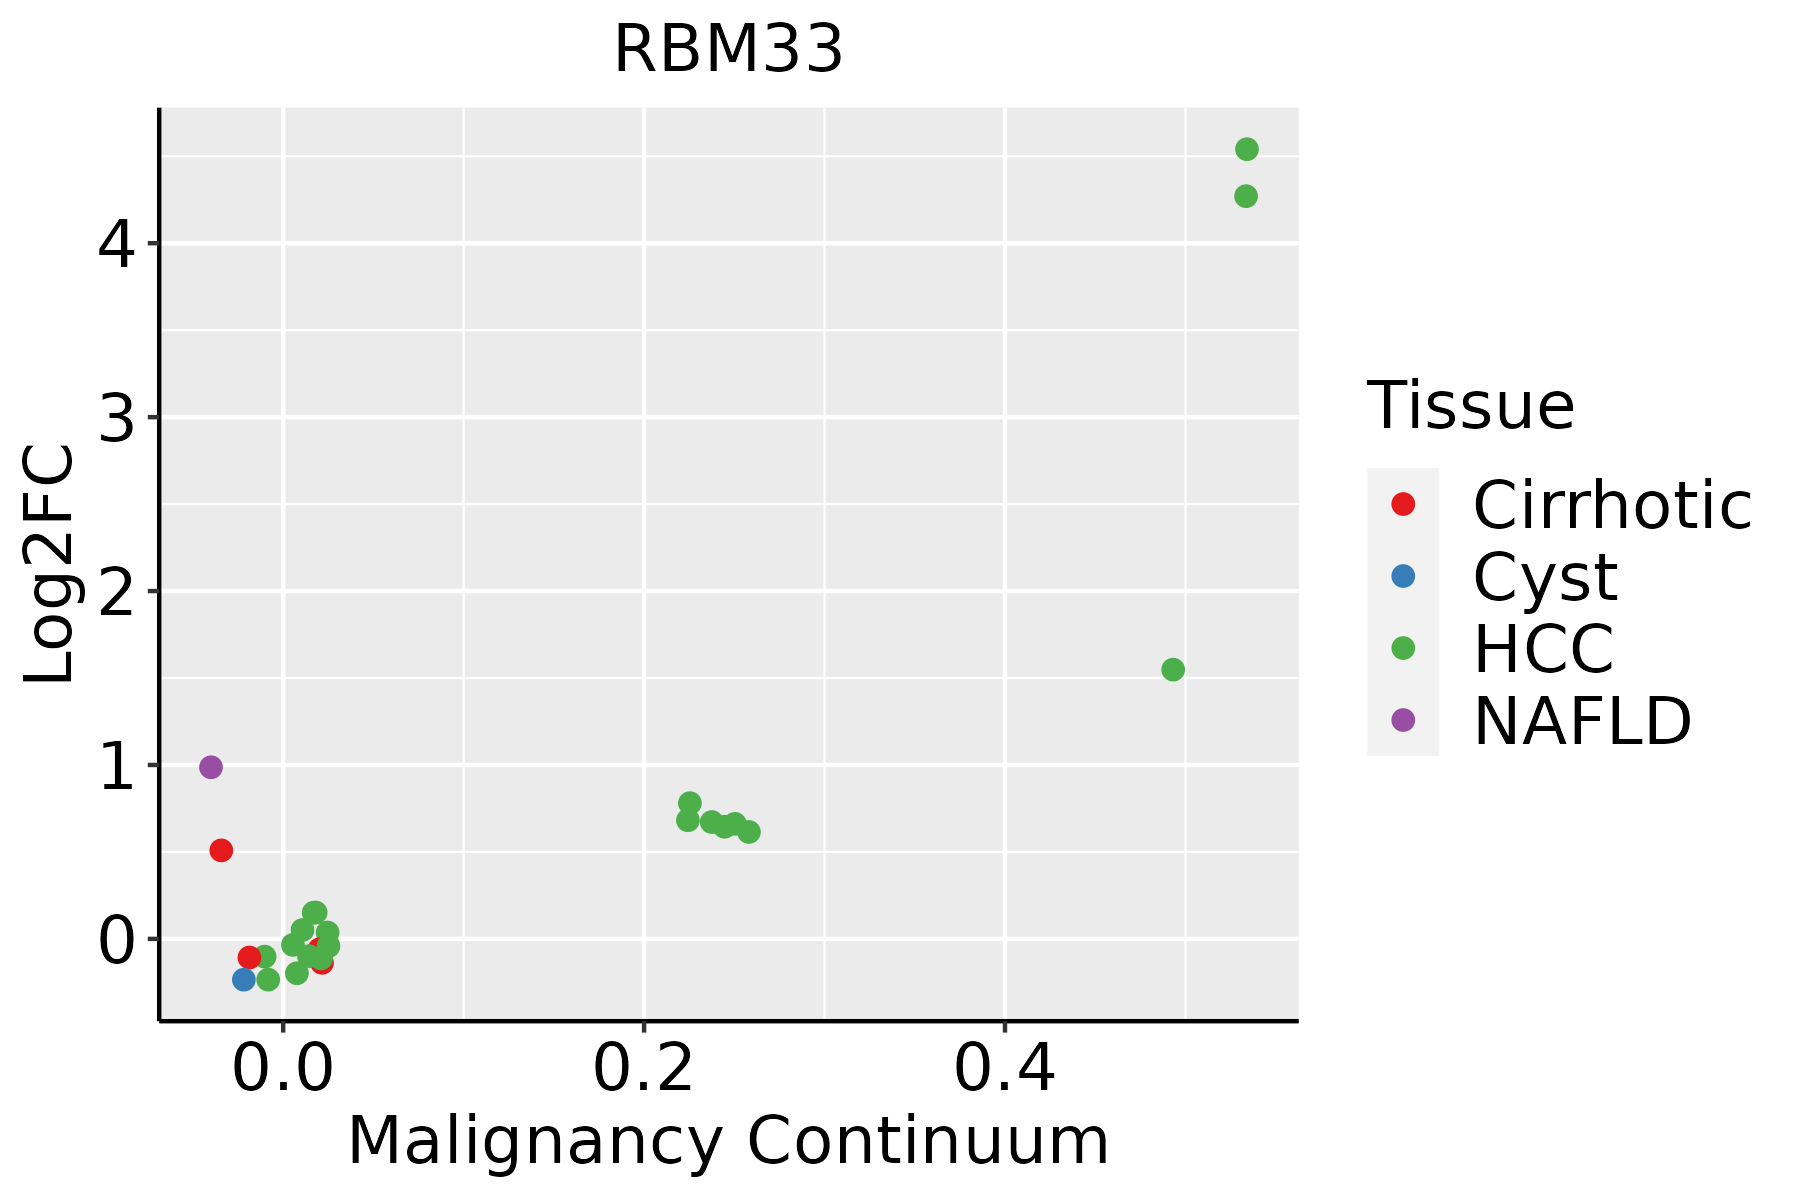 | HCC: Hepatocellular carcinoma |
| NAFLD: Non-alcoholic fatty liver disease | ||
| Lung | 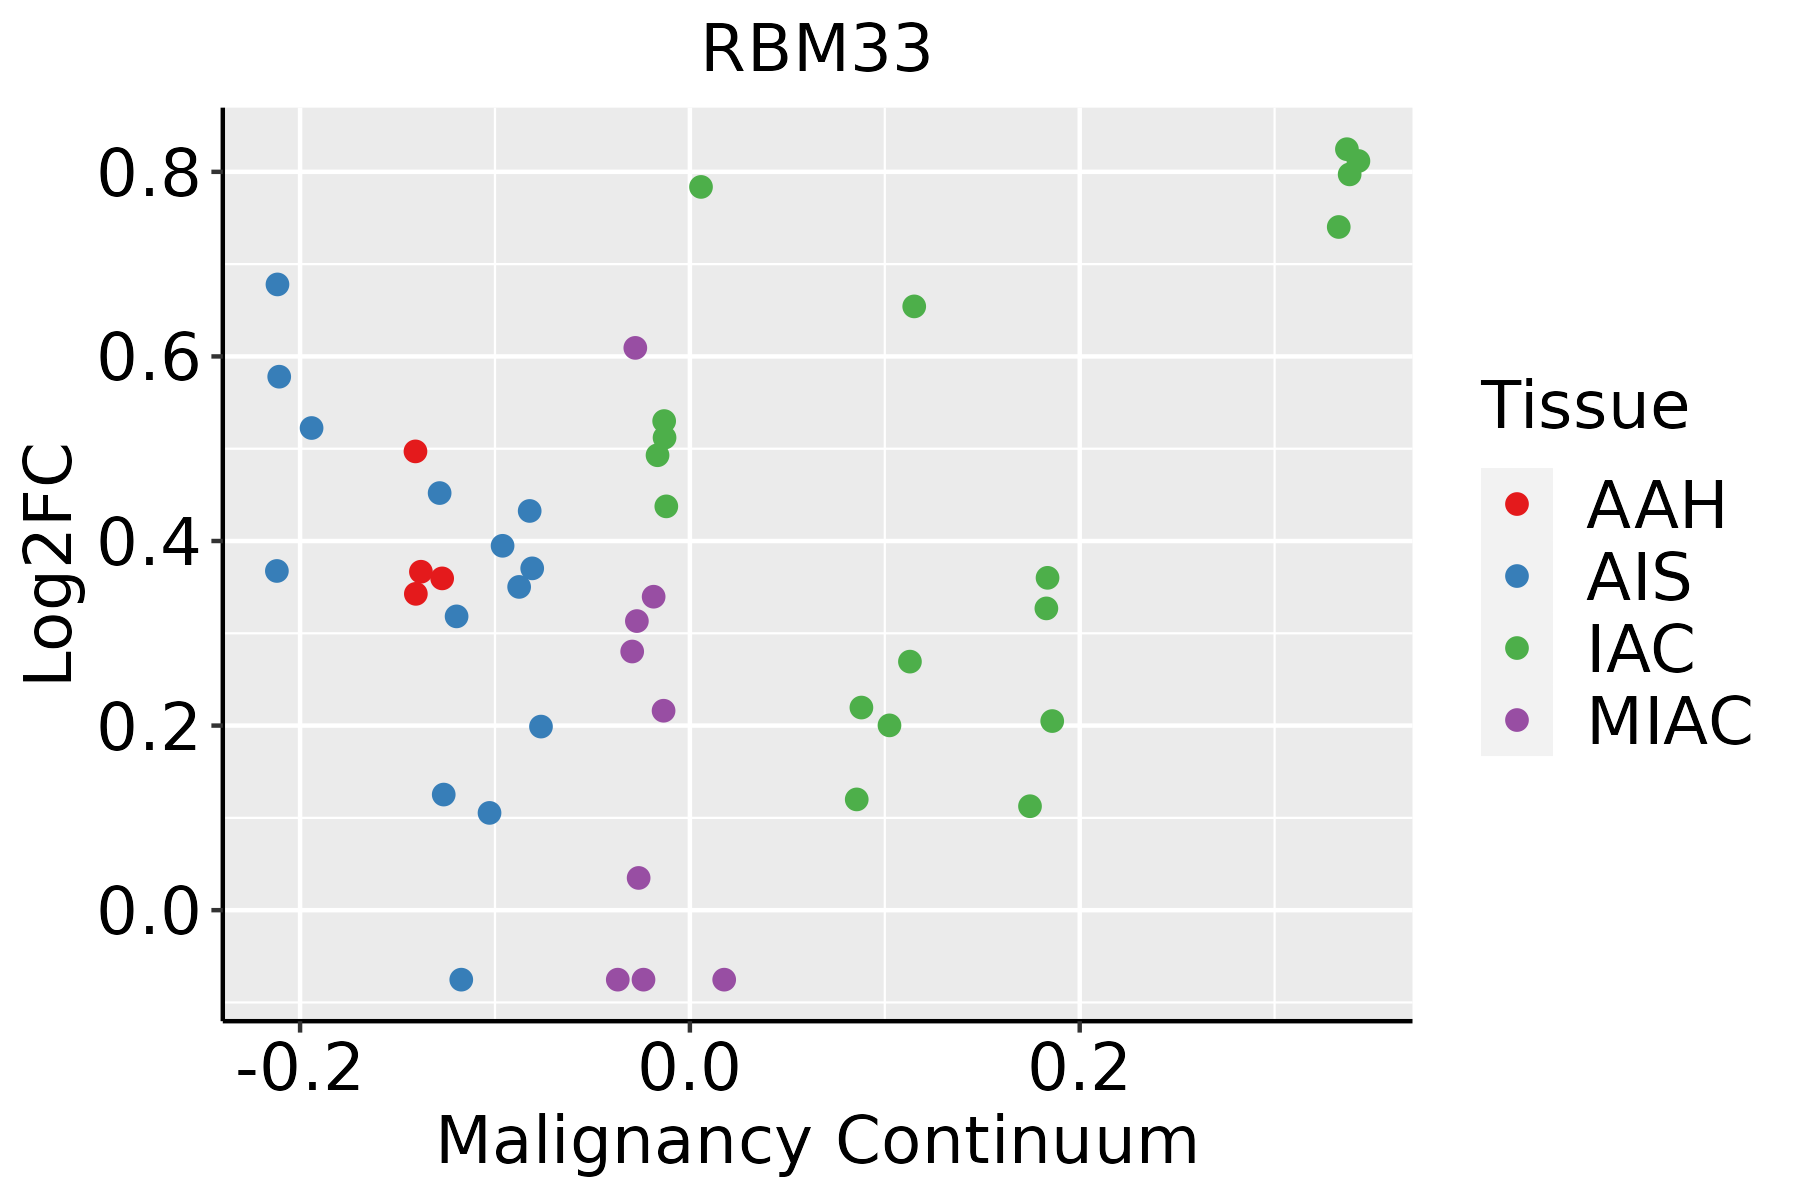 | AAH: Atypical adenomatous hyperplasia |
| AIS: Adenocarcinoma in situ | ||
| IAC: Invasive lung adenocarcinoma | ||
| MIA: Minimally invasive adenocarcinoma | ||
| Oral Cavity |  | EOLP: Erosive Oral lichen planus |
| LP: leukoplakia | ||
| NEOLP: Non-erosive oral lichen planus | ||
| OSCC: Oral squamous cell carcinoma | ||
| Thyroid | 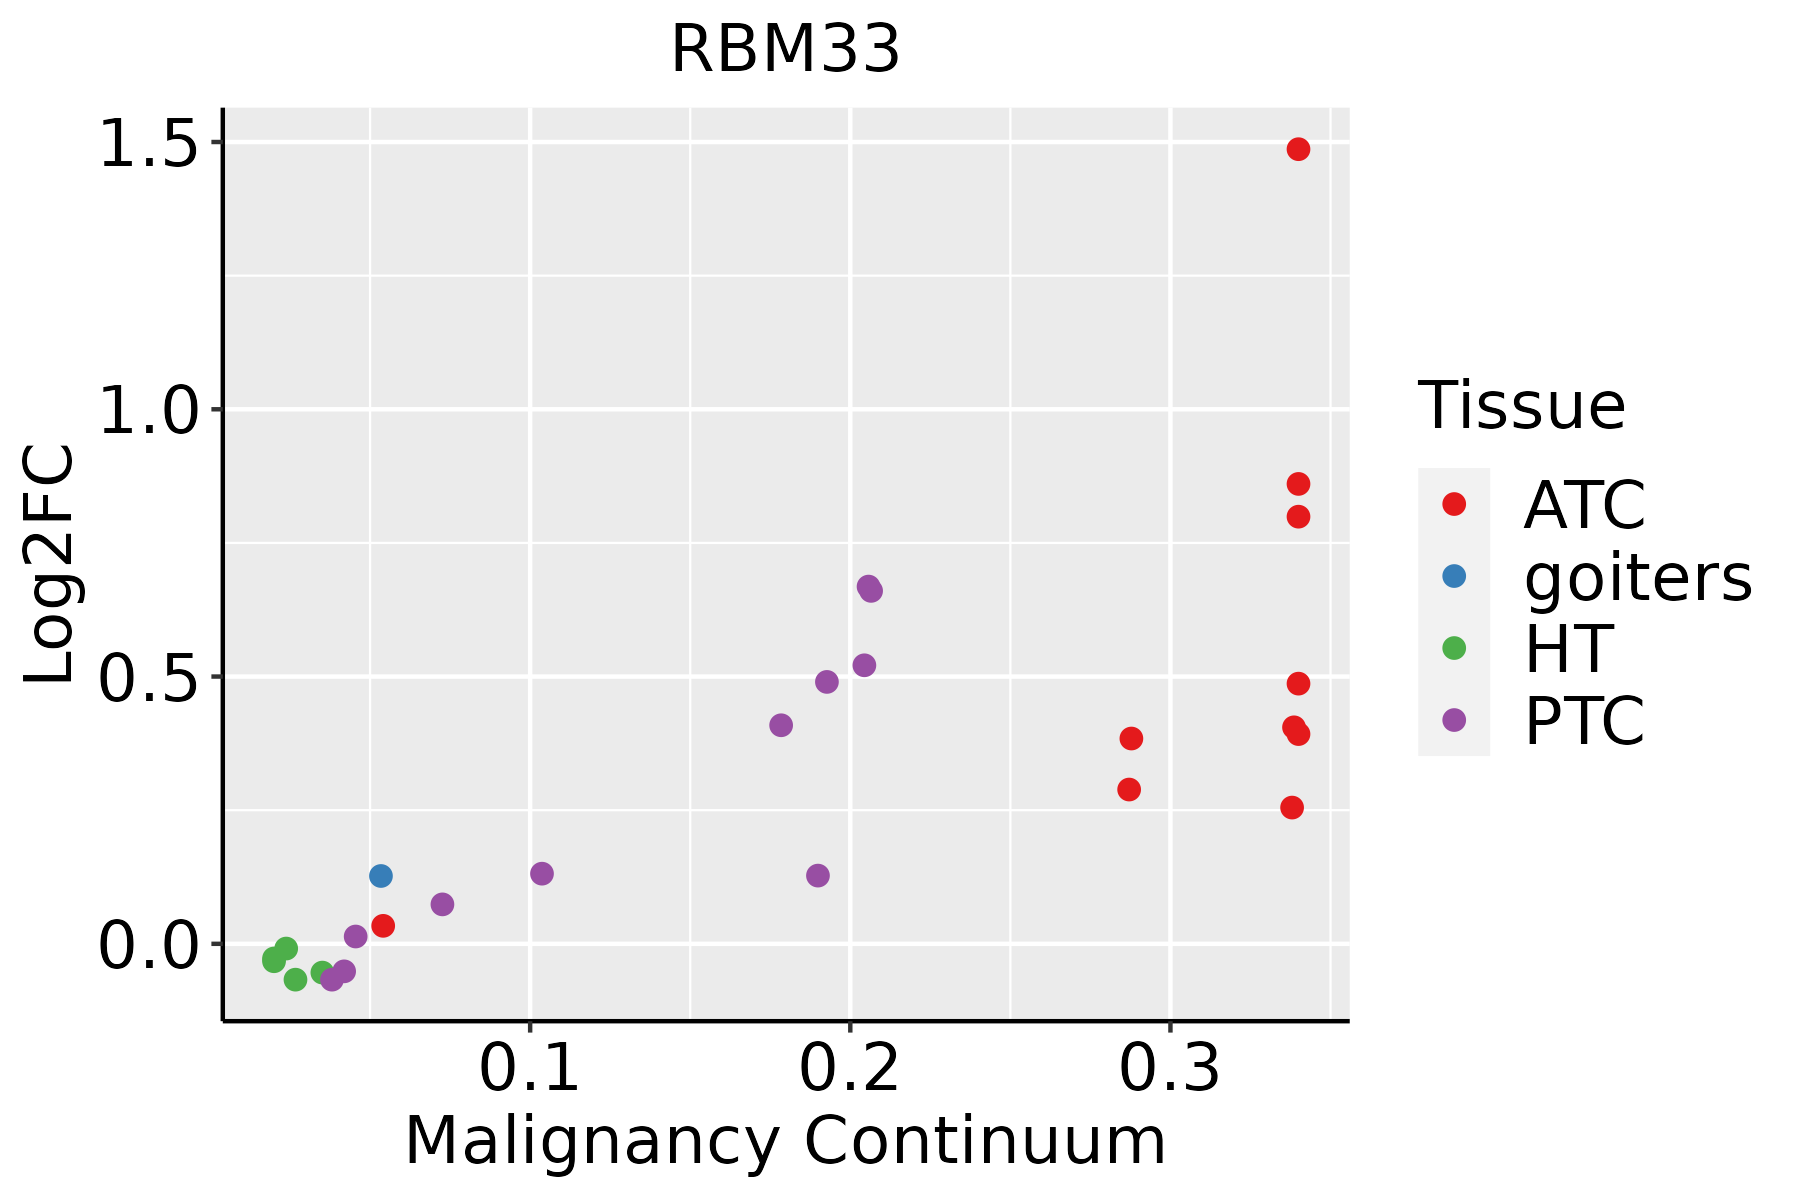 | ATC: Anaplastic thyroid cancer |
| HT: Hashimoto's thyroiditis | ||
| PTC: Papillary thyroid cancer |
| ∗log2FC in expression of this searched gene in stem-like cells from each diseased tissue sample relative to stem-like cells in normal samples in each tissue plotted against the malignancy continuum. Samples are colored based on if they are from different disease stage. |
Top |
Malignant transformation related pathway analysis |
| Find out the enriched GO biological processes and KEGG pathways involved in transition from healthy to precancer to cancer |
| Tissue | Disease Stage | Enriched GO biological Processes |
| Colorectum | AD |  |
| Colorectum | SER |  |
| Colorectum | MSS |  |
| Colorectum | MSI-H |  |
| Colorectum | FAP |  |
| ∗Top 15 enriched GO BP terms are showed in the bar plot of each disease state in each tissue. Each row represents a significant GO biological process which is colored according to the -log10(p.adjust). |
| Page: 1 2 3 4 5 6 7 8 9 |
| GO ID | Tissue | Disease Stage | Description | Gene Ratio | Bg Ratio | pvalue | p.adjust | Count |
| Page: 1 |
| Pathway ID | Tissue | Disease Stage | Description | Gene Ratio | Bg Ratio | pvalue | p.adjust | qvalue | Count |
| Page: 1 |
Top |
Cell-cell communication analysis |
| Identification of potential cell-cell interactions between two cell types and their ligand-receptor pairs for different disease states |
| Ligand | Receptor | LRpair | Pathway | Tissue | Disease Stage |
| Page: 1 |
Top |
Single-cell gene regulatory network inference analysis |
| Find out the significant the regulons (TFs) and the target genes of each regulon across cell types for different disease states |
| TF | Cell Type | Tissue | Disease Stage | Target Gene | RSS | Regulon Activity |
| ∗The dot plots of a searched regulon are shown for all cell subpopulations in each disease state of each tissue based on the regulon specific score inferred using pySCENIC and by calculating the average expression. |
| Page: 1 |
Top |
Somatic mutation of malignant transformation related genes |
| Annotation of somatic variants for genes involved in malignant transformation |
| Hugo Symbol | Variant Class | Variant Classification | dbSNP RS | HGVSc | HGVSp | HGVSp Short | SWISSPROT | BIOTYPE | SIFT | PolyPhen | Tumor Sample Barcode | Tissue | Histology | Sex | Age | Stage | Therapy Types | Drugs | Outcome |
| RBM33 | SNV | Missense_Mutation | c.2618N>T | p.Arg873Ile | p.R873I | Q96EV2 | protein_coding | deleterious(0) | probably_damaging(0.997) | TCGA-A2-A0YJ-01 | Breast | breast invasive carcinoma | Female | <65 | III/IV | Chemotherapy | cytoxan | PD | |
| RBM33 | SNV | Missense_Mutation | rs771230490 | c.454N>A | p.Glu152Lys | p.E152K | Q96EV2 | protein_coding | deleterious(0.01) | benign(0.038) | TCGA-A7-A13D-01 | Breast | breast invasive carcinoma | Female | <65 | I/II | Chemotherapy | cytoxan | SD |
| RBM33 | SNV | Missense_Mutation | c.500N>G | p.Glu167Gly | p.E167G | Q96EV2 | protein_coding | tolerated(0.32) | benign(0.003) | TCGA-A8-A094-01 | Breast | breast invasive carcinoma | Female | >=65 | I/II | Unknown | Unknown | SD | |
| RBM33 | SNV | Missense_Mutation | c.196N>C | p.Glu66Gln | p.E66Q | Q96EV2 | protein_coding | deleterious(0) | probably_damaging(0.998) | TCGA-AC-A23H-01 | Breast | breast invasive carcinoma | Female | >=65 | I/II | Unknown | Unknown | PD | |
| RBM33 | SNV | Missense_Mutation | rs767021343 | c.1714N>C | p.Thr572Pro | p.T572P | Q96EV2 | protein_coding | tolerated_low_confidence(0.45) | benign(0) | TCGA-AN-A0AK-01 | Breast | breast invasive carcinoma | Female | >=65 | I/II | Unknown | Unknown | SD |
| RBM33 | SNV | Missense_Mutation | c.3394N>G | p.Gln1132Glu | p.Q1132E | Q96EV2 | protein_coding | tolerated(0.15) | probably_damaging(0.968) | TCGA-D8-A1JC-01 | Breast | breast invasive carcinoma | Female | <65 | III/IV | Chemotherapy | adriamycin | SD | |
| RBM33 | SNV | Missense_Mutation | c.3469A>G | p.Met1157Val | p.M1157V | Q96EV2 | protein_coding | deleterious(0) | probably_damaging(0.961) | TCGA-EW-A1IZ-01 | Breast | breast invasive carcinoma | Female | <65 | III/IV | Chemotherapy | taxotere | SD | |
| RBM33 | SNV | Missense_Mutation | novel | c.1753C>A | p.Pro585Thr | p.P585T | Q96EV2 | protein_coding | tolerated(0.21) | probably_damaging(0.998) | TCGA-OL-A5DA-01 | Breast | breast invasive carcinoma | Female | <65 | I/II | Unknown | Unknown | SD |
| RBM33 | insertion | In_Frame_Ins | novel | c.3310_3311insTTTTCTCTTCGTTTCCTTTTGTGT | p.Gly1104delinsValPheSerSerPheProPheValTrp | p.G1104delinsVFSSFPFVW | Q96EV2 | protein_coding | TCGA-A2-A0CM-01 | Breast | breast invasive carcinoma | Female | <65 | I/II | Chemotherapy | adriamycin | PD | ||
| RBM33 | insertion | Frame_Shift_Ins | novel | c.2654_2655insAGATTTTTTTGTAT | p.Asn885LysfsTer28 | p.N885Kfs*28 | Q96EV2 | protein_coding | TCGA-B6-A0IA-01 | Breast | breast invasive carcinoma | Female | <65 | I/II | Unknown | Unknown | SD |
| Page: 1 2 3 4 5 6 7 8 9 10 11 12 |
Top |
Related drugs of malignant transformation related genes |
| Identification of chemicals and drugs interact with genes involved in malignant transfromation |
| (DGIdb 4.0) |
| Entrez ID | Symbol | Category | Interaction Types | Drug Claim Name | Drug Name | PMIDs |
| Page: 1 |

Copyright 2023-Present -The University of Texas Health Science Center at Houston |