| Tissue | Expression Dynamics | Abbreviation |
| Breast |  | IDC: Invasive ductal carcinoma |
| DCIS: Ductal carcinoma in situ |
| Precancer(BRCA1-mut): Precancerous lesion from BRCA1 mutation carriers |
| Cervix | 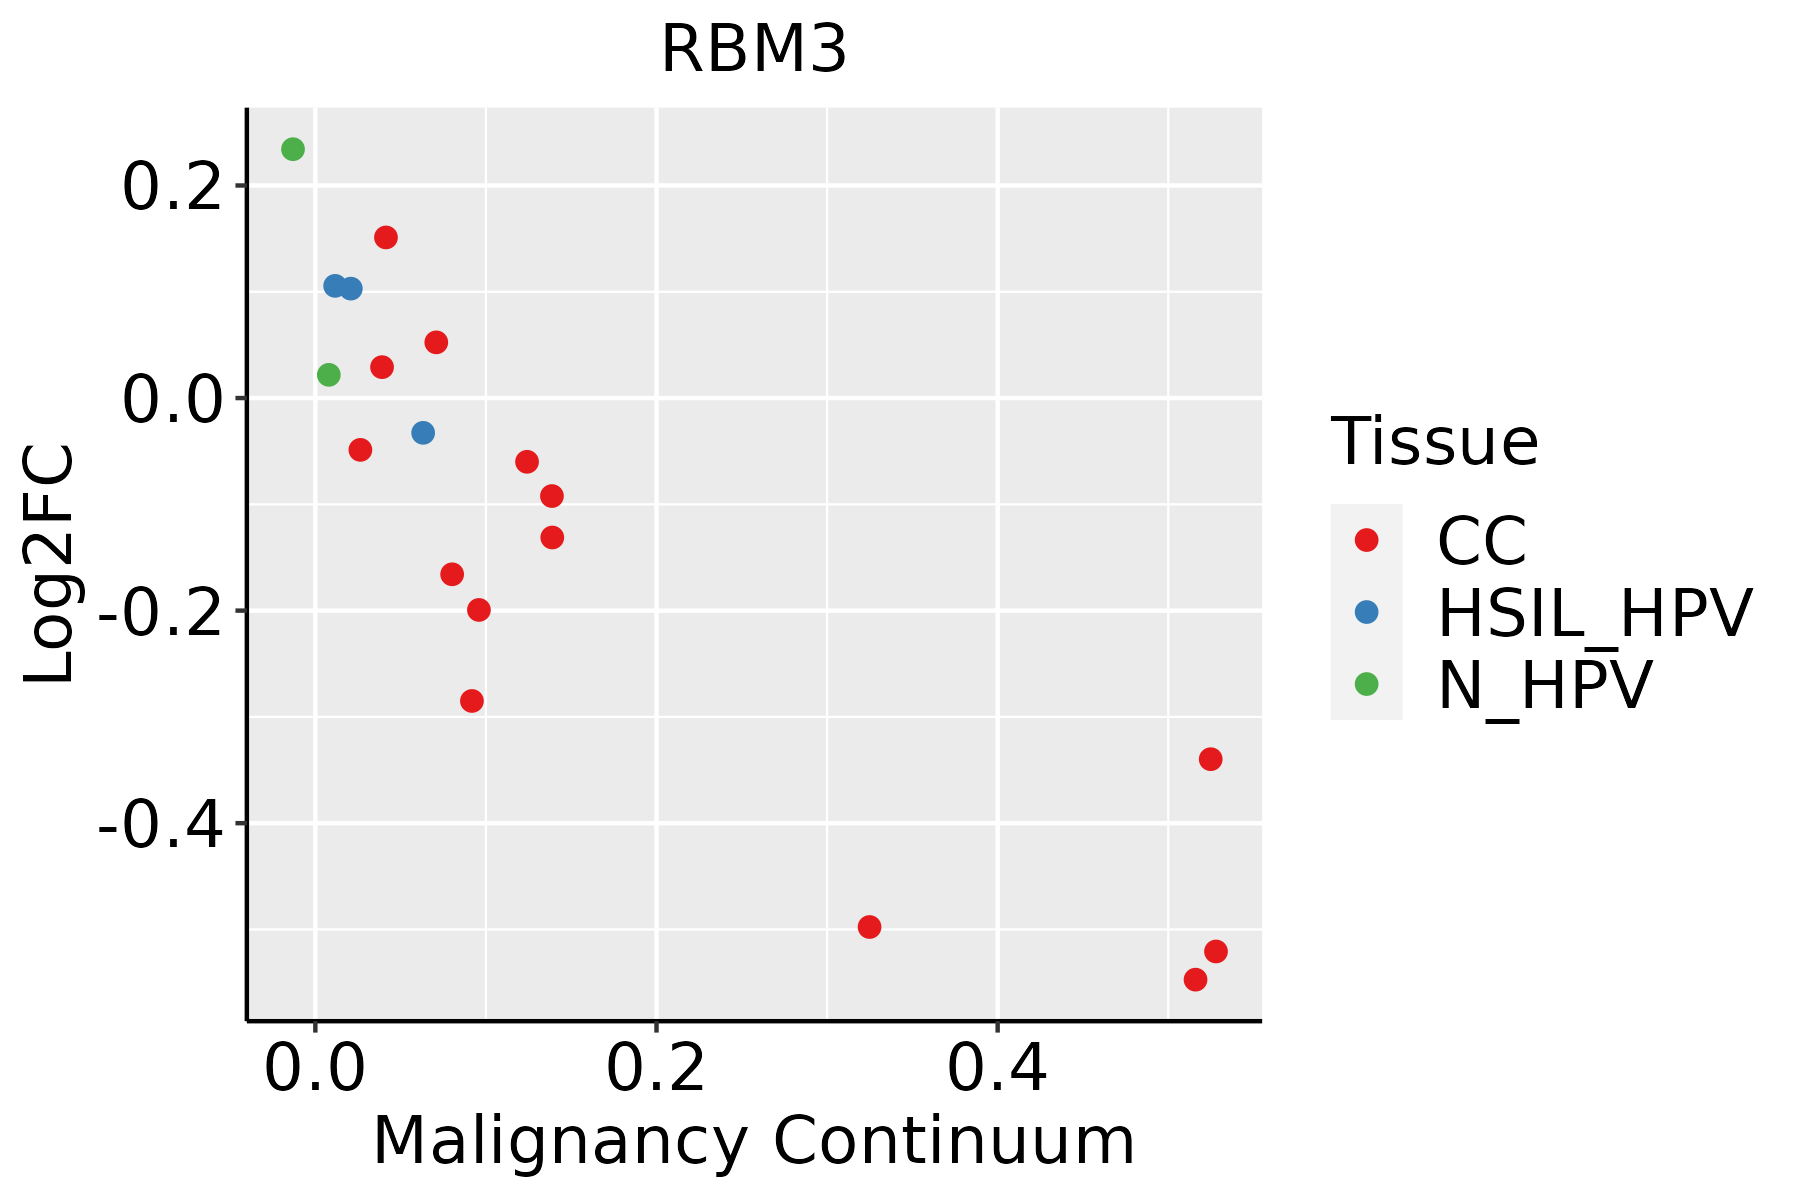 | CC: Cervix cancer |
| HSIL_HPV: HPV-infected high-grade squamous intraepithelial lesions |
| N_HPV: HPV-infected normal cervix |
| Colorectum (GSE201348) | 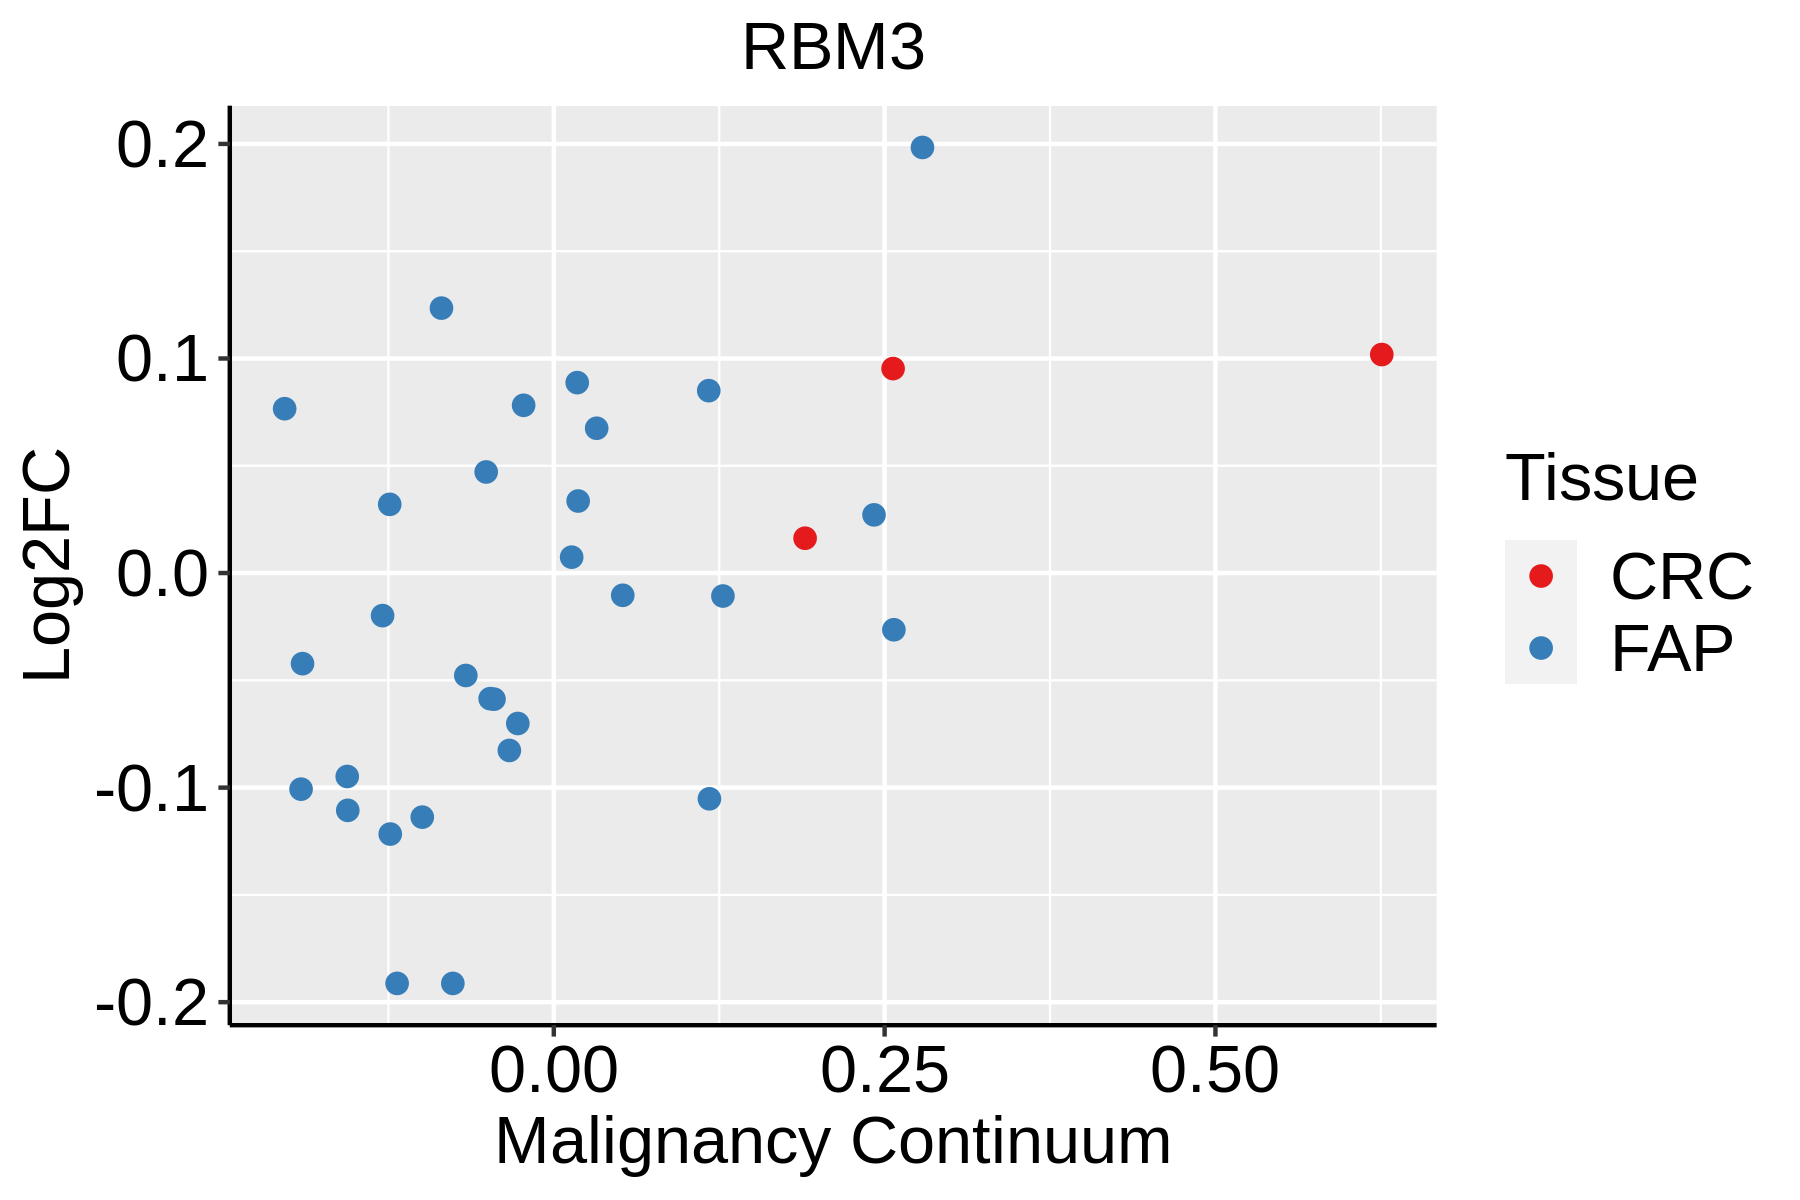 | FAP: Familial adenomatous polyposis |
| CRC: Colorectal cancer |
| Colorectum (HTA11) | 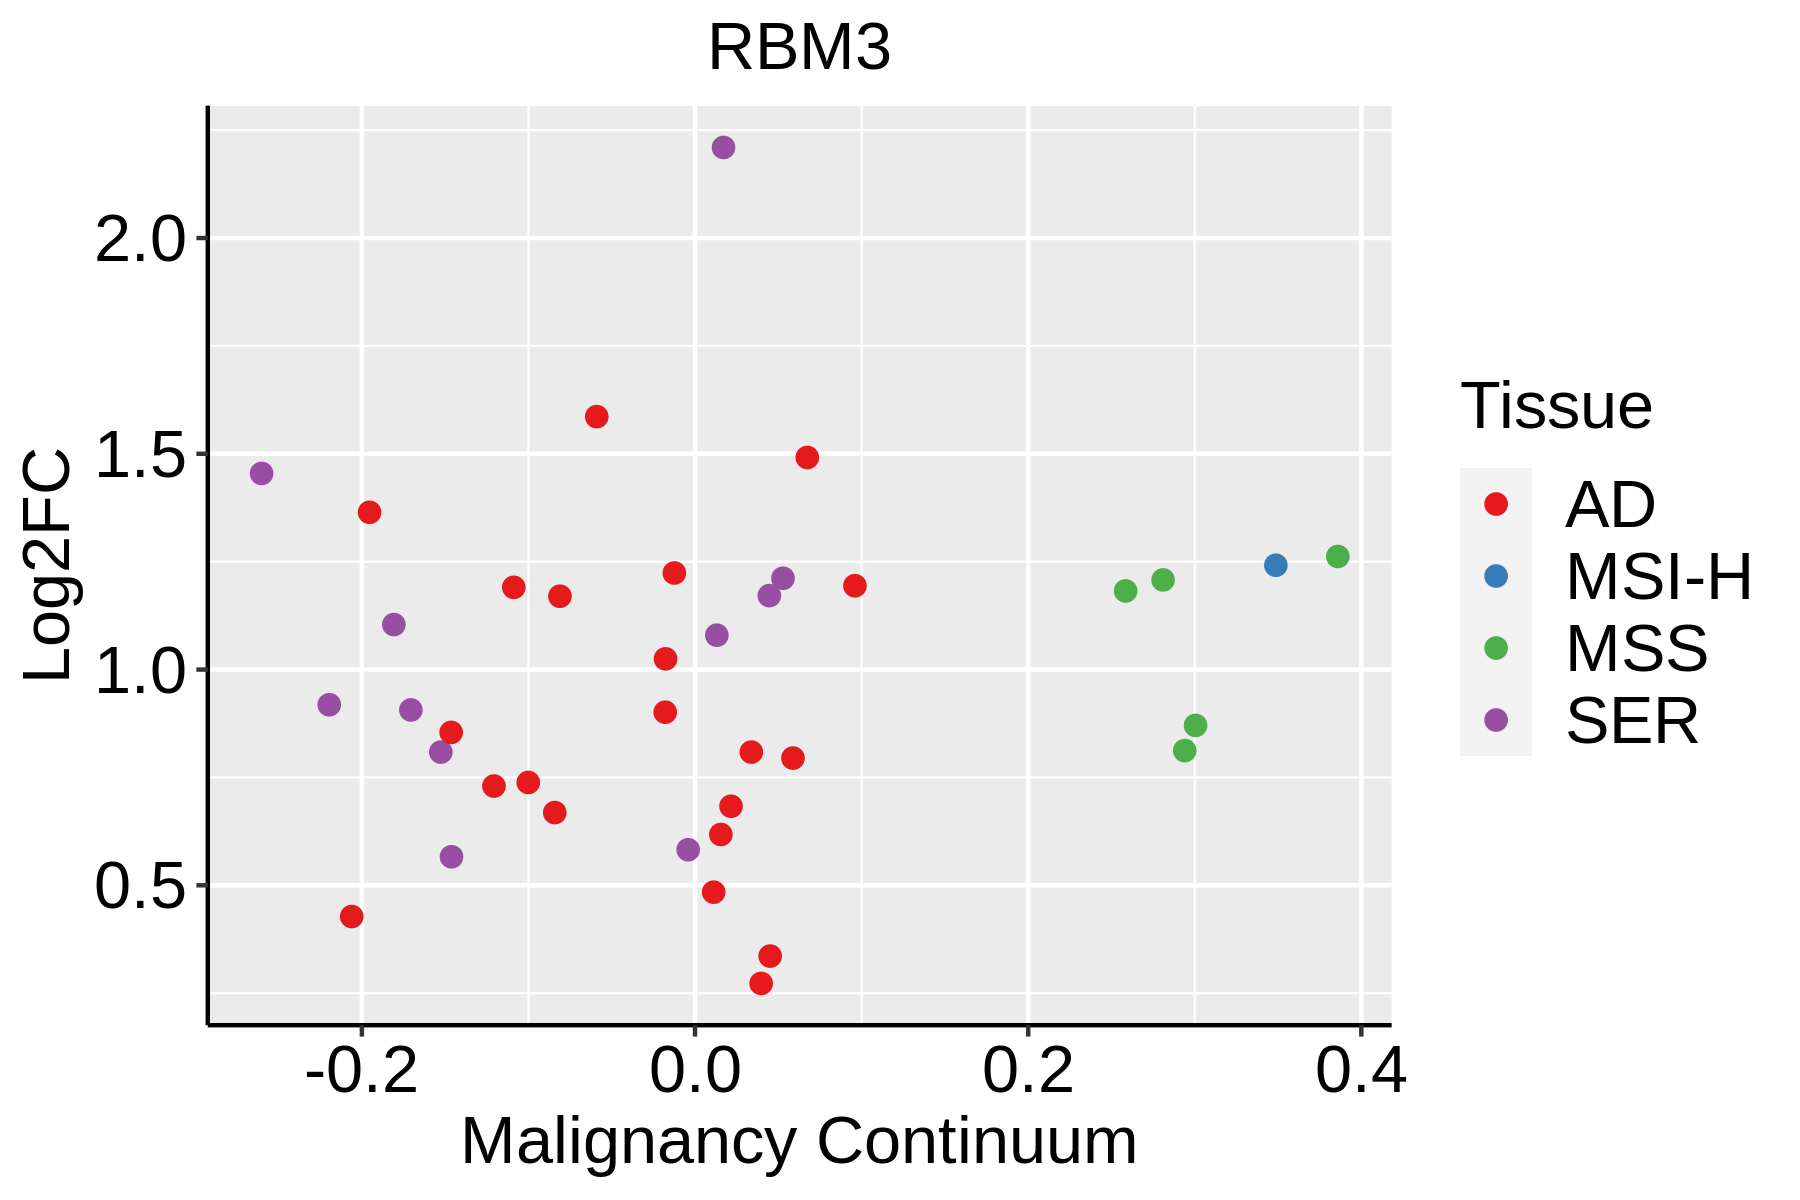 | AD: Adenomas |
| SER: Sessile serrated lesions |
| MSI-H: Microsatellite-high colorectal cancer |
| MSS: Microsatellite stable colorectal cancer |
| Endometrium |  | AEH: Atypical endometrial hyperplasia |
| EEC: Endometrioid Cancer |
| Esophagus |  | ESCC: Esophageal squamous cell carcinoma |
| HGIN: High-grade intraepithelial neoplasias |
| LGIN: Low-grade intraepithelial neoplasias |
| GC | 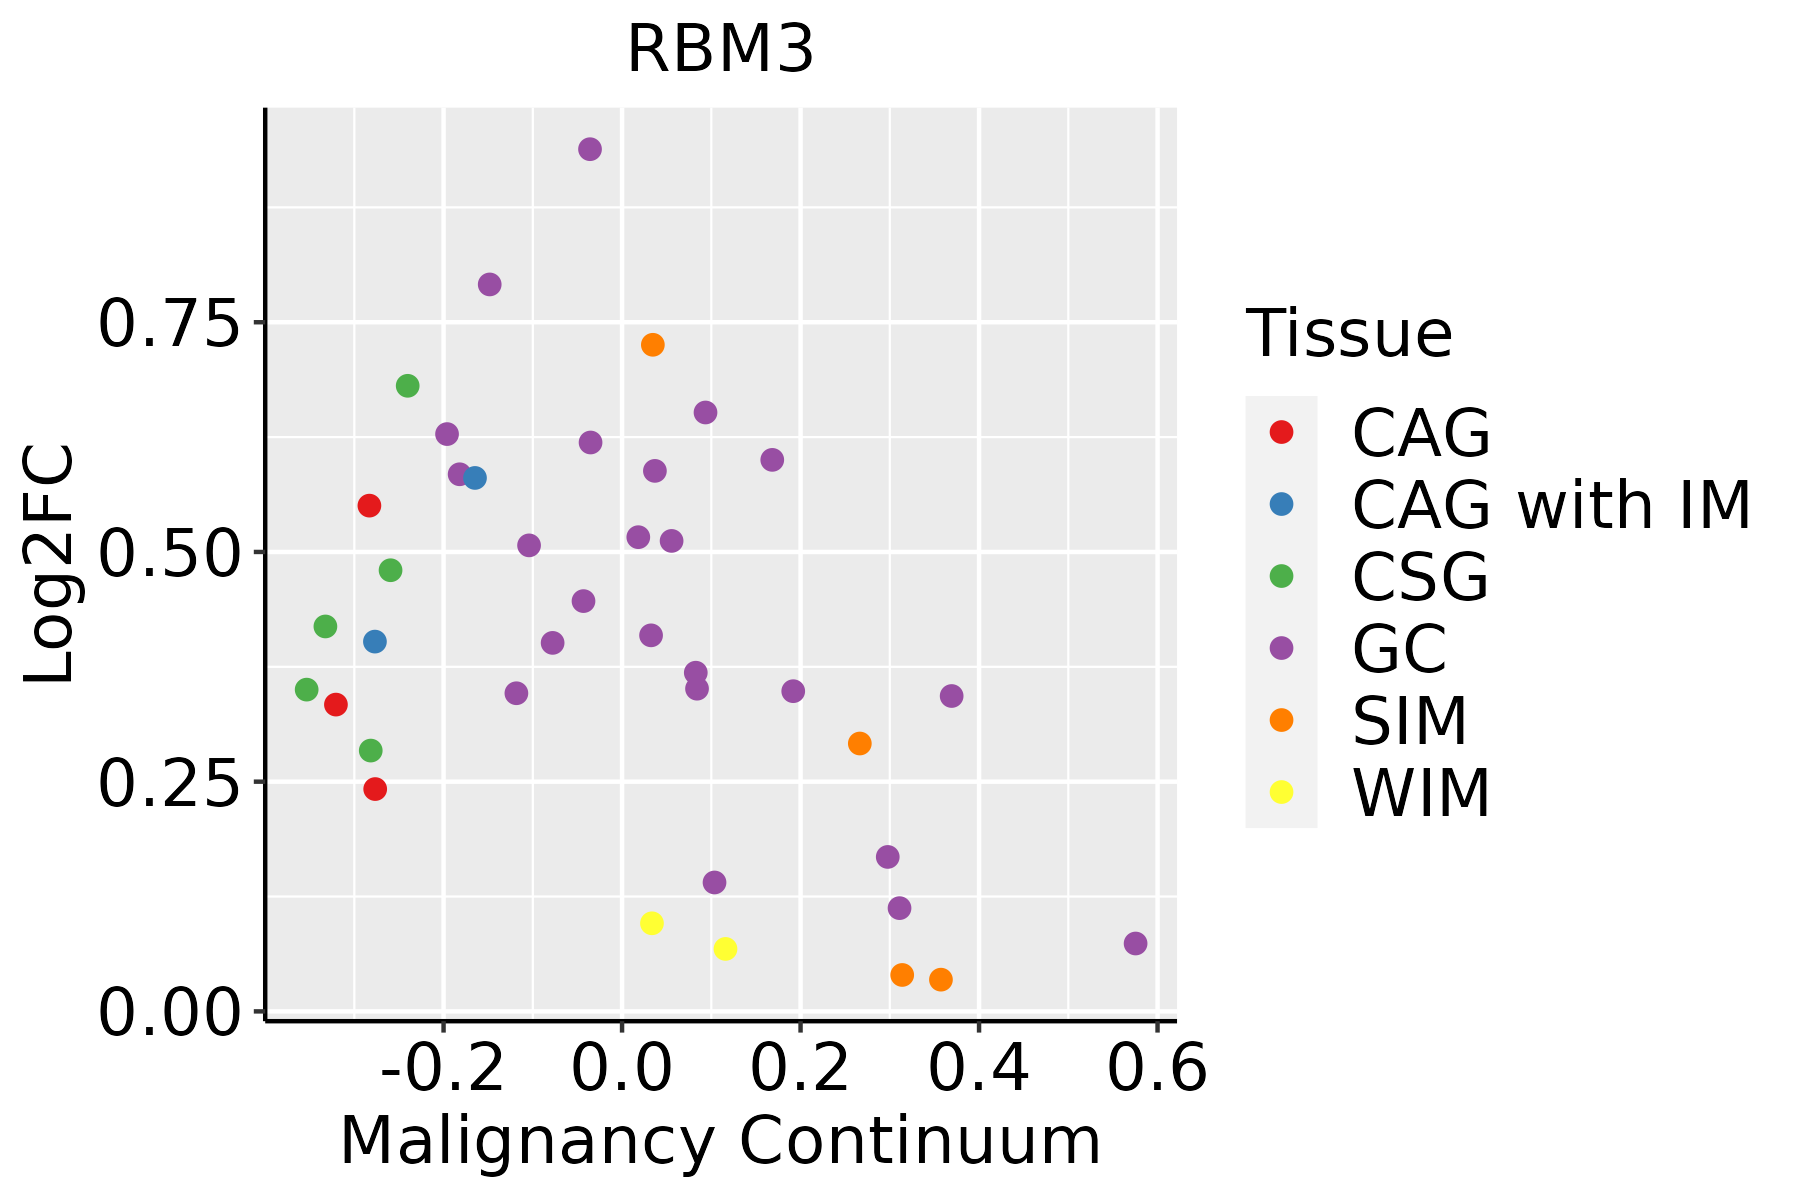 | CAG: Chronic atrophic gastritis |
| CAG with IM: Chronic atrophic gastritis with intestinal metaplasia |
| CSG: Chronic superficial gastritis |
| GC: Gastric cancer |
| SIM: Severe intestinal metaplasia |
| WIM: Wild intestinal metaplasia |
| Liver | 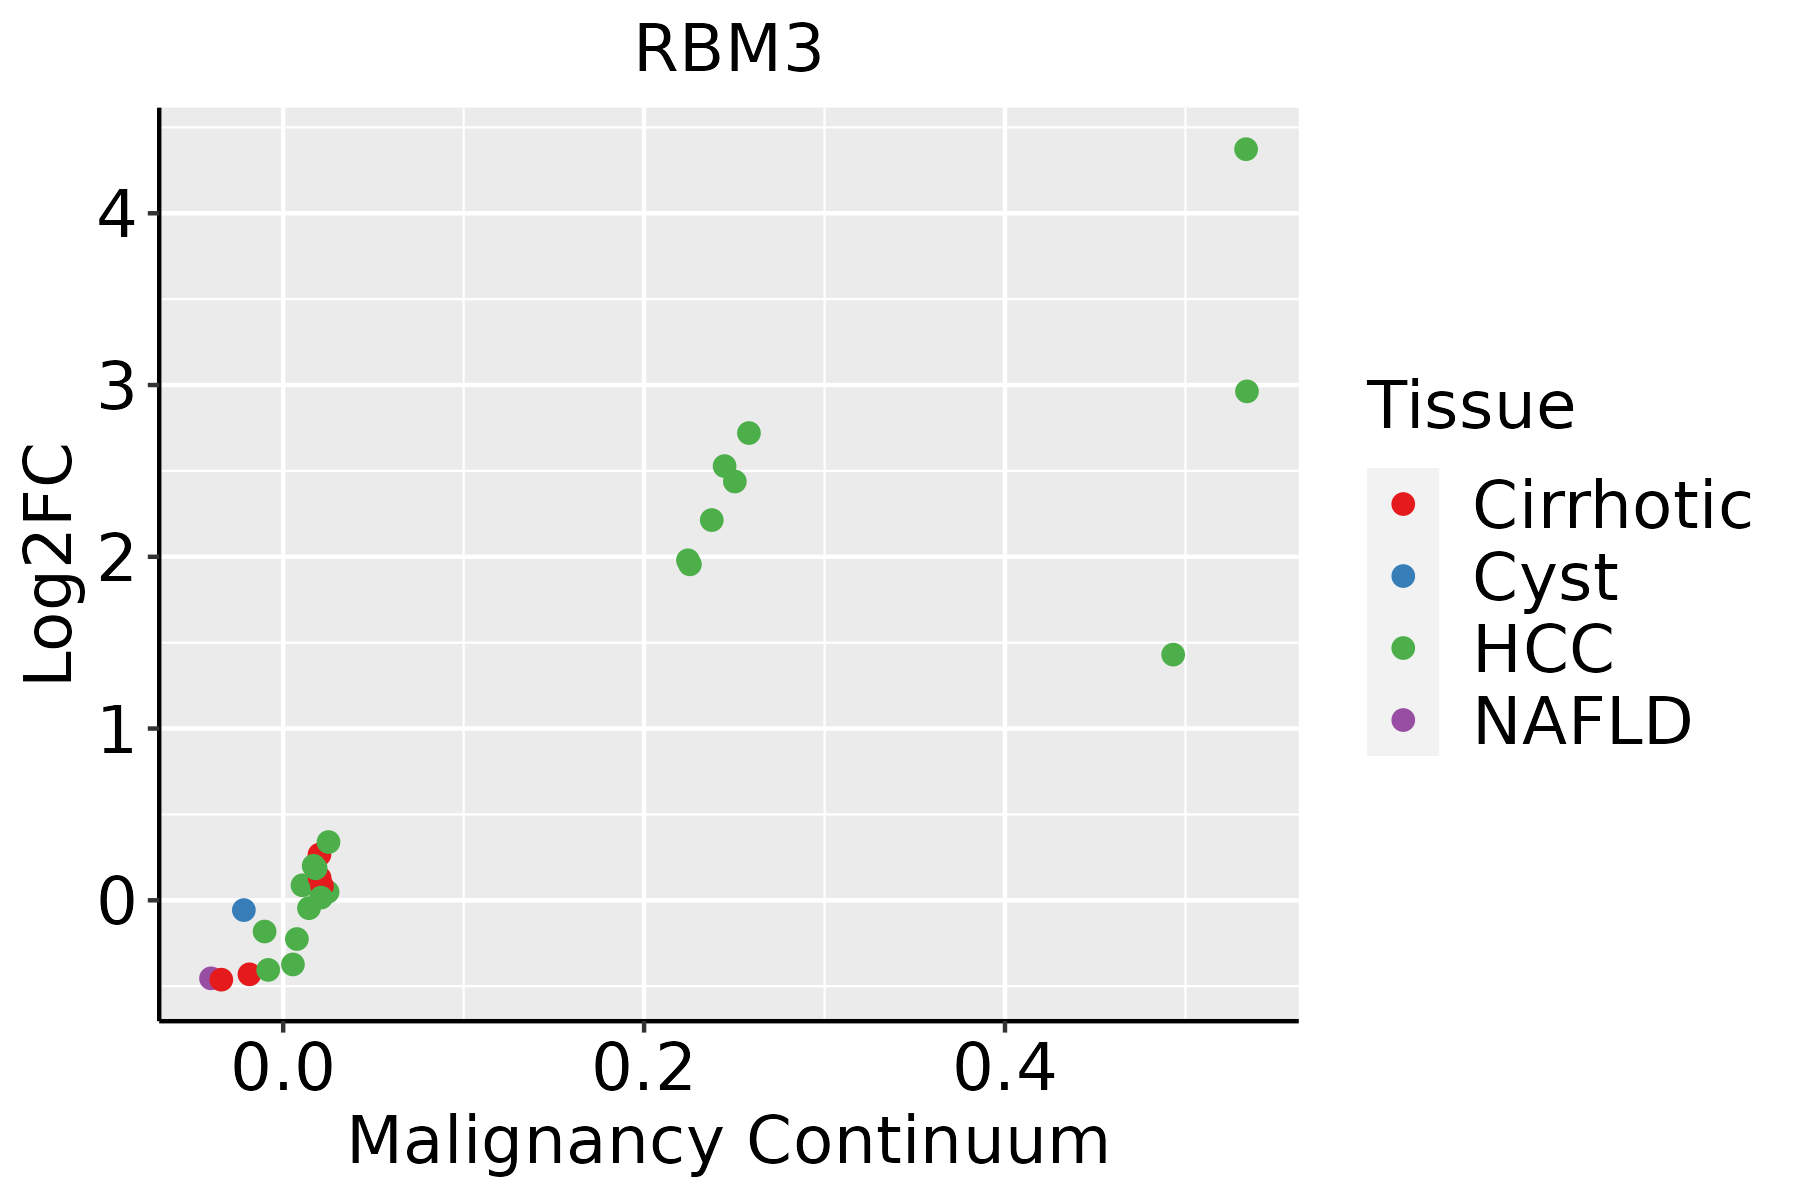 | HCC: Hepatocellular carcinoma |
| NAFLD: Non-alcoholic fatty liver disease |
| Oral Cavity | 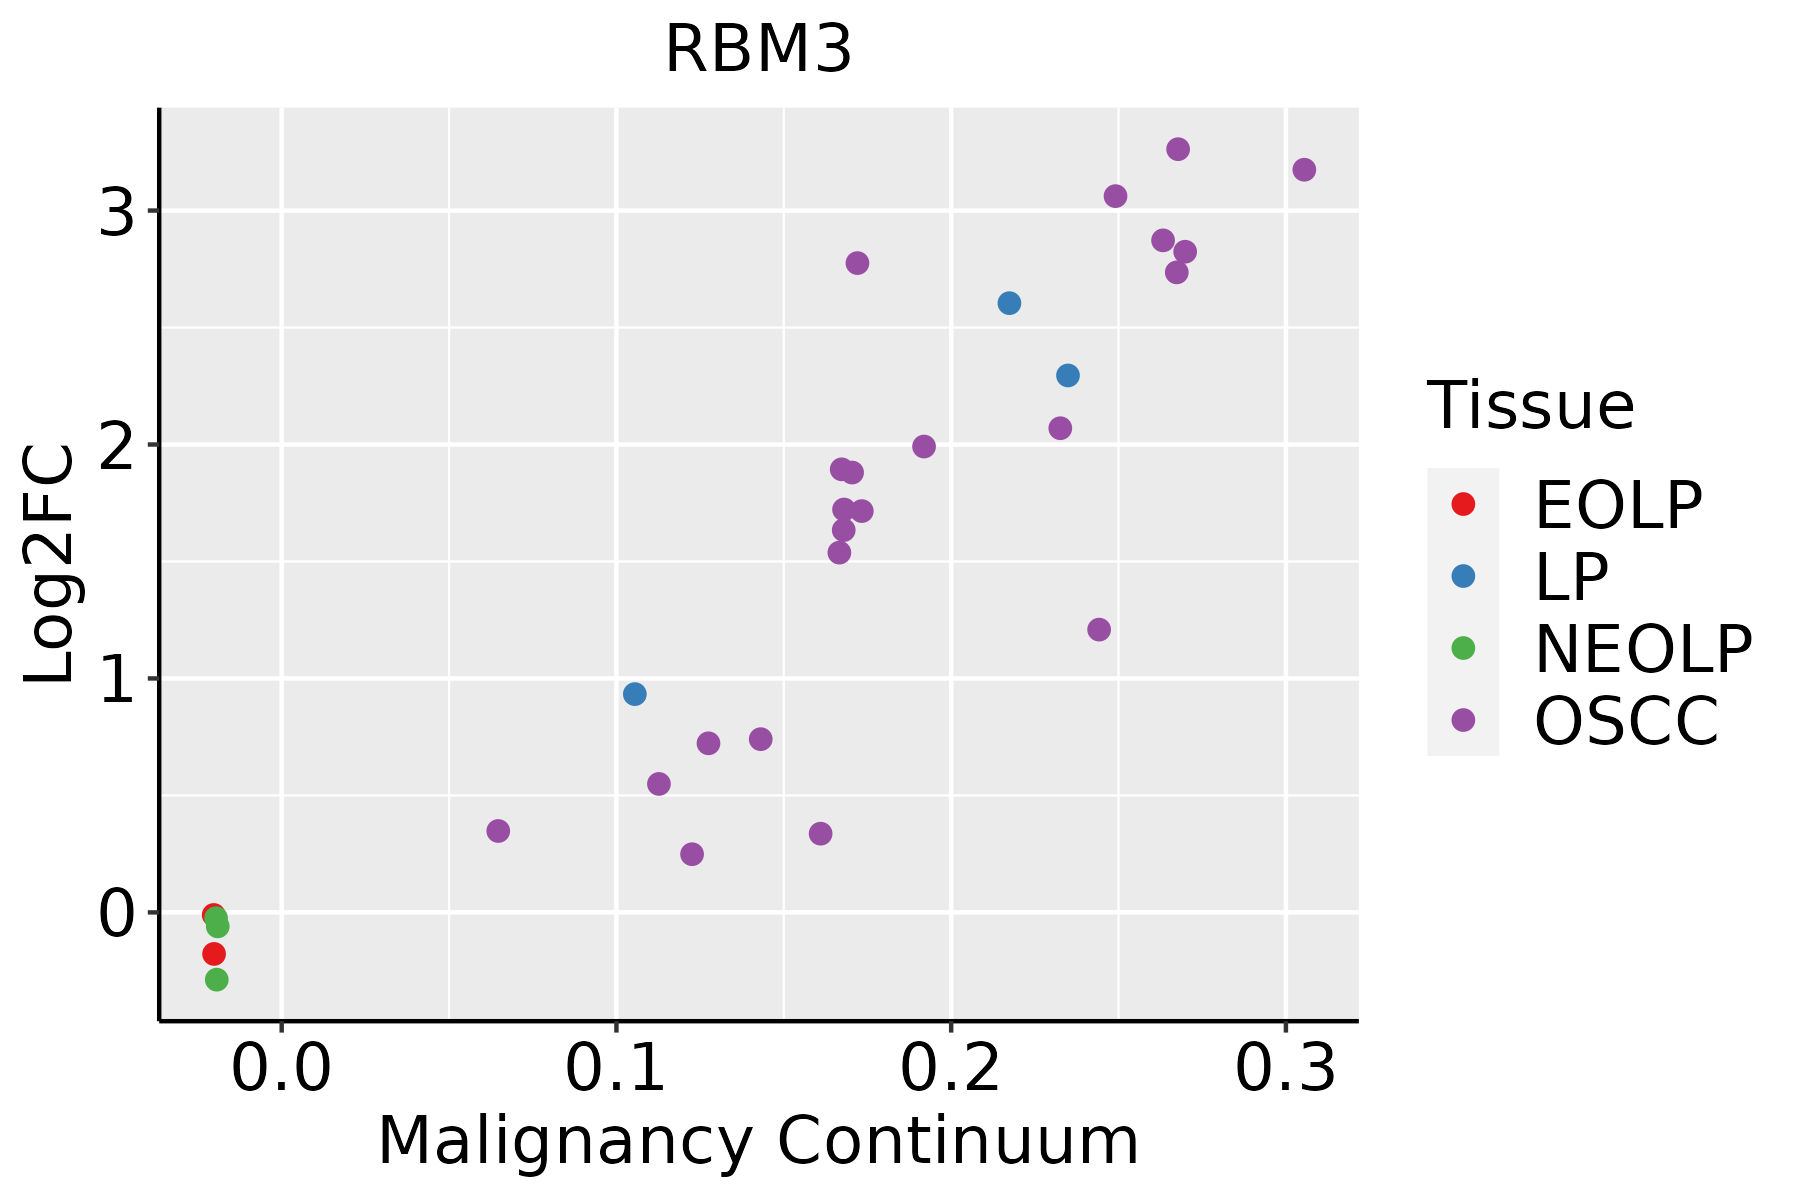 | EOLP: Erosive Oral lichen planus |
| LP: leukoplakia |
| NEOLP: Non-erosive oral lichen planus |
| OSCC: Oral squamous cell carcinoma |
| Prostate | 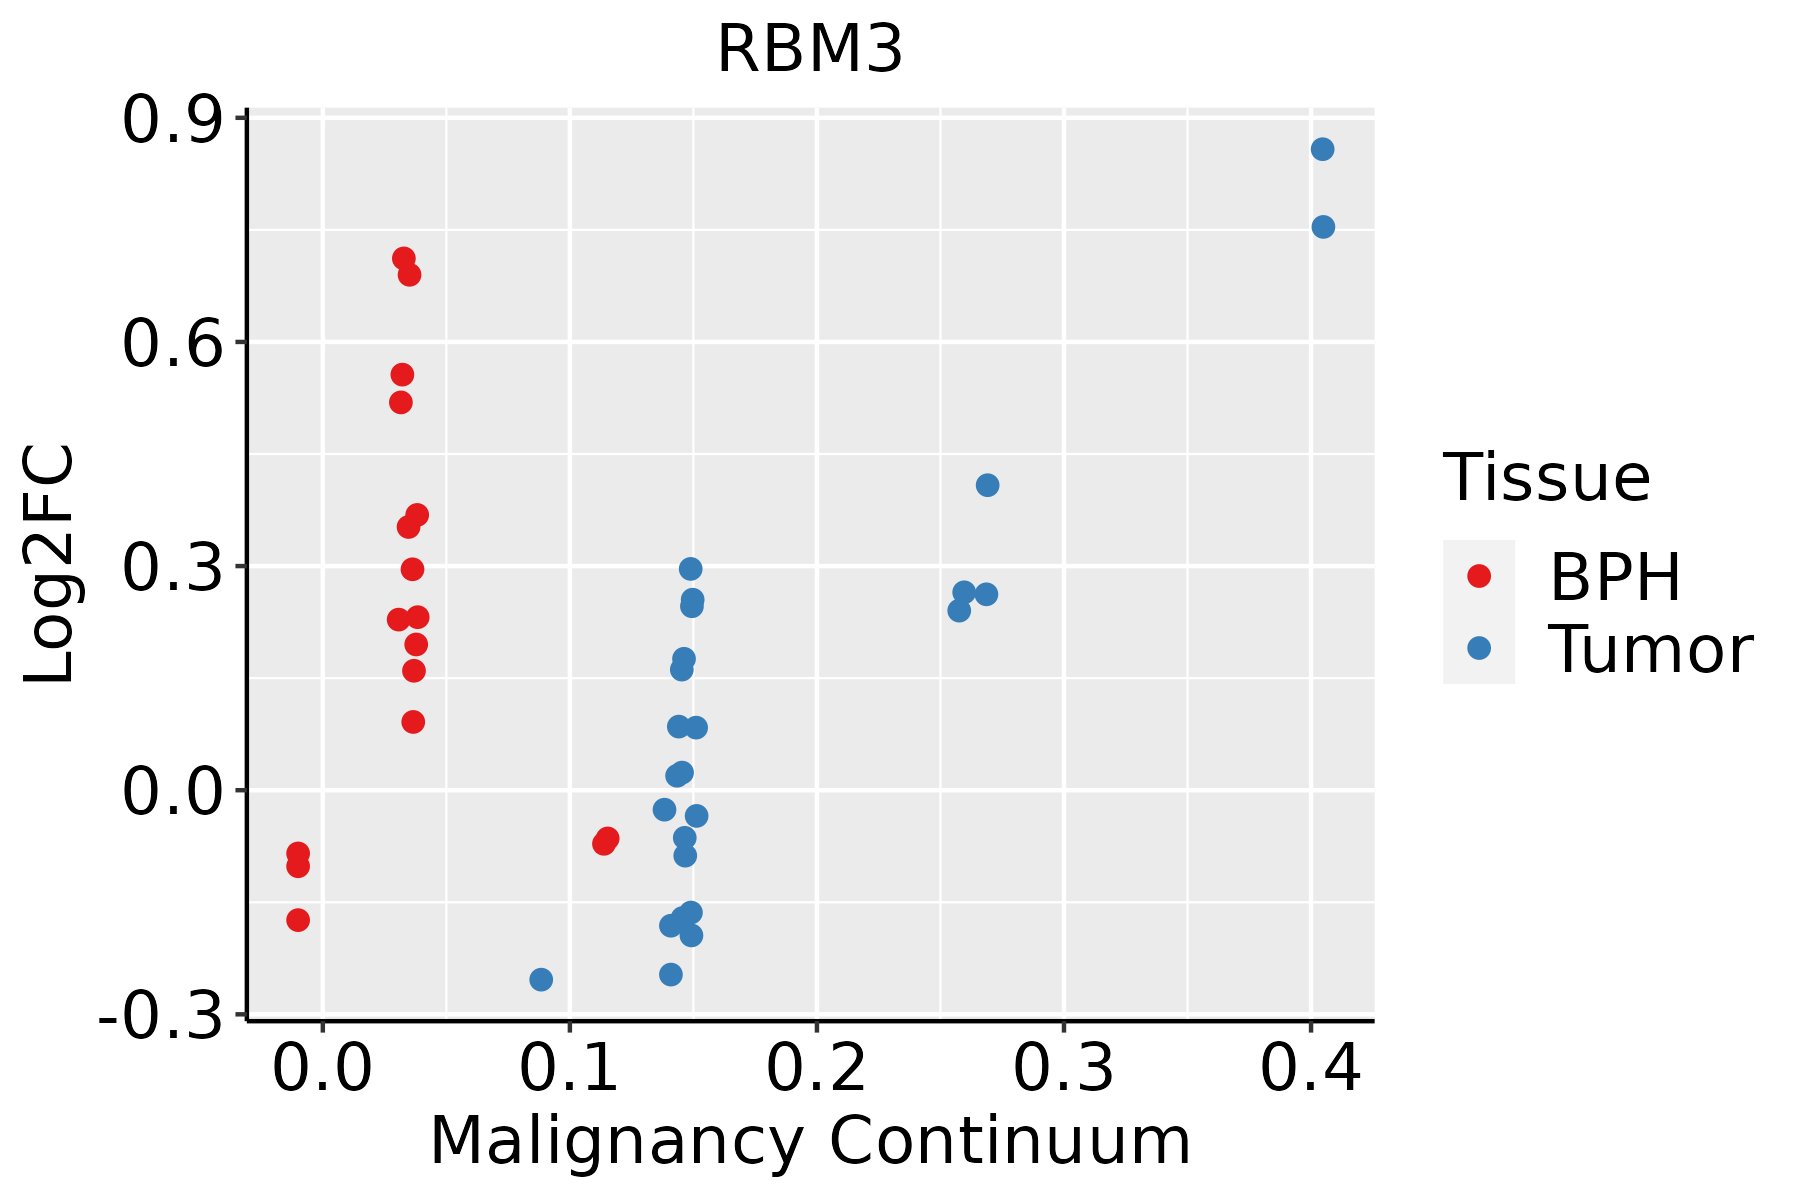 | BPH: Benign Prostatic Hyperplasia |
| Skin | 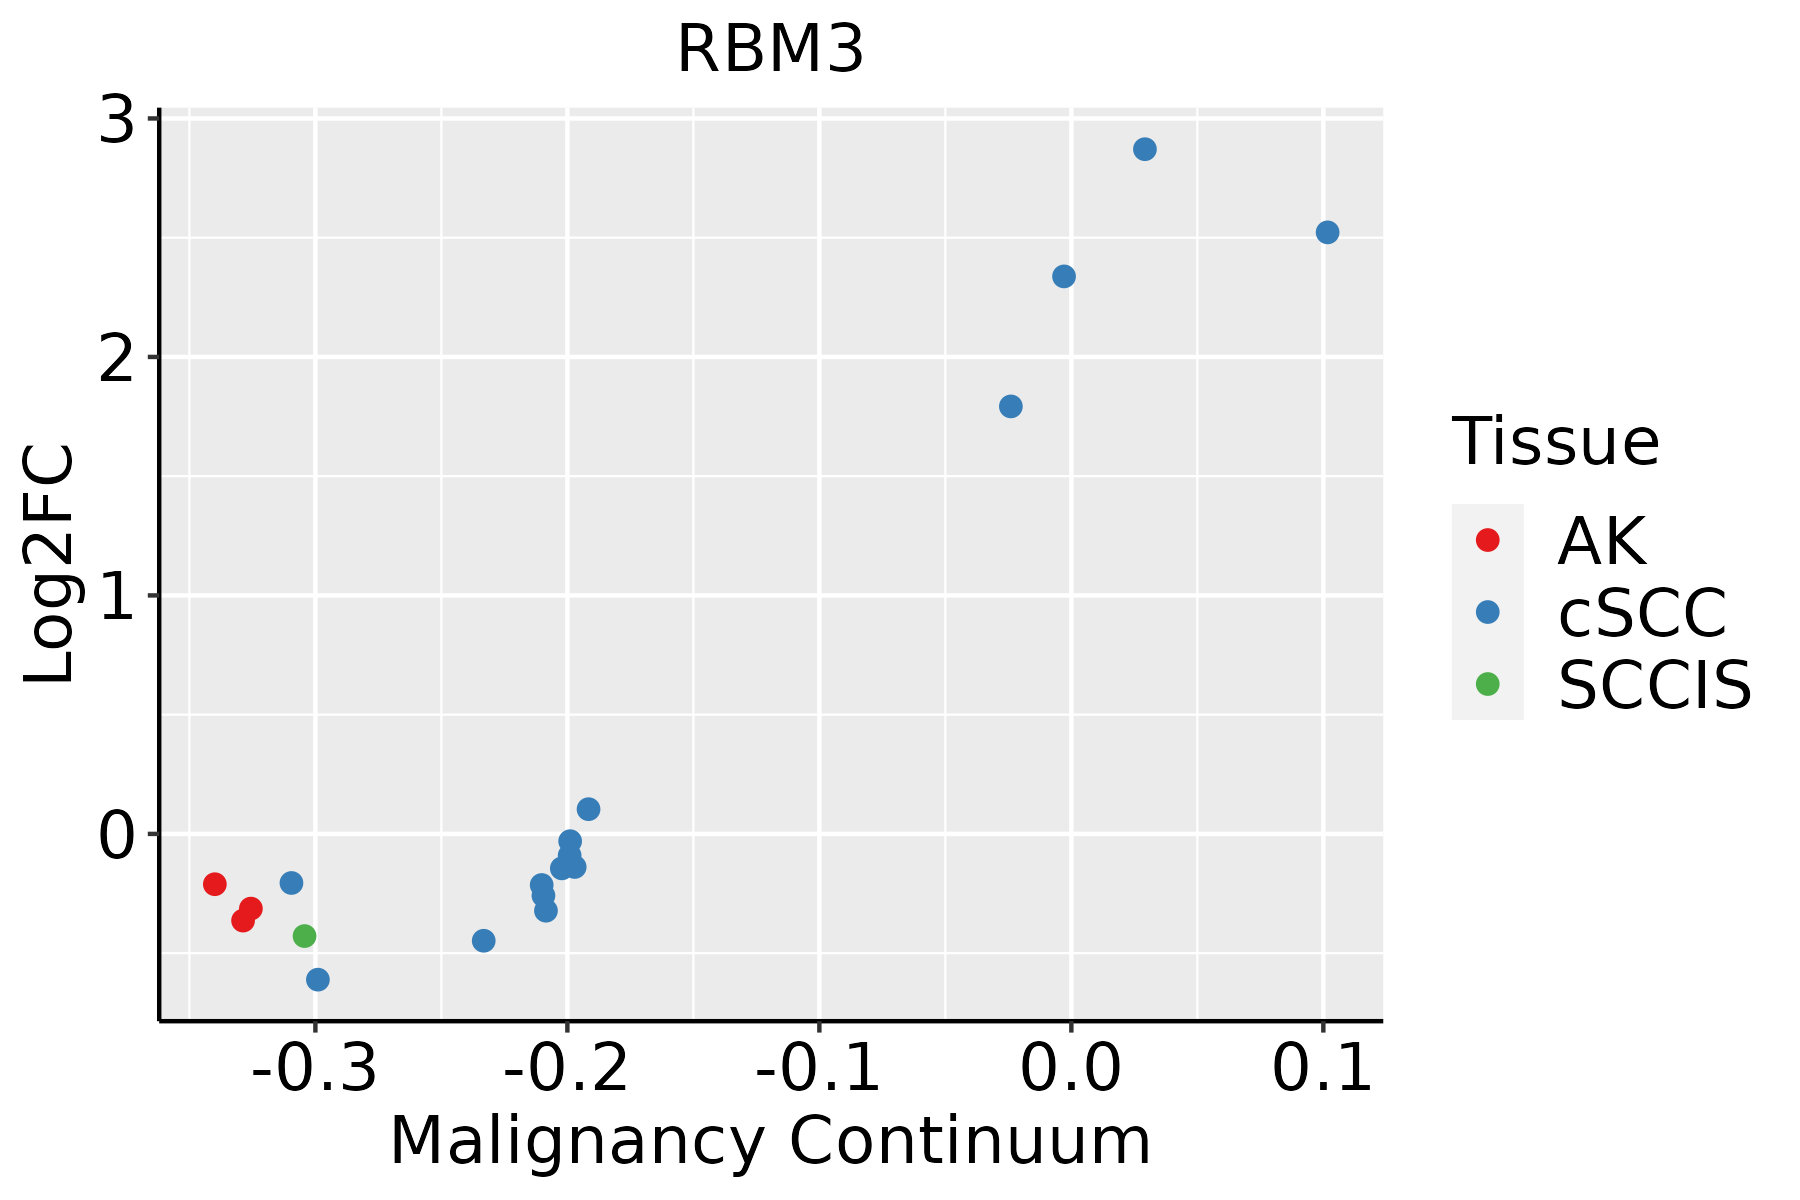 | AK: Actinic keratosis |
| cSCC: Cutaneous squamous cell carcinoma |
| SCCIS:squamous cell carcinoma in situ |
| Thyroid |  | ATC: Anaplastic thyroid cancer |
| HT: Hashimoto's thyroiditis |
| PTC: Papillary thyroid cancer |
| GO ID | Tissue | Disease Stage | Description | Gene Ratio | Bg Ratio | pvalue | p.adjust | Count |
| GO:00083809 | Breast | Precancer | RNA splicing | 65/1080 | 434/18723 | 1.27e-12 | 2.53e-10 | 65 |
| GO:00434849 | Breast | Precancer | regulation of RNA splicing | 34/1080 | 148/18723 | 2.66e-12 | 4.75e-10 | 34 |
| GO:00064179 | Breast | Precancer | regulation of translation | 67/1080 | 468/18723 | 4.71e-12 | 7.64e-10 | 67 |
| GO:00457279 | Breast | Precancer | positive regulation of translation | 32/1080 | 136/18723 | 5.89e-12 | 9.27e-10 | 32 |
| GO:00003759 | Breast | Precancer | RNA splicing, via transesterification reactions | 52/1080 | 324/18723 | 1.74e-11 | 2.22e-09 | 52 |
| GO:00003779 | Breast | Precancer | RNA splicing, via transesterification reactions with bulged adenosine as nucleophile | 51/1080 | 320/18723 | 3.55e-11 | 4.04e-09 | 51 |
| GO:00003989 | Breast | Precancer | mRNA splicing, via spliceosome | 51/1080 | 320/18723 | 3.55e-11 | 4.04e-09 | 51 |
| GO:00342509 | Breast | Precancer | positive regulation of cellular amide metabolic process | 33/1080 | 162/18723 | 1.72e-10 | 1.77e-08 | 33 |
| GO:00480249 | Breast | Precancer | regulation of mRNA splicing, via spliceosome | 22/1080 | 101/18723 | 5.29e-08 | 3.18e-06 | 22 |
| GO:19033118 | Breast | Precancer | regulation of mRNA metabolic process | 38/1080 | 288/18723 | 1.63e-06 | 5.97e-05 | 38 |
| GO:00506848 | Breast | Precancer | regulation of mRNA processing | 23/1080 | 137/18723 | 3.49e-06 | 1.13e-04 | 23 |
| GO:00331207 | Breast | Precancer | positive regulation of RNA splicing | 9/1080 | 37/18723 | 1.96e-04 | 3.10e-03 | 9 |
| GO:00480266 | Breast | Precancer | positive regulation of mRNA splicing, via spliceosome | 5/1080 | 22/18723 | 7.32e-03 | 4.88e-02 | 5 |
| GO:000838014 | Breast | IDC | RNA splicing | 73/1434 | 434/18723 | 1.27e-10 | 1.57e-08 | 73 |
| GO:004348414 | Breast | IDC | regulation of RNA splicing | 36/1434 | 148/18723 | 3.32e-10 | 3.77e-08 | 36 |
| GO:000037514 | Breast | IDC | RNA splicing, via transesterification reactions | 58/1434 | 324/18723 | 9.44e-10 | 9.58e-08 | 58 |
| GO:000037714 | Breast | IDC | RNA splicing, via transesterification reactions with bulged adenosine as nucleophile | 57/1434 | 320/18723 | 1.60e-09 | 1.49e-07 | 57 |
| GO:000039814 | Breast | IDC | mRNA splicing, via spliceosome | 57/1434 | 320/18723 | 1.60e-09 | 1.49e-07 | 57 |
| GO:000641714 | Breast | IDC | regulation of translation | 74/1434 | 468/18723 | 1.67e-09 | 1.53e-07 | 74 |
| GO:004572714 | Breast | IDC | positive regulation of translation | 33/1434 | 136/18723 | 1.92e-09 | 1.73e-07 | 33 |
| Hugo Symbol | Variant Class | Variant Classification | dbSNP RS | HGVSc | HGVSp | HGVSp Short | SWISSPROT | BIOTYPE | SIFT | PolyPhen | Tumor Sample Barcode | Tissue | Histology | Sex | Age | Stage | Therapy Types | Drugs | Outcome |
| RBM3 | SNV | Missense_Mutation | | c.185N>A | p.Val62Asp | p.V62D | P98179 | protein_coding | tolerated(1) | benign(0) | TCGA-E9-A1R2-01 | Breast | breast invasive carcinoma | Female | <65 | III/IV | Chemotherapy | taxotere | CR |
| RBM3 | SNV | Missense_Mutation | | c.287N>T | p.Ala96Val | p.A96V | P98179 | protein_coding | tolerated(0.08) | benign(0.003) | TCGA-EK-A2H1-01 | Cervix | cervical & endocervical cancer | Female | <65 | I/II | Chemotherapy | cetuximab | SD |
| RBM3 | SNV | Missense_Mutation | novel | c.269N>C | p.Arg90Thr | p.R90T | P98179 | protein_coding | deleterious(0.01) | possibly_damaging(0.587) | TCGA-VS-A94Z-01 | Cervix | cervical & endocervical cancer | Female | <65 | I/II | Chemotherapy | cisplatin | CR |
| RBM3 | SNV | Missense_Mutation | rs782287047 | c.295N>T | p.Arg99Cys | p.R99C | P98179 | protein_coding | tolerated(0.14) | benign(0) | TCGA-D5-6927-01 | Colorectum | colon adenocarcinoma | Male | <65 | I/II | Unknown | Unknown | SD |
| RBM3 | SNV | Missense_Mutation | novel | c.42N>A | p.Asn14Lys | p.N14K | P98179 | protein_coding | deleterious(0.01) | possibly_damaging(0.9) | TCGA-A5-A1OG-01 | Endometrium | uterine corpus endometrioid carcinoma | Female | >=65 | III/IV | Chemotherapy | taxol | PD |
| RBM3 | SNV | Missense_Mutation | novel | c.392N>A | p.Arg131His | p.R131H | P98179 | protein_coding | tolerated(0.27) | benign(0.078) | TCGA-AJ-A8CW-01 | Endometrium | uterine corpus endometrioid carcinoma | Female | <65 | I/II | Unknown | Unknown | SD |
| RBM3 | SNV | Missense_Mutation | novel | c.305N>T | p.Ser102Ile | p.S102I | P98179 | protein_coding | deleterious(0.02) | benign(0) | TCGA-AP-A059-01 | Endometrium | uterine corpus endometrioid carcinoma | Female | >=65 | I/II | Unknown | Unknown | SD |
| RBM3 | SNV | Missense_Mutation | | c.113T>G | p.Val38Gly | p.V38G | P98179 | protein_coding | deleterious(0) | probably_damaging(0.975) | TCGA-BS-A0UV-01 | Endometrium | uterine corpus endometrioid carcinoma | Female | <65 | III/IV | Unknown | Unknown | SD |
| RBM3 | SNV | Missense_Mutation | | c.284N>A | p.Gly95Glu | p.G95E | P98179 | protein_coding | tolerated(0.28) | possibly_damaging(0.604) | TCGA-D1-A17F-01 | Endometrium | uterine corpus endometrioid carcinoma | Female | >=65 | I/II | Unknown | Unknown | SD |
| RBM3 | SNV | Missense_Mutation | novel | c.88N>A | p.Gly30Arg | p.G30R | P98179 | protein_coding | tolerated(0.11) | possibly_damaging(0.729) | TCGA-EO-A22X-01 | Endometrium | uterine corpus endometrioid carcinoma | Female | <65 | III/IV | Unspecific | Carboplatin | Complete Response |


