
|
|||||
|
 | |
| |
| |
| |
| |
| |
|
Gene: RBM27 |
Gene summary for RBM27 |
| Gene information | Species | Human | Gene symbol | RBM27 | Gene ID | 54439 |
| Gene name | RNA binding motif protein 27 | |
| Gene Alias | ARRS1 | |
| Cytomap | 5q32 | |
| Gene Type | protein-coding | GO ID | GO:0006139 | UniProtAcc | Q9P2N5 |
Top |
Malignant transformation analysis |
| Identification of the aberrant gene expression in precancerous and cancerous lesions by comparing the gene expression of stem-like cells in diseased tissues with normal stem cells |
| Entrez ID | Symbol | Replicates | Species | Organ | Tissue | Adj P-value | Log2FC | Malignancy |
| 54439 | RBM27 | HCC1_Meng | Human | Liver | HCC | 3.63e-37 | 5.74e-02 | 0.0246 |
| 54439 | RBM27 | HCC2_Meng | Human | Liver | HCC | 3.67e-07 | 6.59e-02 | 0.0107 |
| 54439 | RBM27 | HCC1 | Human | Liver | HCC | 2.45e-03 | 2.34e+00 | 0.5336 |
| 54439 | RBM27 | HCC2 | Human | Liver | HCC | 4.66e-21 | 3.86e+00 | 0.5341 |
| 54439 | RBM27 | HCC5 | Human | Liver | HCC | 1.10e-02 | 1.38e+00 | 0.4932 |
| 54439 | RBM27 | Pt13.a | Human | Liver | HCC | 3.73e-07 | 2.37e-01 | 0.021 |
| 54439 | RBM27 | Pt13.b | Human | Liver | HCC | 2.37e-21 | 3.23e-01 | 0.0251 |
| 54439 | RBM27 | Pt14.a | Human | Liver | HCC | 3.14e-05 | 3.90e-01 | 0.0169 |
| 54439 | RBM27 | Pt14.b | Human | Liver | HCC | 6.58e-10 | 3.46e-01 | 0.018 |
| 54439 | RBM27 | Pt14.d | Human | Liver | HCC | 5.85e-07 | 2.81e-01 | 0.0143 |
| 54439 | RBM27 | S016 | Human | Liver | HCC | 9.39e-05 | 1.36e-01 | 0.2243 |
| 54439 | RBM27 | S028 | Human | Liver | HCC | 2.68e-02 | 2.20e-01 | 0.2503 |
| 54439 | RBM27 | P1_S1_AK | Human | Skin | AK | 6.05e-09 | 3.95e-01 | -0.3399 |
| 54439 | RBM27 | P2_S3_AK | Human | Skin | AK | 3.08e-04 | 3.21e-01 | -0.3287 |
| 54439 | RBM27 | P4_S8_cSCC | Human | Skin | cSCC | 9.80e-16 | 3.73e-01 | -0.3095 |
| 54439 | RBM27 | P5_S10_cSCC | Human | Skin | cSCC | 3.48e-17 | 3.40e-01 | -0.299 |
| 54439 | RBM27 | P1_cSCC | Human | Skin | cSCC | 1.86e-27 | 8.05e-01 | 0.0292 |
| 54439 | RBM27 | P2_cSCC | Human | Skin | cSCC | 5.49e-21 | 5.58e-01 | -0.024 |
| 54439 | RBM27 | P4_cSCC | Human | Skin | cSCC | 1.23e-25 | 5.49e-01 | -0.00290000000000005 |
| 54439 | RBM27 | P10_cSCC | Human | Skin | cSCC | 8.64e-38 | 8.20e-01 | 0.1017 |
| Page: 1 |
| Tissue | Expression Dynamics | Abbreviation |
| Liver | 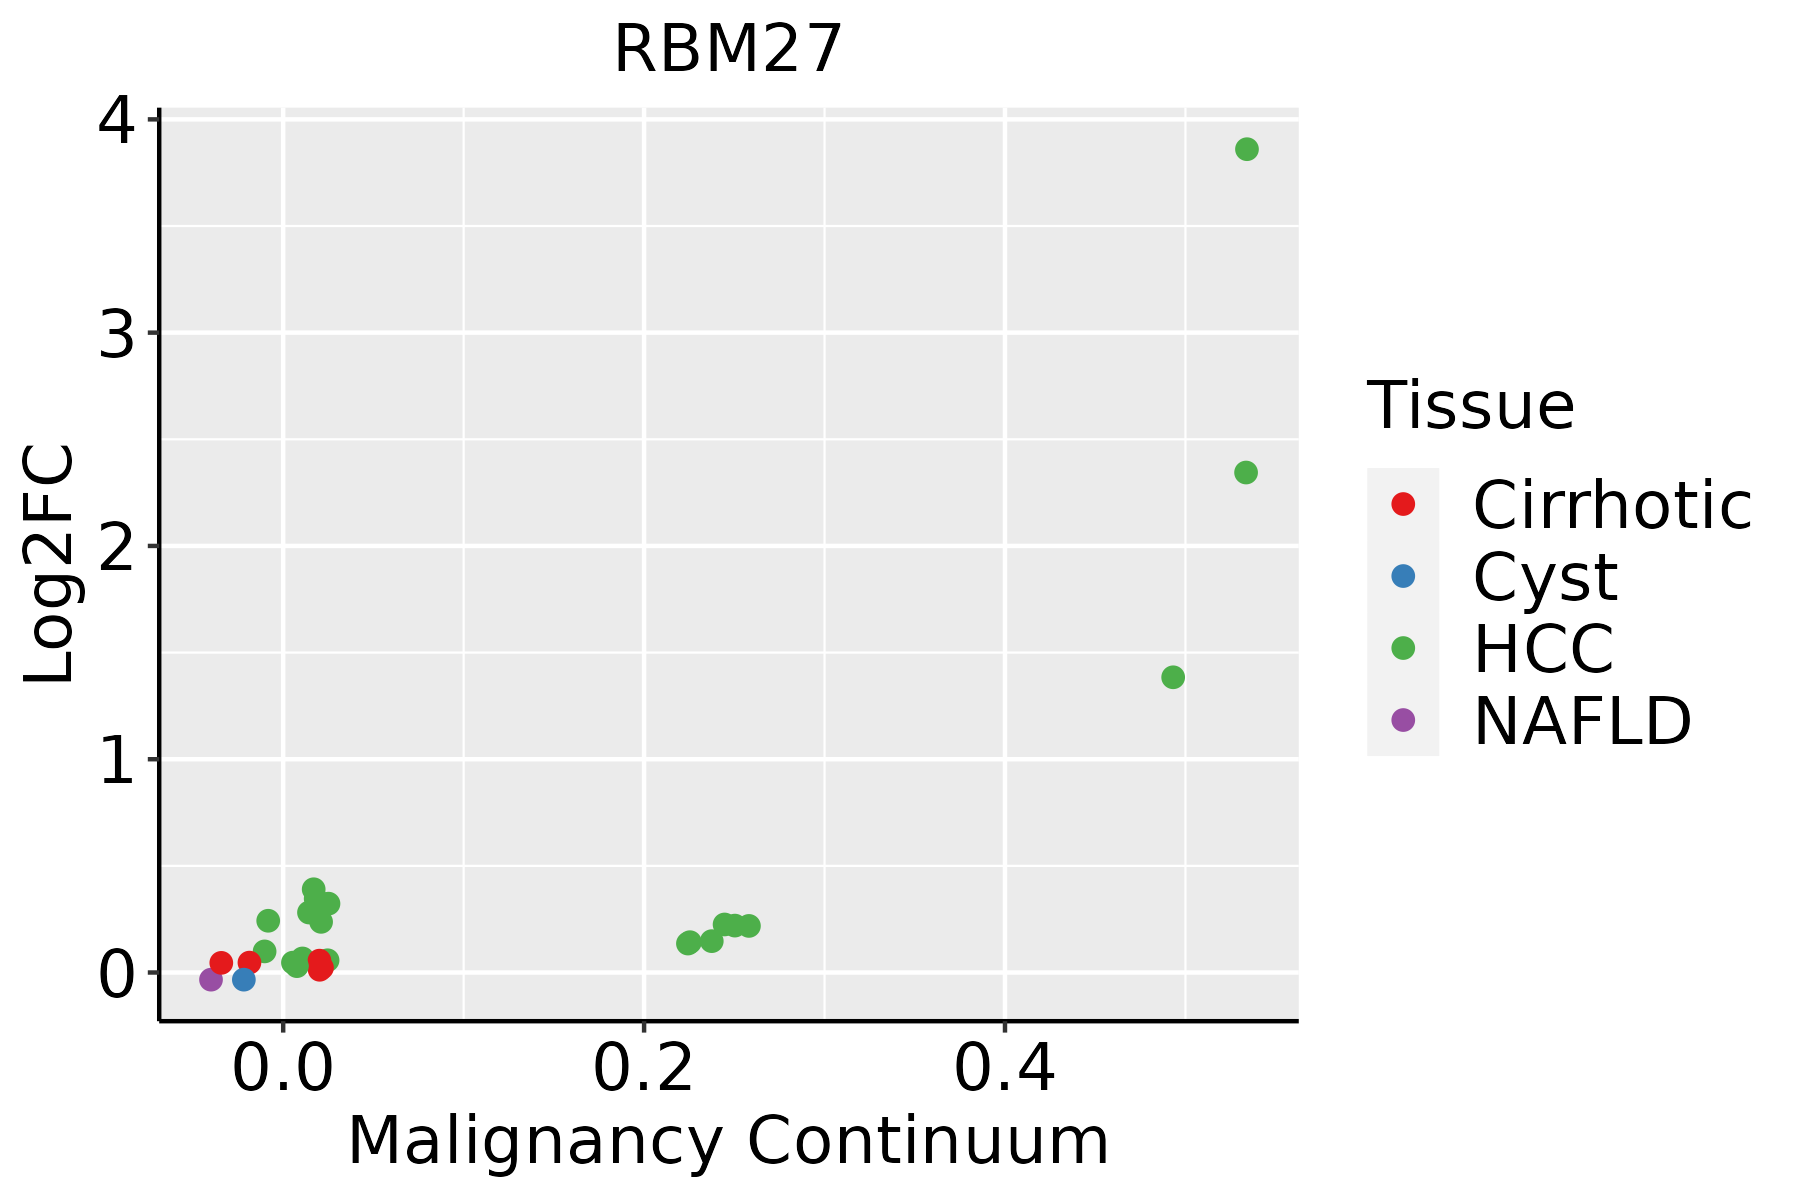 | HCC: Hepatocellular carcinoma |
| NAFLD: Non-alcoholic fatty liver disease | ||
| Skin | 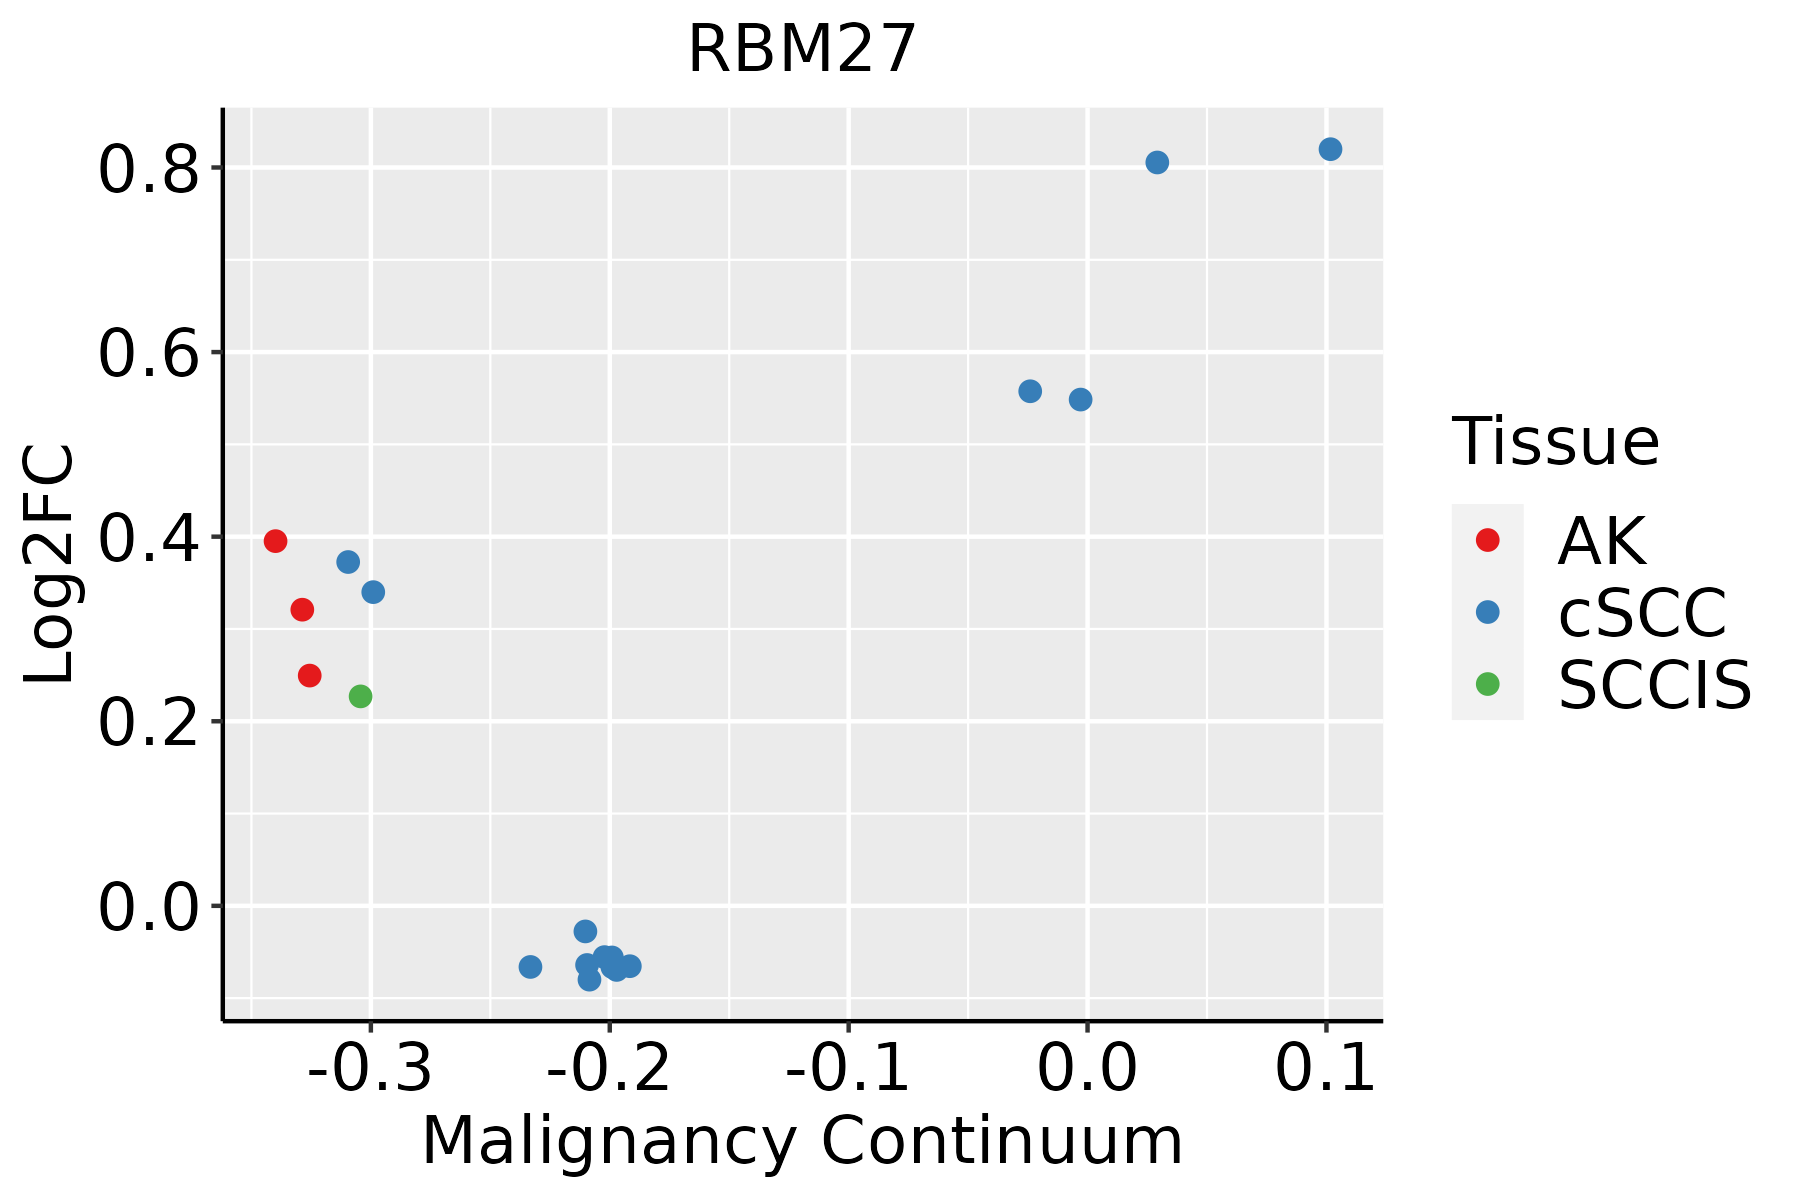 | AK: Actinic keratosis |
| cSCC: Cutaneous squamous cell carcinoma | ||
| SCCIS:squamous cell carcinoma in situ |
| ∗log2FC in expression of this searched gene in stem-like cells from each diseased tissue sample relative to stem-like cells in normal samples in each tissue plotted against the malignancy continuum. Samples are colored based on if they are from different disease stage. |
Top |
Malignant transformation related pathway analysis |
| Find out the enriched GO biological processes and KEGG pathways involved in transition from healthy to precancer to cancer |
| Tissue | Disease Stage | Enriched GO biological Processes |
| Colorectum | AD |  |
| Colorectum | SER |  |
| Colorectum | MSS |  |
| Colorectum | MSI-H |  |
| Colorectum | FAP |  |
| ∗Top 15 enriched GO BP terms are showed in the bar plot of each disease state in each tissue. Each row represents a significant GO biological process which is colored according to the -log10(p.adjust). |
| Page: 1 2 3 4 5 6 7 8 9 |
| GO ID | Tissue | Disease Stage | Description | Gene Ratio | Bg Ratio | pvalue | p.adjust | Count |
| Page: 1 |
| Pathway ID | Tissue | Disease Stage | Description | Gene Ratio | Bg Ratio | pvalue | p.adjust | qvalue | Count |
| Page: 1 |
Top |
Cell-cell communication analysis |
| Identification of potential cell-cell interactions between two cell types and their ligand-receptor pairs for different disease states |
| Ligand | Receptor | LRpair | Pathway | Tissue | Disease Stage |
| Page: 1 |
Top |
Single-cell gene regulatory network inference analysis |
| Find out the significant the regulons (TFs) and the target genes of each regulon across cell types for different disease states |
| TF | Cell Type | Tissue | Disease Stage | Target Gene | RSS | Regulon Activity |
| ∗The dot plots of a searched regulon are shown for all cell subpopulations in each disease state of each tissue based on the regulon specific score inferred using pySCENIC and by calculating the average expression. |
| Page: 1 |
Top |
Somatic mutation of malignant transformation related genes |
| Annotation of somatic variants for genes involved in malignant transformation |
| Hugo Symbol | Variant Class | Variant Classification | dbSNP RS | HGVSc | HGVSp | HGVSp Short | SWISSPROT | BIOTYPE | SIFT | PolyPhen | Tumor Sample Barcode | Tissue | Histology | Sex | Age | Stage | Therapy Types | Drugs | Outcome |
| RBM27 | SNV | Missense_Mutation | c.722N>A | p.Thr241Asn | p.T241N | Q9P2N5 | protein_coding | deleterious(0.04) | possibly_damaging(0.829) | TCGA-A2-A04P-01 | Breast | breast invasive carcinoma | Female | <65 | III/IV | Chemotherapy | taxol | PD | |
| RBM27 | SNV | Missense_Mutation | rs749571390 | c.2801C>T | p.Ala934Val | p.A934V | Q9P2N5 | protein_coding | deleterious(0.01) | benign(0.264) | TCGA-A2-A25B-01 | Breast | breast invasive carcinoma | Female | <65 | I/II | Chemotherapy | taxotere | PD |
| RBM27 | SNV | Missense_Mutation | novel | c.2174A>G | p.His725Arg | p.H725R | Q9P2N5 | protein_coding | deleterious(0.04) | possibly_damaging(0.84) | TCGA-A8-A06R-01 | Breast | breast invasive carcinoma | Female | >=65 | I/II | Chemotherapy | 5-fluorouracil | CR |
| RBM27 | SNV | Missense_Mutation | novel | c.2710N>C | p.Asp904His | p.D904H | Q9P2N5 | protein_coding | deleterious(0.01) | probably_damaging(0.995) | TCGA-AC-A5XS-01 | Breast | breast invasive carcinoma | Female | >=65 | I/II | Hormone Therapy | femara | SD |
| RBM27 | SNV | Missense_Mutation | c.2965N>C | p.Glu989Gln | p.E989Q | Q9P2N5 | protein_coding | deleterious(0.04) | benign(0.039) | TCGA-AC-A5XS-01 | Breast | breast invasive carcinoma | Female | >=65 | I/II | Hormone Therapy | femara | SD | |
| RBM27 | SNV | Missense_Mutation | c.77N>T | p.Ser26Leu | p.S26L | Q9P2N5 | protein_coding | deleterious(0) | benign(0.26) | TCGA-AO-A128-01 | Breast | breast invasive carcinoma | Female | <65 | I/II | Chemotherapy | doxorubicin | SD | |
| RBM27 | SNV | Missense_Mutation | c.1345N>T | p.Pro449Ser | p.P449S | Q9P2N5 | protein_coding | deleterious(0.02) | probably_damaging(0.968) | TCGA-BH-A0HF-01 | Breast | breast invasive carcinoma | Female | >=65 | I/II | Hormone Therapy | arimidex | SD | |
| RBM27 | SNV | Missense_Mutation | c.674N>G | p.Ser225Cys | p.S225C | Q9P2N5 | protein_coding | deleterious(0) | benign(0.431) | TCGA-C8-A26Y-01 | Breast | breast invasive carcinoma | Female | >=65 | I/II | Unknown | Unknown | SD | |
| RBM27 | SNV | Missense_Mutation | novel | c.2879N>T | p.Gly960Val | p.G960V | Q9P2N5 | protein_coding | tolerated(0.59) | benign(0.007) | TCGA-PE-A5DC-01 | Breast | breast invasive carcinoma | Female | >=65 | III/IV | Unknown | Unknown | SD |
| RBM27 | insertion | Frame_Shift_Ins | novel | c.2545_2546insA | p.Asn851LysfsTer29 | p.N851Kfs*29 | Q9P2N5 | protein_coding | TCGA-A8-A09Z-01 | Breast | breast invasive carcinoma | Female | >=65 | I/II | Unknown | Unknown | SD |
| Page: 1 2 3 4 5 6 7 8 9 10 11 |
Top |
Related drugs of malignant transformation related genes |
| Identification of chemicals and drugs interact with genes involved in malignant transfromation |
| (DGIdb 4.0) |
| Entrez ID | Symbol | Category | Interaction Types | Drug Claim Name | Drug Name | PMIDs |
| Page: 1 |

Copyright 2023-Present -The University of Texas Health Science Center at Houston |