
|
|||||
|
 | |
| |
| |
| |
| |
| |
|
Gene: RBM26 |
Gene summary for RBM26 |
| Gene information | Species | Human | Gene symbol | RBM26 | Gene ID | 64062 |
| Gene name | RNA binding motif protein 26 | |
| Gene Alias | ARRS2 | |
| Cytomap | 13q31.1 | |
| Gene Type | protein-coding | GO ID | GO:0006139 | UniProtAcc | A0A087X0H9 |
Top |
Malignant transformation analysis |
| Identification of the aberrant gene expression in precancerous and cancerous lesions by comparing the gene expression of stem-like cells in diseased tissues with normal stem cells |
| Entrez ID | Symbol | Replicates | Species | Organ | Tissue | Adj P-value | Log2FC | Malignancy |
| 64062 | RBM26 | CCI_2 | Human | Cervix | CC | 7.27e-05 | 8.52e-01 | 0.5249 |
| 64062 | RBM26 | CCI_3 | Human | Cervix | CC | 1.38e-02 | 5.66e-01 | 0.516 |
| 64062 | RBM26 | L1 | Human | Cervix | CC | 9.11e-05 | -2.24e-01 | 0.0802 |
| 64062 | RBM26 | HTA11_3410_2000001011 | Human | Colorectum | AD | 2.37e-37 | -8.78e-01 | 0.0155 |
| 64062 | RBM26 | HTA11_2487_2000001011 | Human | Colorectum | SER | 1.27e-09 | -6.47e-01 | -0.1808 |
| 64062 | RBM26 | HTA11_2951_2000001011 | Human | Colorectum | AD | 5.26e-04 | -7.90e-01 | 0.0216 |
| 64062 | RBM26 | HTA11_78_2000001011 | Human | Colorectum | AD | 2.33e-04 | -4.74e-01 | -0.1088 |
| 64062 | RBM26 | HTA11_3361_2000001011 | Human | Colorectum | AD | 2.73e-18 | -8.85e-01 | -0.1207 |
| 64062 | RBM26 | HTA11_83_2000001011 | Human | Colorectum | SER | 2.27e-05 | -6.00e-01 | -0.1526 |
| 64062 | RBM26 | HTA11_696_2000001011 | Human | Colorectum | AD | 1.15e-25 | -6.84e-01 | -0.1464 |
| 64062 | RBM26 | HTA11_866_2000001011 | Human | Colorectum | AD | 1.39e-18 | -6.24e-01 | -0.1001 |
| 64062 | RBM26 | HTA11_1391_2000001011 | Human | Colorectum | AD | 1.33e-07 | -5.18e-01 | -0.059 |
| 64062 | RBM26 | HTA11_2992_2000001011 | Human | Colorectum | SER | 1.89e-02 | -6.41e-01 | -0.1706 |
| 64062 | RBM26 | HTA11_5212_2000001011 | Human | Colorectum | AD | 3.01e-04 | -6.79e-01 | -0.2061 |
| 64062 | RBM26 | HTA11_5216_2000001011 | Human | Colorectum | SER | 1.68e-02 | -7.34e-01 | -0.1462 |
| 64062 | RBM26 | HTA11_546_2000001011 | Human | Colorectum | AD | 1.91e-02 | -4.75e-01 | -0.0842 |
| 64062 | RBM26 | HTA11_7862_2000001011 | Human | Colorectum | AD | 4.12e-05 | -5.30e-01 | -0.0179 |
| 64062 | RBM26 | HTA11_866_3004761011 | Human | Colorectum | AD | 3.20e-13 | -6.08e-01 | 0.096 |
| 64062 | RBM26 | HTA11_9408_2000001011 | Human | Colorectum | AD | 1.34e-03 | -8.82e-01 | 0.0451 |
| 64062 | RBM26 | HTA11_8622_2000001021 | Human | Colorectum | SER | 3.55e-06 | -7.75e-01 | 0.0528 |
| Page: 1 2 3 4 5 6 7 8 9 10 |
| Tissue | Expression Dynamics | Abbreviation |
| Cervix | 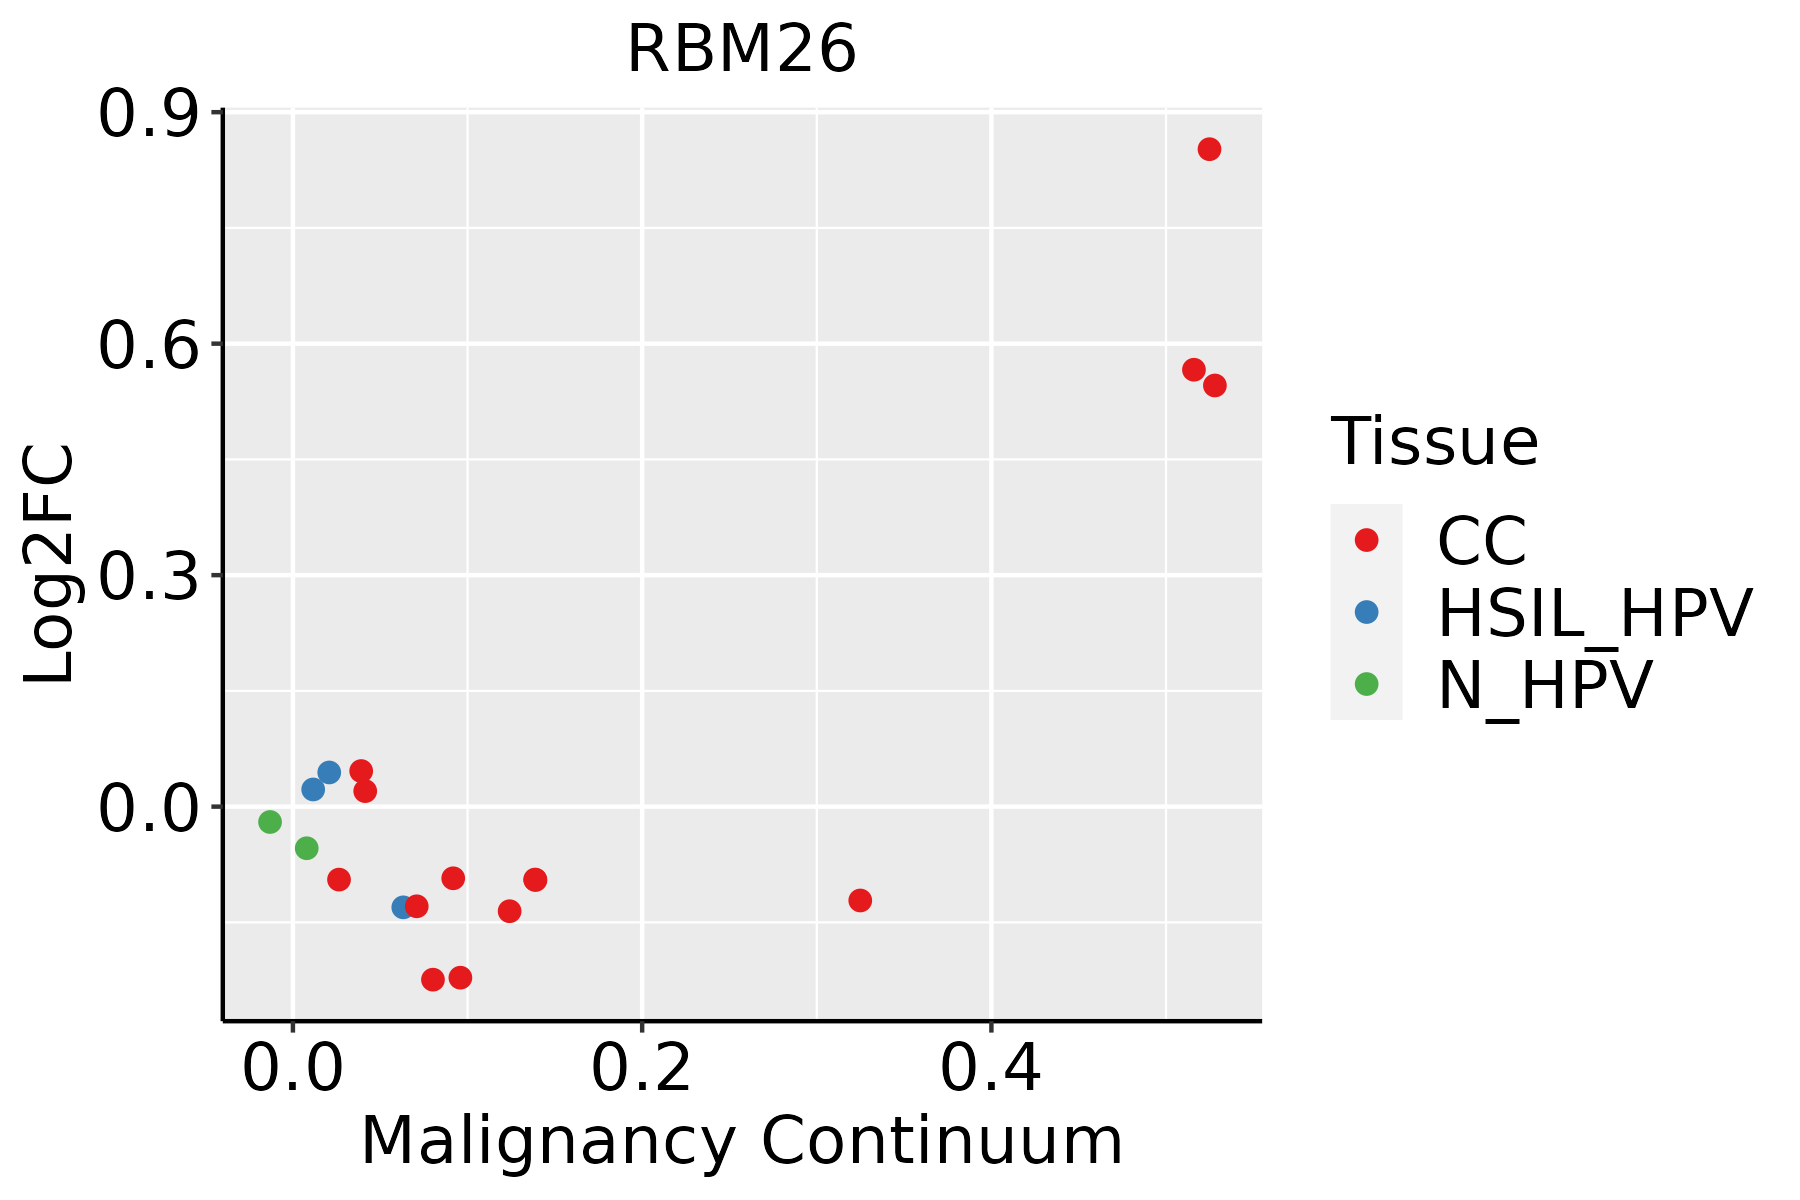 | CC: Cervix cancer |
| HSIL_HPV: HPV-infected high-grade squamous intraepithelial lesions | ||
| N_HPV: HPV-infected normal cervix | ||
| Colorectum (GSE201348) | 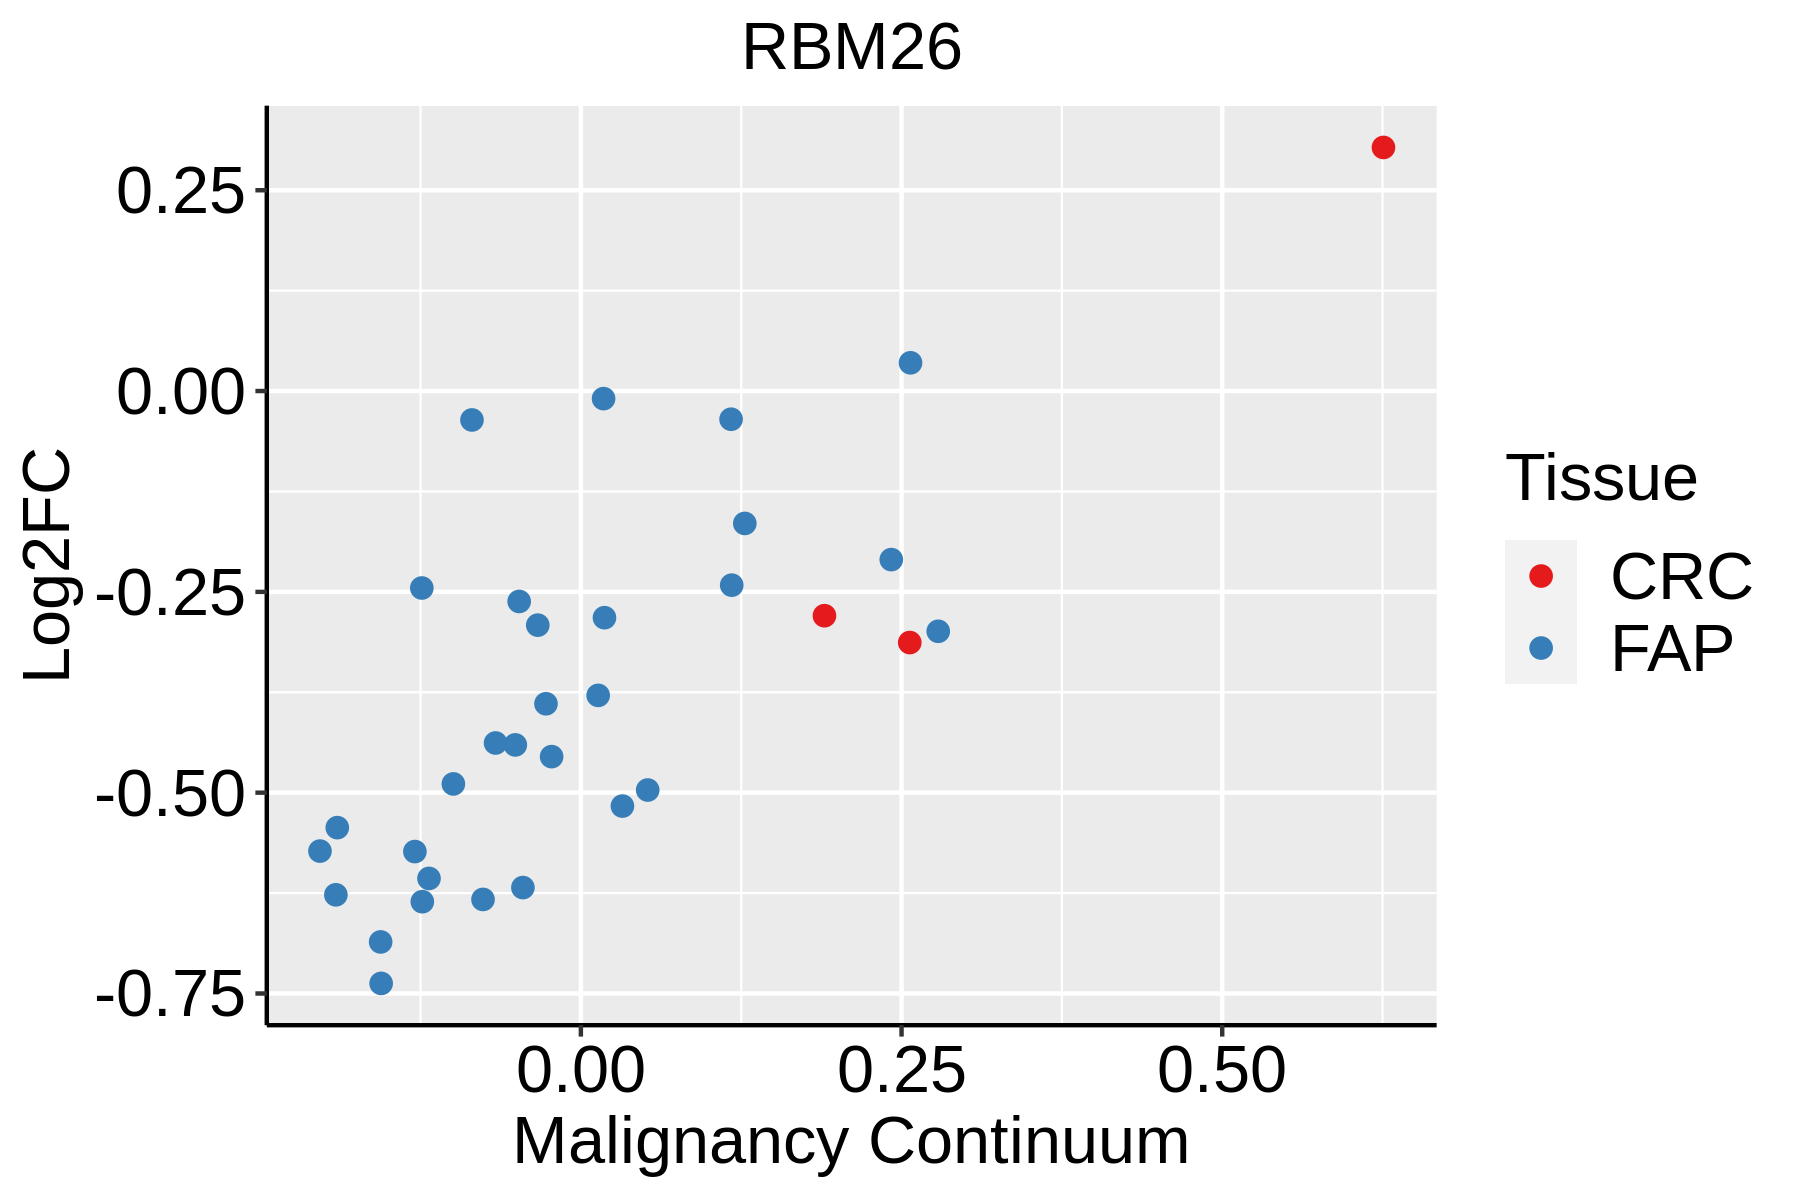 | FAP: Familial adenomatous polyposis |
| CRC: Colorectal cancer | ||
| Colorectum (HTA11) |  | AD: Adenomas |
| SER: Sessile serrated lesions | ||
| MSI-H: Microsatellite-high colorectal cancer | ||
| MSS: Microsatellite stable colorectal cancer | ||
| Esophagus |  | ESCC: Esophageal squamous cell carcinoma |
| HGIN: High-grade intraepithelial neoplasias | ||
| LGIN: Low-grade intraepithelial neoplasias | ||
| Liver |  | HCC: Hepatocellular carcinoma |
| NAFLD: Non-alcoholic fatty liver disease | ||
| Lung | 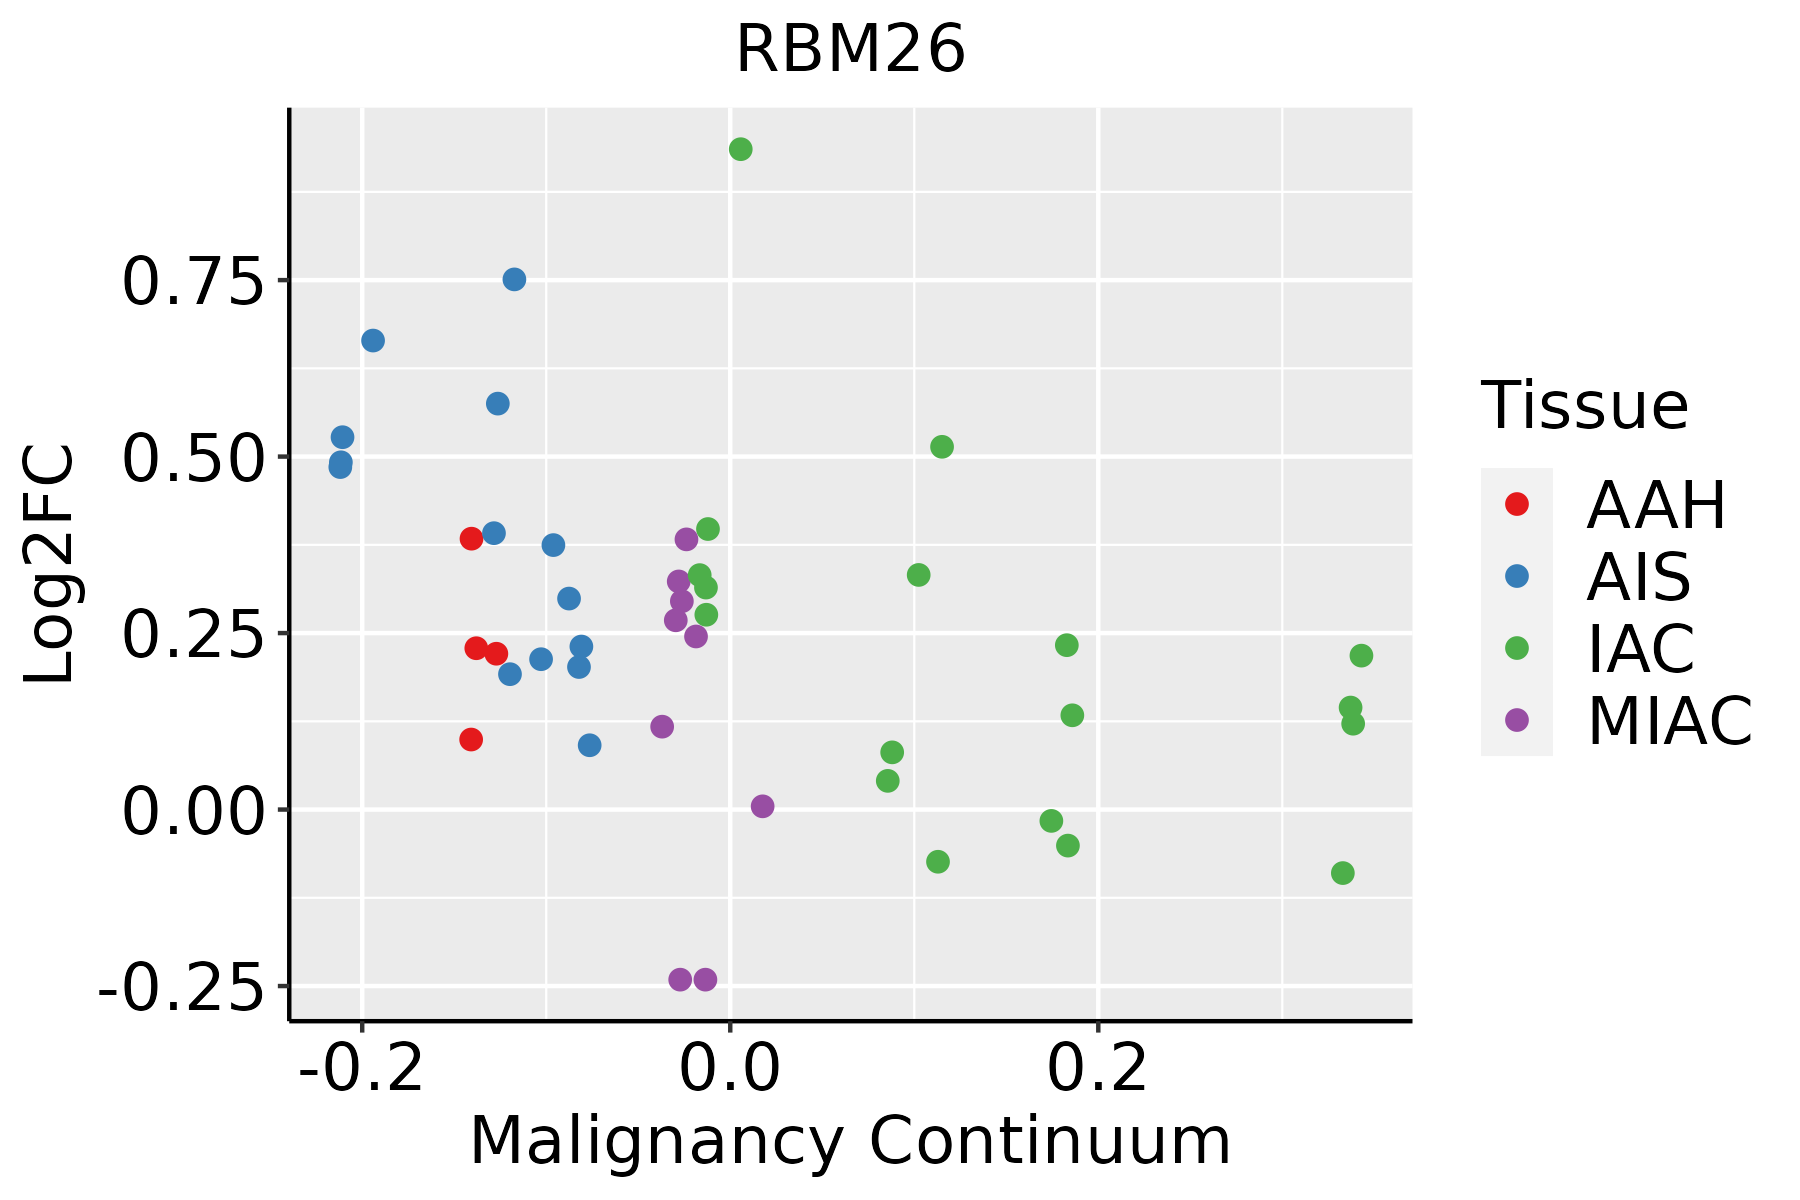 | AAH: Atypical adenomatous hyperplasia |
| AIS: Adenocarcinoma in situ | ||
| IAC: Invasive lung adenocarcinoma | ||
| MIA: Minimally invasive adenocarcinoma | ||
| Oral Cavity | 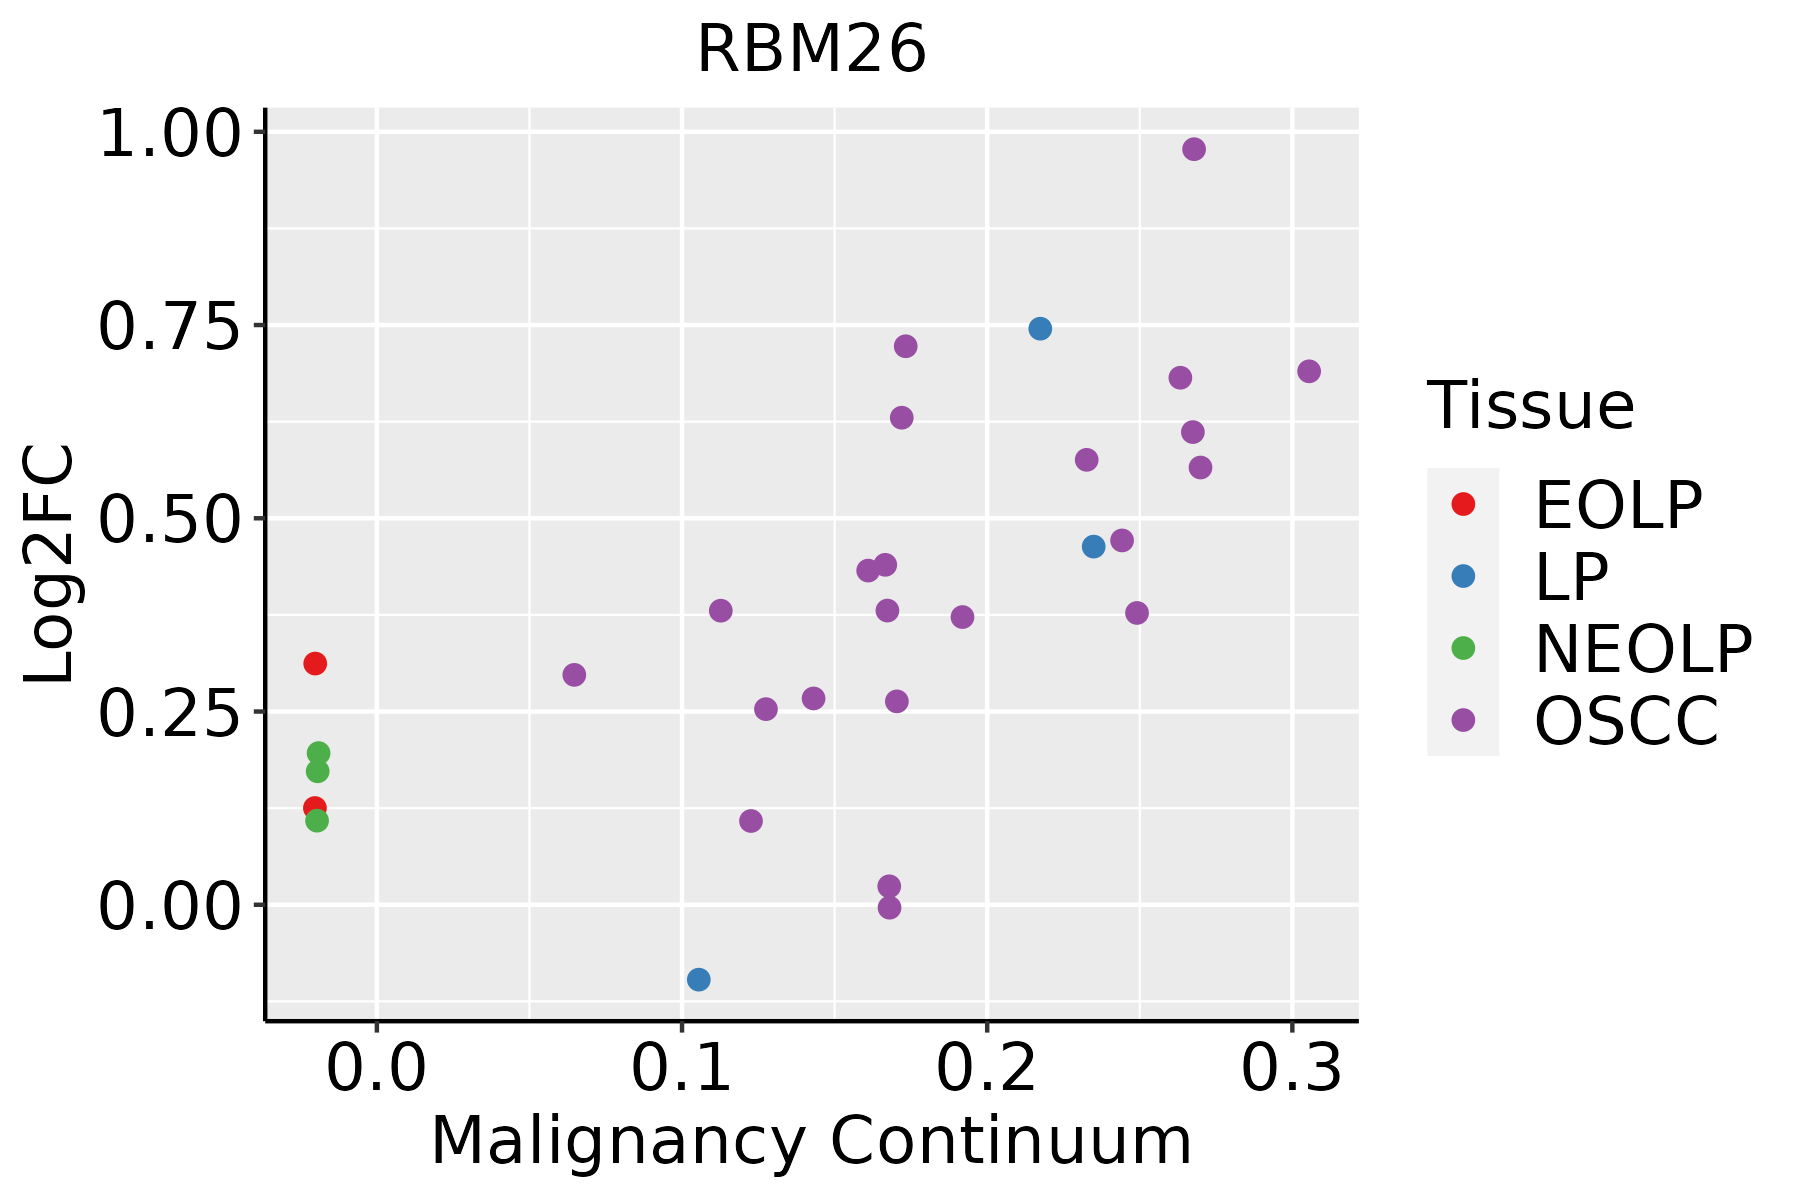 | EOLP: Erosive Oral lichen planus |
| LP: leukoplakia | ||
| NEOLP: Non-erosive oral lichen planus | ||
| OSCC: Oral squamous cell carcinoma | ||
| Skin | 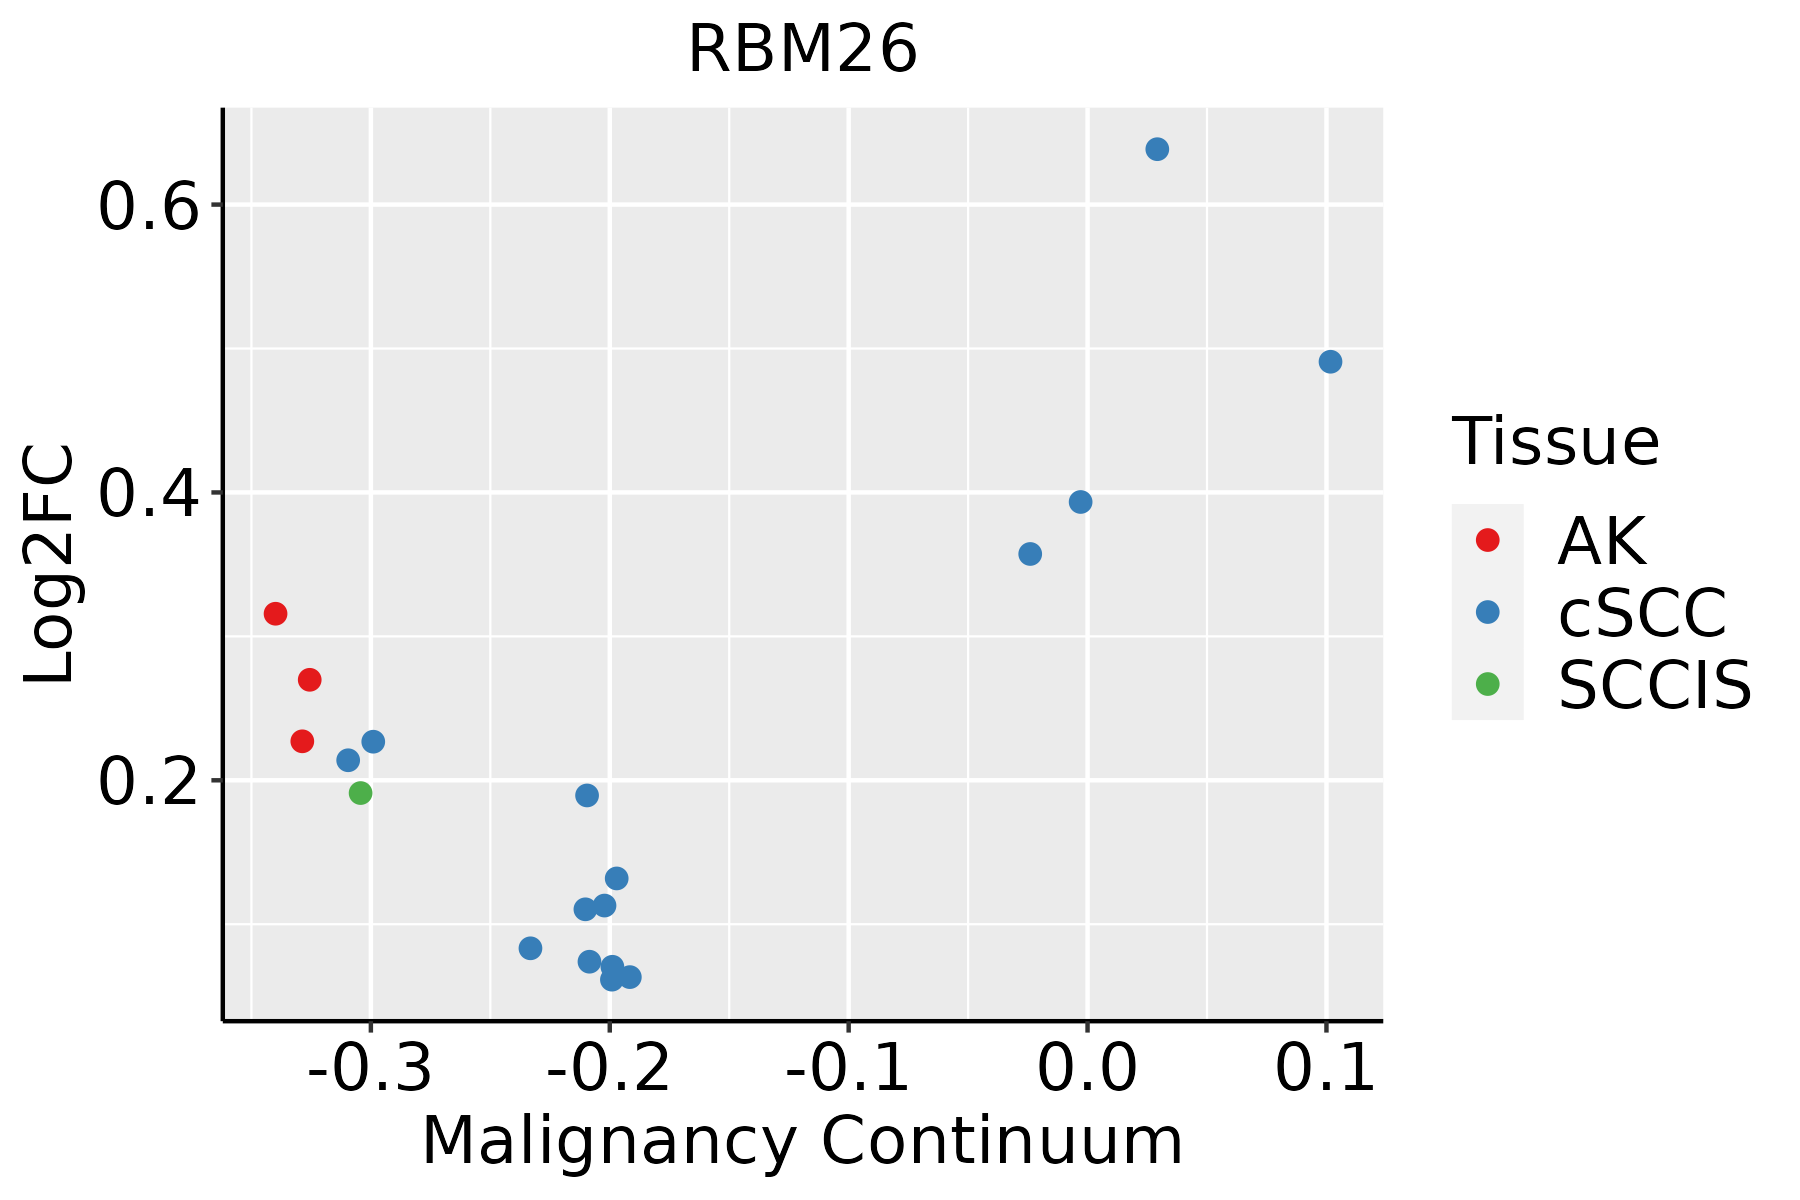 | AK: Actinic keratosis |
| cSCC: Cutaneous squamous cell carcinoma | ||
| SCCIS:squamous cell carcinoma in situ | ||
| Thyroid | 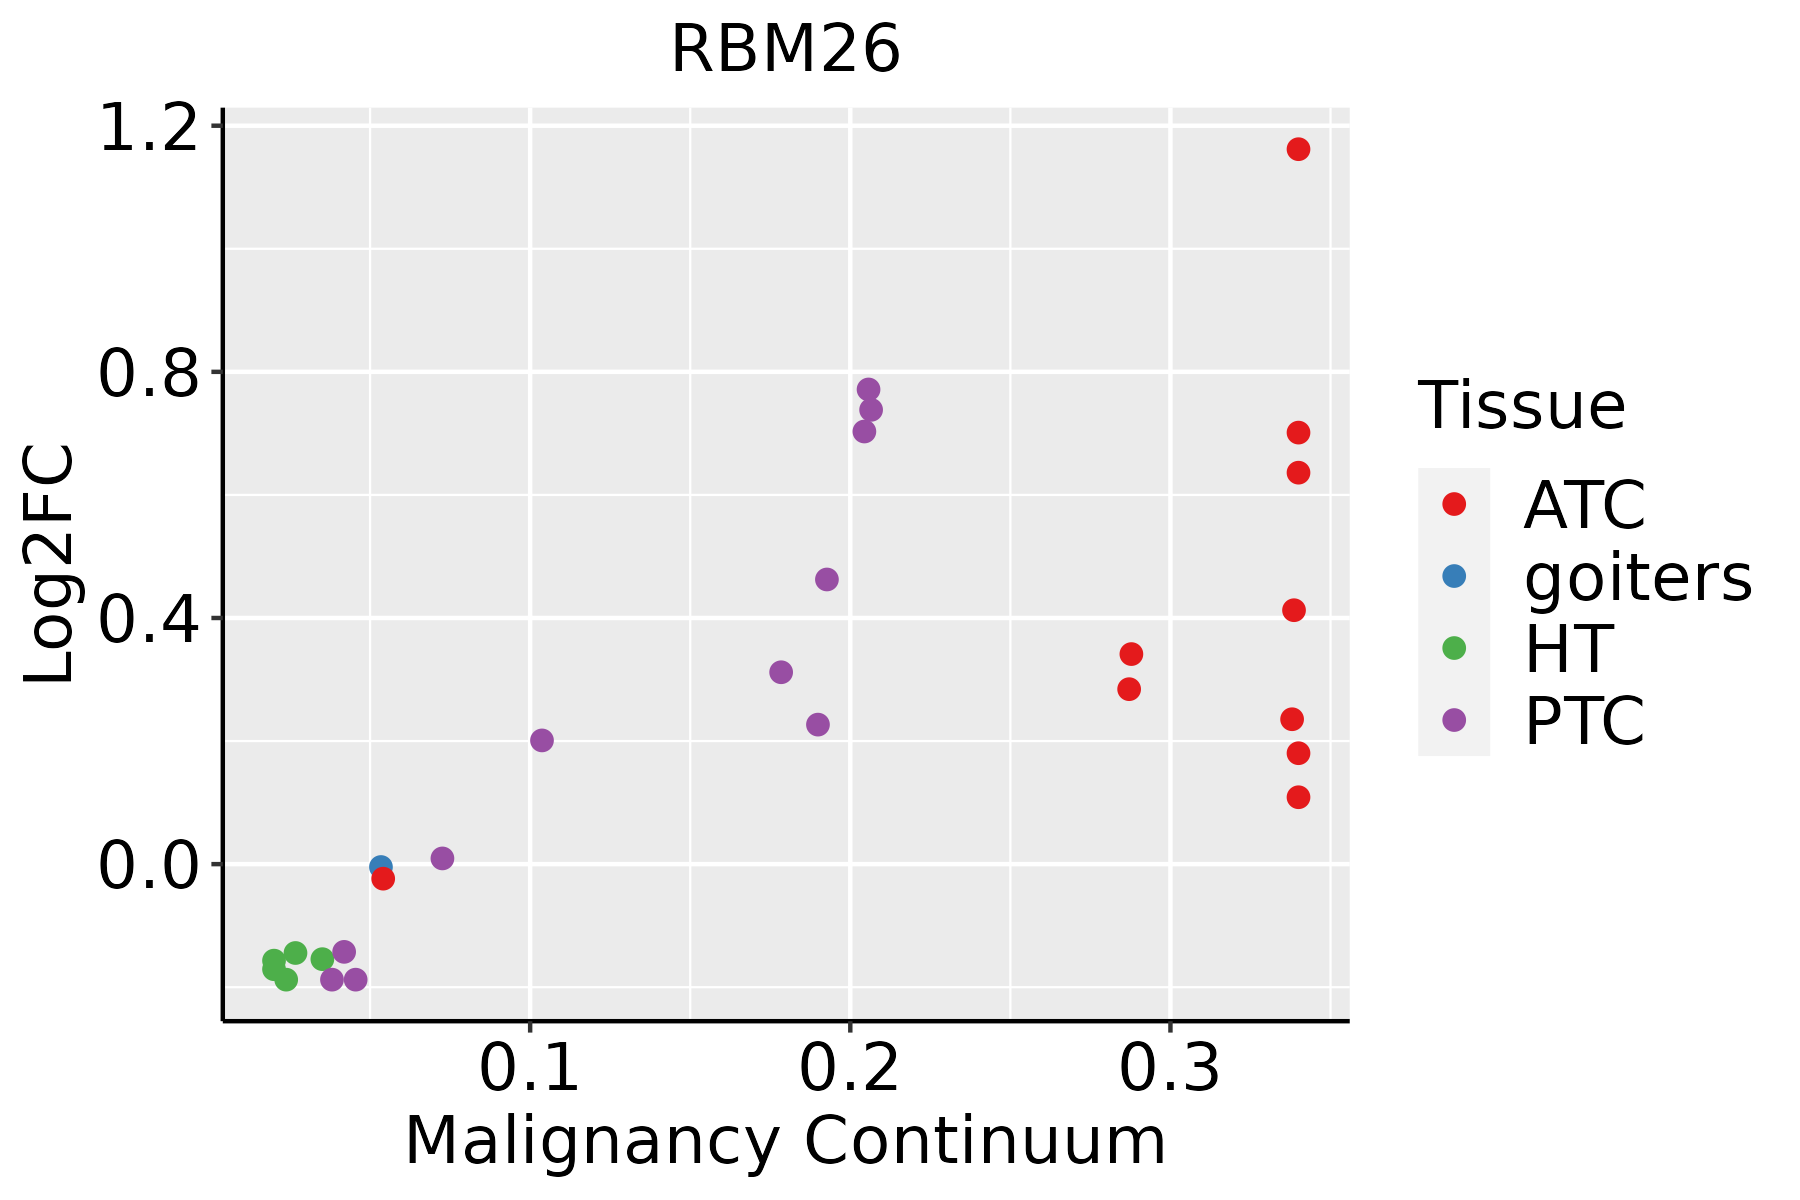 | ATC: Anaplastic thyroid cancer |
| HT: Hashimoto's thyroiditis | ||
| PTC: Papillary thyroid cancer |
| ∗log2FC in expression of this searched gene in stem-like cells from each diseased tissue sample relative to stem-like cells in normal samples in each tissue plotted against the malignancy continuum. Samples are colored based on if they are from different disease stage. |
Top |
Malignant transformation related pathway analysis |
| Find out the enriched GO biological processes and KEGG pathways involved in transition from healthy to precancer to cancer |
| Tissue | Disease Stage | Enriched GO biological Processes |
| Colorectum | AD |  |
| Colorectum | SER |  |
| Colorectum | MSS |  |
| Colorectum | MSI-H |  |
| Colorectum | FAP |  |
| ∗Top 15 enriched GO BP terms are showed in the bar plot of each disease state in each tissue. Each row represents a significant GO biological process which is colored according to the -log10(p.adjust). |
| Page: 1 2 3 4 5 6 7 8 9 |
| GO ID | Tissue | Disease Stage | Description | Gene Ratio | Bg Ratio | pvalue | p.adjust | Count |
| Page: 1 |
| Pathway ID | Tissue | Disease Stage | Description | Gene Ratio | Bg Ratio | pvalue | p.adjust | qvalue | Count |
| Page: 1 |
Top |
Cell-cell communication analysis |
| Identification of potential cell-cell interactions between two cell types and their ligand-receptor pairs for different disease states |
| Ligand | Receptor | LRpair | Pathway | Tissue | Disease Stage |
| Page: 1 |
Top |
Single-cell gene regulatory network inference analysis |
| Find out the significant the regulons (TFs) and the target genes of each regulon across cell types for different disease states |
| TF | Cell Type | Tissue | Disease Stage | Target Gene | RSS | Regulon Activity |
| ∗The dot plots of a searched regulon are shown for all cell subpopulations in each disease state of each tissue based on the regulon specific score inferred using pySCENIC and by calculating the average expression. |
| Page: 1 |
Top |
Somatic mutation of malignant transformation related genes |
| Annotation of somatic variants for genes involved in malignant transformation |
| Hugo Symbol | Variant Class | Variant Classification | dbSNP RS | HGVSc | HGVSp | HGVSp Short | SWISSPROT | BIOTYPE | SIFT | PolyPhen | Tumor Sample Barcode | Tissue | Histology | Sex | Age | Stage | Therapy Types | Drugs | Outcome |
| RBM26 | SNV | Missense_Mutation | c.1559N>C | p.Arg520Thr | p.R520T | protein_coding | tolerated(0.06) | possibly_damaging(0.637) | TCGA-A8-A09N-01 | Breast | breast invasive carcinoma | Female | <65 | III/IV | Unknown | Unknown | SD | ||
| RBM26 | SNV | Missense_Mutation | c.2549N>A | p.Arg850Gln | p.R850Q | protein_coding | tolerated(0.07) | probably_damaging(0.999) | TCGA-A8-A0A7-01 | Breast | breast invasive carcinoma | Female | <65 | I/II | Unknown | Unknown | SD | ||
| RBM26 | SNV | Missense_Mutation | c.700N>G | p.Pro234Ala | p.P234A | protein_coding | tolerated(0.06) | benign(0.075) | TCGA-AC-A23H-01 | Breast | breast invasive carcinoma | Female | >=65 | I/II | Unknown | Unknown | PD | ||
| RBM26 | SNV | Missense_Mutation | novel | c.1930N>G | p.Pro644Ala | p.P644A | protein_coding | tolerated(0.13) | possibly_damaging(0.885) | TCGA-AN-A0FL-01 | Breast | breast invasive carcinoma | Female | <65 | I/II | Unknown | Unknown | SD | |
| RBM26 | SNV | Missense_Mutation | rs778975958 | c.2066N>G | p.Val689Gly | p.V689G | protein_coding | tolerated(0.05) | probably_damaging(0.99) | TCGA-AQ-A04H-01 | Breast | breast invasive carcinoma | Female | <65 | III/IV | Chemotherapy | taxotere | SD | |
| RBM26 | SNV | Missense_Mutation | novel | c.3020G>T | p.Trp1007Leu | p.W1007L | protein_coding | deleterious(0) | probably_damaging(0.954) | TCGA-AR-A0U0-01 | Breast | breast invasive carcinoma | Female | >=65 | I/II | Unknown | Unknown | SD | |
| RBM26 | SNV | Missense_Mutation | c.1663N>C | p.Asn555His | p.N555H | protein_coding | deleterious(0) | probably_damaging(1) | TCGA-D8-A1XK-01 | Breast | breast invasive carcinoma | Female | <65 | I/II | Chemotherapy | doxorubicine+cyclophosphamide | SD | ||
| RBM26 | SNV | Missense_Mutation | novel | c.2714N>C | p.Arg905Thr | p.R905T | protein_coding | deleterious(0) | possibly_damaging(0.888) | TCGA-GM-A2DO-01 | Breast | breast invasive carcinoma | Female | <65 | I/II | Hormone Therapy | tamoxiphen | CR | |
| RBM26 | SNV | Missense_Mutation | novel | c.1166N>T | p.Pro389Leu | p.P389L | protein_coding | deleterious(0.01) | probably_damaging(1) | TCGA-UU-A93S-01 | Breast | breast invasive carcinoma | Female | <65 | III/IV | Unknown | Unknown | PD | |
| RBM26 | insertion | Frame_Shift_Ins | novel | c.403_404insT | p.Tyr135LeufsTer5 | p.Y135Lfs*5 | protein_coding | TCGA-A1-A0SE-01 | Breast | breast invasive carcinoma | Female | <65 | I/II | Unknown | Unknown | SD |
| Page: 1 2 3 4 5 6 7 8 9 10 11 12 |
Top |
Related drugs of malignant transformation related genes |
| Identification of chemicals and drugs interact with genes involved in malignant transfromation |
| (DGIdb 4.0) |
| Entrez ID | Symbol | Category | Interaction Types | Drug Claim Name | Drug Name | PMIDs |
| Page: 1 |

Copyright 2023-Present -The University of Texas Health Science Center at Houston |