Schematic overview of the cellular and molecular mechanisms involved in the cancer progression, including the proposed cellular and molecular mechanisms in cancer cells trajectory. AT1: alveolar type 1 cells; AT2: alveolar type 2 cells; AAH: atypical adenomatous hyperplasia; AIS: adenocarcinoma in situ; MIA: minimally invasive adenocarcinoma; IA: invasive adenocarcinoma; EMT: epithelial-mesenchymal transition

Home

Download

Statistics

Help

Contact

Center for Computational Systems Medicine
leaf

Gene summary

leaf

Malignant transformation analysis

leaf

Malignant transformation related pathway analysis

leaf

Cell-cell communication analysis

leaf

Single-cell gene regulatory network inference analysis

leaf

Somatic mutation of malignant transformation related genes

leaf

Related drugs of malignant transformation related genes

Gene: RBM23

Gene summary for RBM23

check button Gene summary.

Gene informationSpeciesHuman
Gene symbol

RBM23

Gene ID

55147

Gene nameRNA binding motif protein 23
Gene AliasCAPERbeta
Cytomap14q11.2
Gene Typeprotein-coding
GO ID

GO:0000375

UniProtAcc

A0A0S2Z5D9


Top

Malignant transformation analysis

check button Identification of the aberrant gene expression in precancerous and cancerous lesions by comparing the gene expression of stem-like cells in diseased tissues with normal stem cells
check button Malignant transformation involving gene list.
Entrez IDSymbolReplicatesSpeciesOrganTissueAdj P-valueLog2FCMalignancy
55147RBM23HTA11_3410_2000001011HumanColorectumAD2.70e-021.26e-010.0155
55147RBM23HTA11_411_2000001011HumanColorectumSER6.36e-036.16e-01-0.2602
55147RBM23HTA11_696_2000001011HumanColorectumAD8.83e-073.48e-01-0.1464
55147RBM23HTA11_1391_2000001011HumanColorectumAD7.60e-043.59e-01-0.059
55147RBM23HTA11_99999965104_69814HumanColorectumMSS1.12e-096.10e-010.281
55147RBM23A002-C-016HumanColorectumFAP2.87e-03-8.57e-020.0521
55147RBM23LZE4THumanEsophagusESCC2.97e-246.70e-010.0811
55147RBM23LZE5THumanEsophagusESCC5.61e-052.68e-010.0514
55147RBM23LZE7THumanEsophagusESCC2.46e-032.73e-010.0667
55147RBM23LZE8THumanEsophagusESCC4.76e-092.52e-010.067
55147RBM23LZE20THumanEsophagusESCC4.65e-042.37e-010.0662
55147RBM23LZE22THumanEsophagusESCC1.50e-053.96e-010.068
55147RBM23LZE24THumanEsophagusESCC1.05e-195.14e-010.0596
55147RBM23LZE21THumanEsophagusESCC4.36e-065.62e-010.0655
55147RBM23LZE6THumanEsophagusESCC6.70e-042.45e-010.0845
55147RBM23P1T-EHumanEsophagusESCC2.95e-085.89e-010.0875
55147RBM23P2T-EHumanEsophagusESCC5.55e-569.90e-010.1177
55147RBM23P4T-EHumanEsophagusESCC2.89e-325.10e-010.1323
55147RBM23P5T-EHumanEsophagusESCC6.22e-102.05e-010.1327
55147RBM23P8T-EHumanEsophagusESCC3.01e-498.47e-010.0889
Page: 1 2 3 4 5 6 7 

check button Transcriptomic changes along malignancy continuum.
TissueExpression DynamicsAbbreviation
Colorectum (GSE201348)The image shows the transcriptomic changes along malignancy continuum.log2FC in expression of this searched gene in stem-like cells from each diseased tissue sample relative to stem-like cells in normal samples in each tissue plotted against the malignancy continuum. Samples are colored based on if they are from different disease stage.FAP: Familial adenomatous polyposis
CRC: Colorectal cancer
Colorectum (HTA11)The image shows the transcriptomic changes along malignancy continuum.log2FC in expression of this searched gene in stem-like cells from each diseased tissue sample relative to stem-like cells in normal samples in each tissue plotted against the malignancy continuum. Samples are colored based on if they are from different disease stage.AD: Adenomas
SER: Sessile serrated lesions
MSI-H: Microsatellite-high colorectal cancer
MSS: Microsatellite stable colorectal cancer
EsophagusThe image shows the transcriptomic changes along malignancy continuum.log2FC in expression of this searched gene in stem-like cells from each diseased tissue sample relative to stem-like cells in normal samples in each tissue plotted against the malignancy continuum. Samples are colored based on if they are from different disease stage.
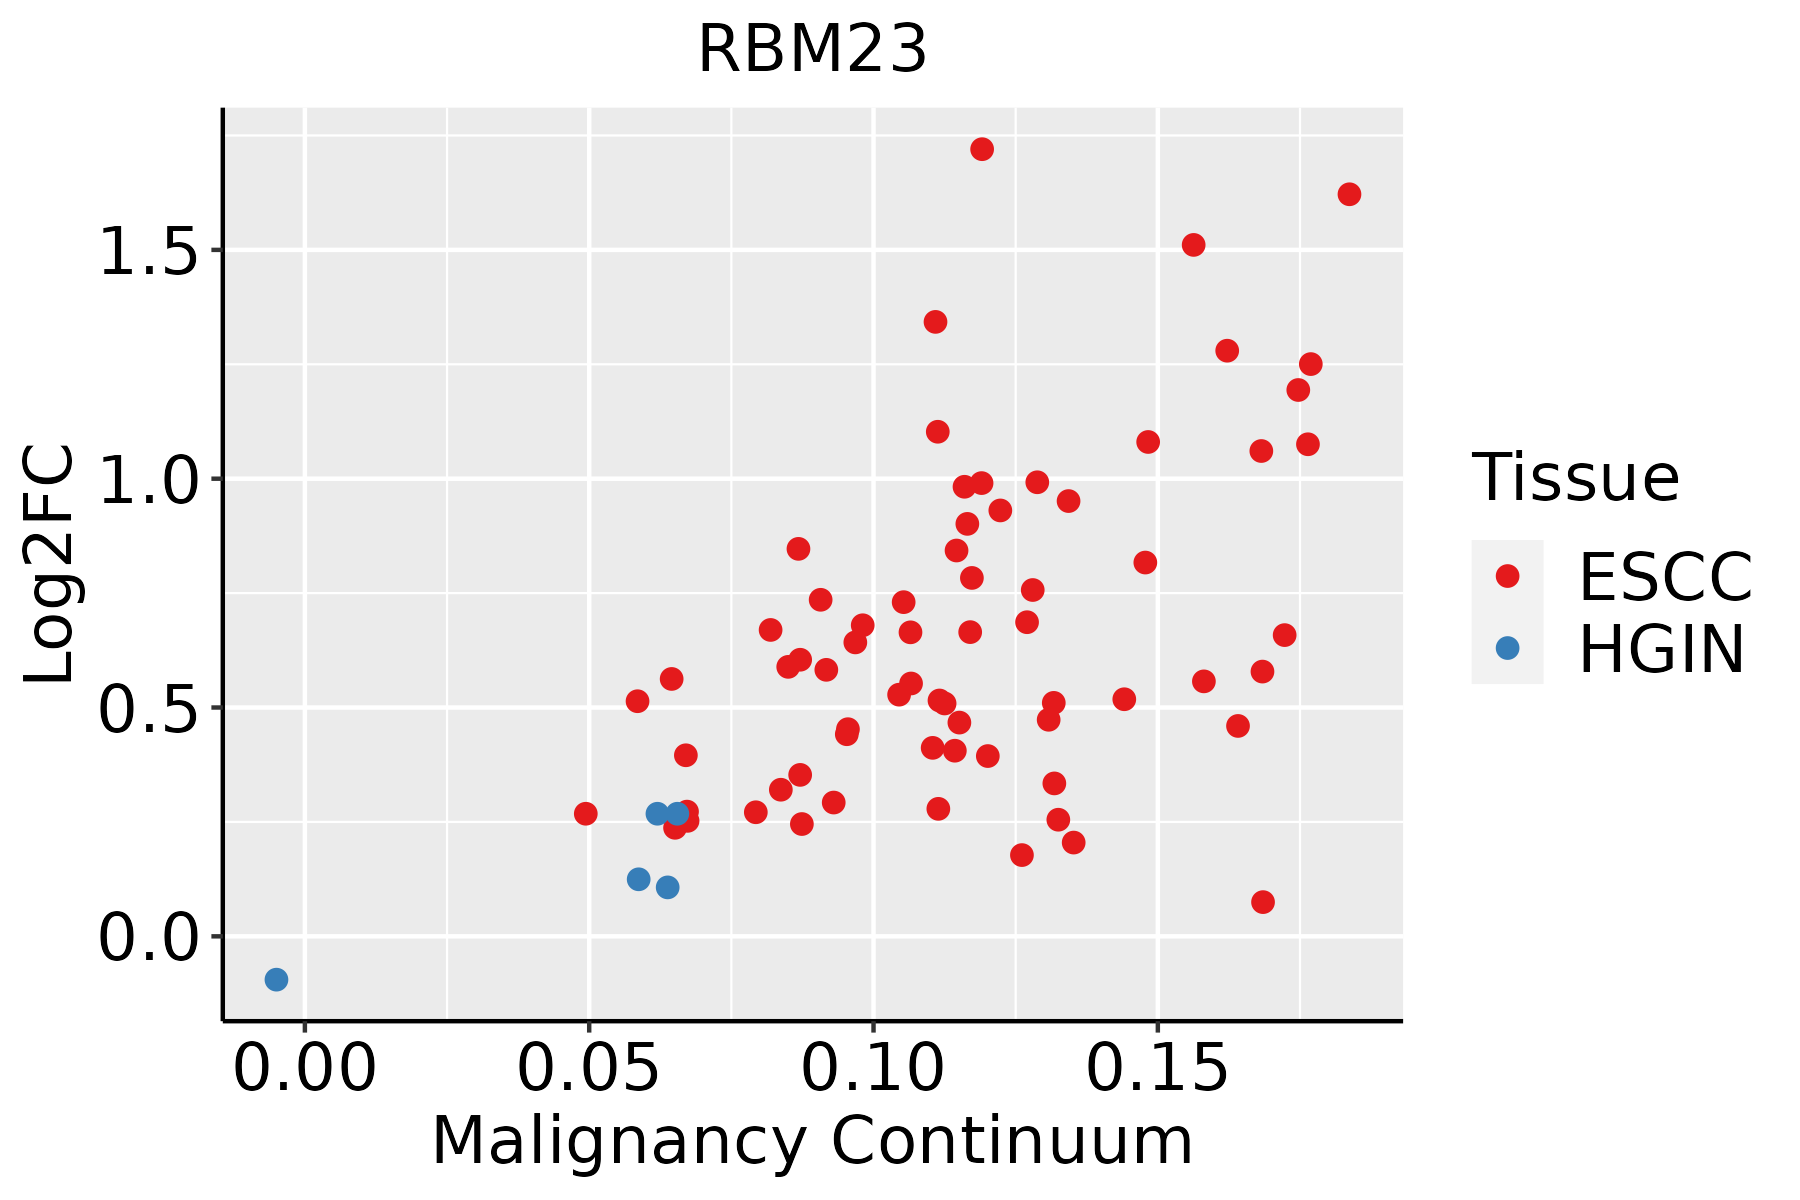
ESCC: Esophageal squamous cell carcinoma
HGIN: High-grade intraepithelial neoplasias
LGIN: Low-grade intraepithelial neoplasias
LiverThe image shows the transcriptomic changes along malignancy continuum.log2FC in expression of this searched gene in stem-like cells from each diseased tissue sample relative to stem-like cells in normal samples in each tissue plotted against the malignancy continuum. Samples are colored based on if they are from different disease stage.
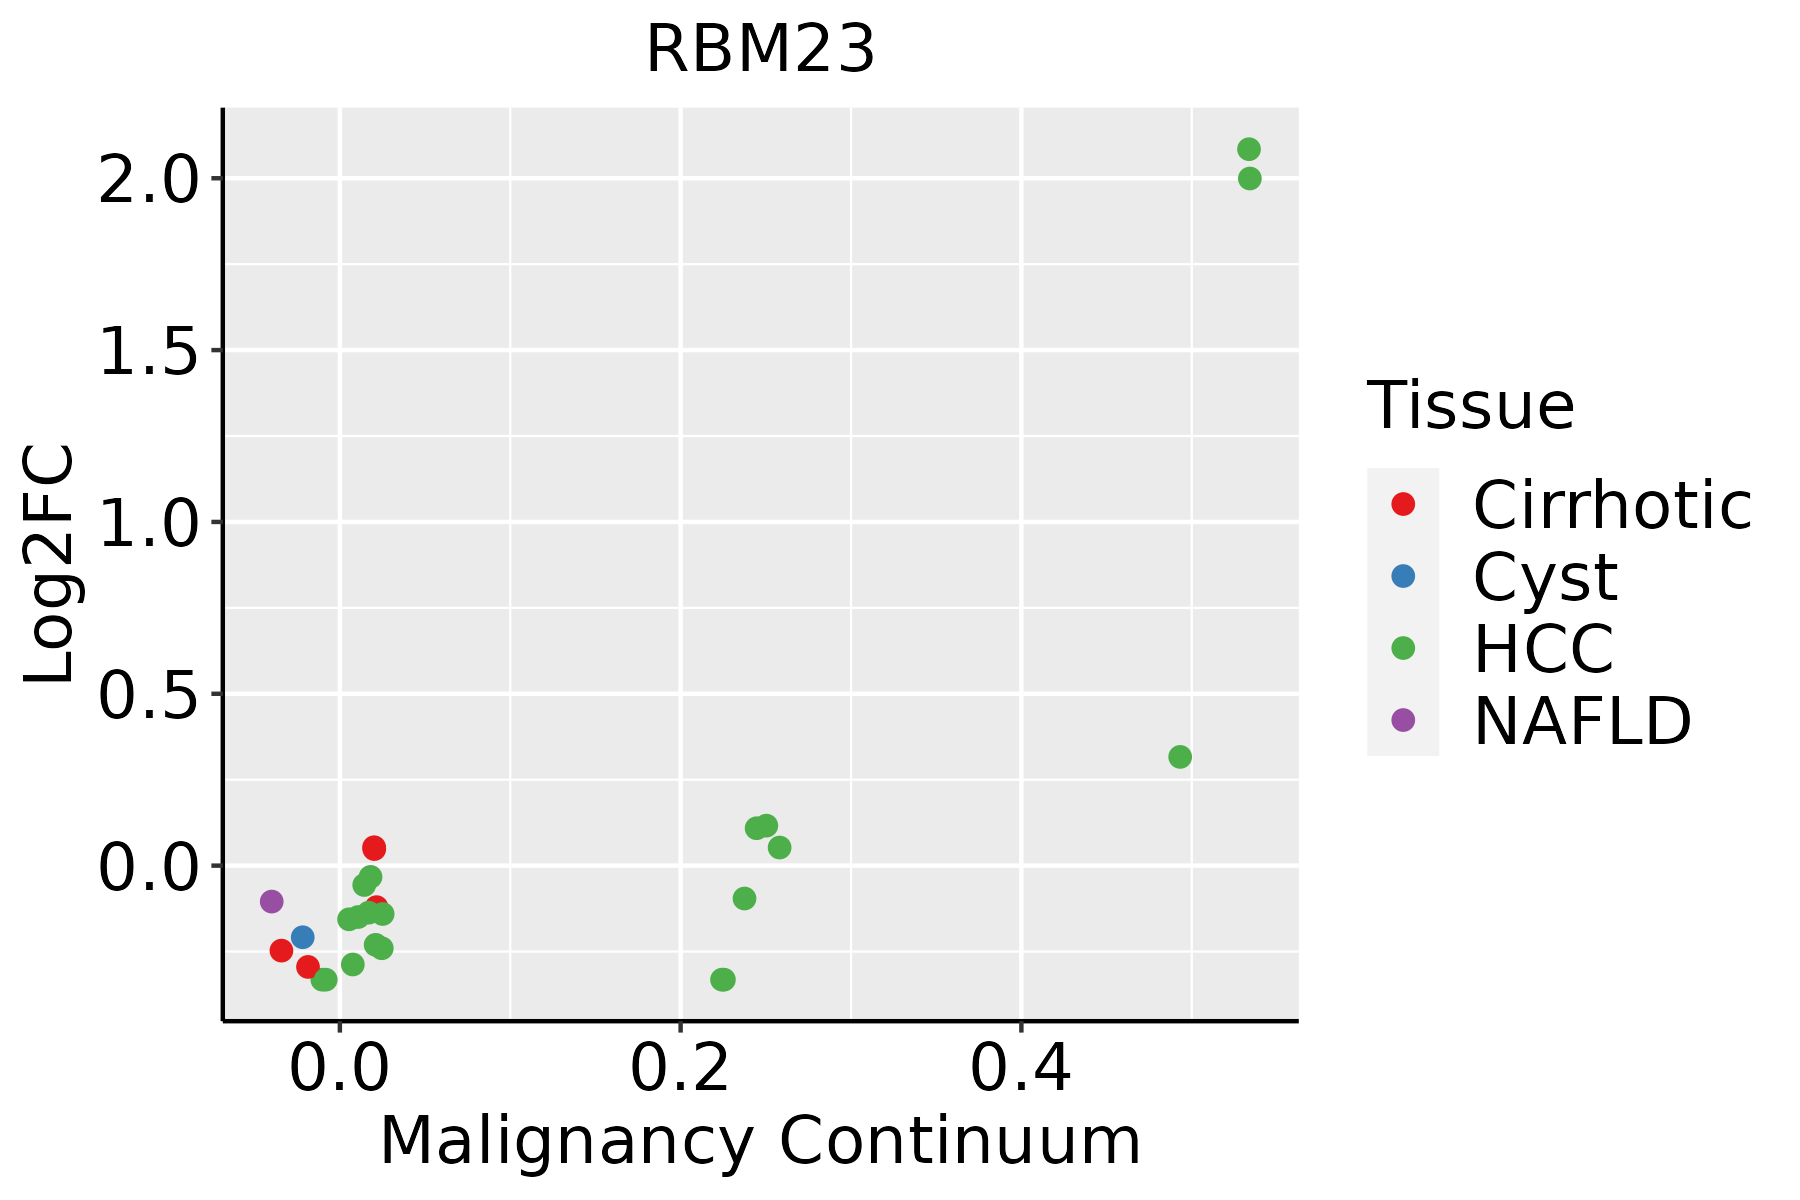
HCC: Hepatocellular carcinoma
NAFLD: Non-alcoholic fatty liver disease
Oral CavityThe image shows the transcriptomic changes along malignancy continuum.log2FC in expression of this searched gene in stem-like cells from each diseased tissue sample relative to stem-like cells in normal samples in each tissue plotted against the malignancy continuum. Samples are colored based on if they are from different disease stage.
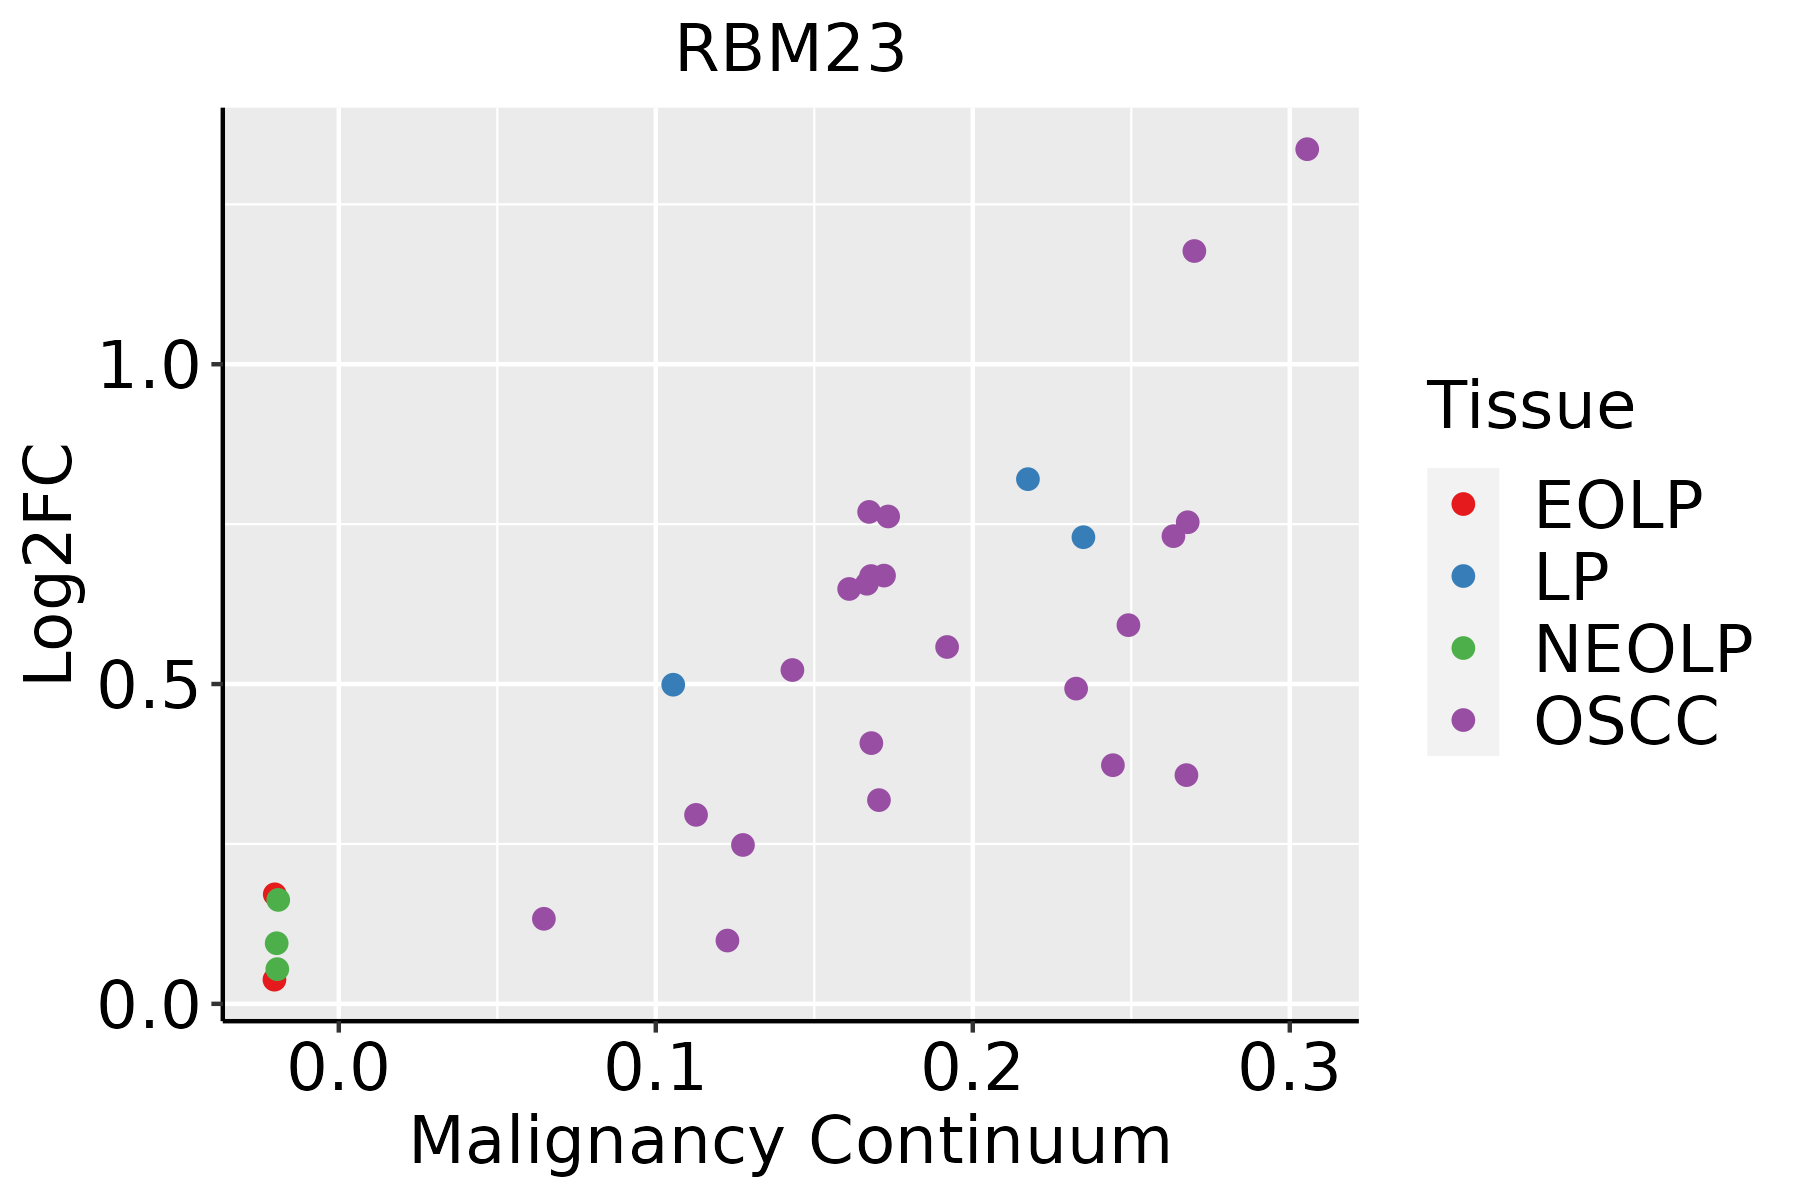
EOLP: Erosive Oral lichen planus
LP: leukoplakia
NEOLP: Non-erosive oral lichen planus
OSCC: Oral squamous cell carcinoma
SkinThe image shows the transcriptomic changes along malignancy continuum.log2FC in expression of this searched gene in stem-like cells from each diseased tissue sample relative to stem-like cells in normal samples in each tissue plotted against the malignancy continuum. Samples are colored based on if they are from different disease stage.
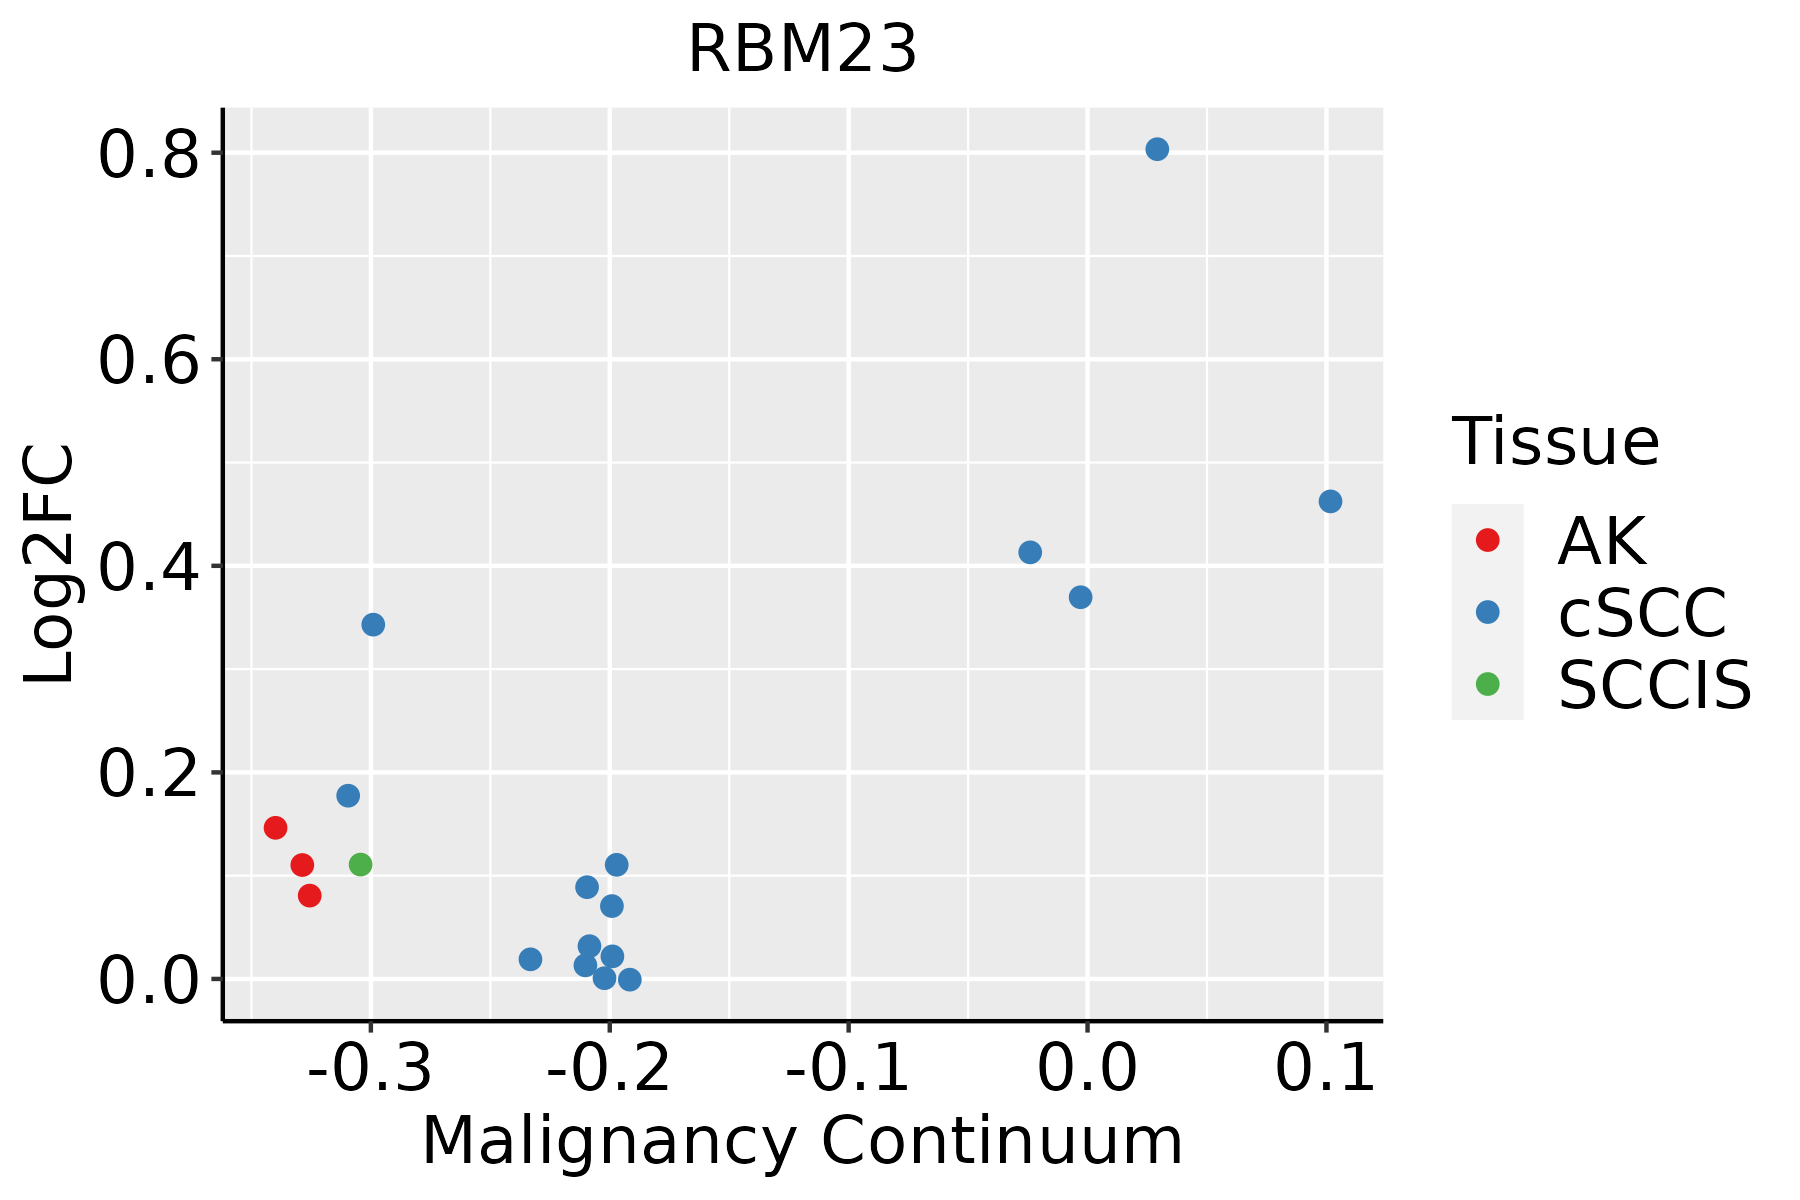
AK: Actinic keratosis
cSCC: Cutaneous squamous cell carcinoma
SCCIS:squamous cell carcinoma in situ
ThyroidThe image shows the transcriptomic changes along malignancy continuum.log2FC in expression of this searched gene in stem-like cells from each diseased tissue sample relative to stem-like cells in normal samples in each tissue plotted against the malignancy continuum. Samples are colored based on if they are from different disease stage.ATC: Anaplastic thyroid cancer
HT: Hashimoto's thyroiditis
PTC: Papillary thyroid cancer
∗log2FC in expression of this searched gene in stem-like cells from each diseased tissue sample relative to stem-like cells in normal samples in each tissue plotted against the malignancy continuum. Samples are colored based on if they are from different disease stage.

Top

Malignant transformation related pathway analysis

check buttonFind out the enriched GO biological processes and KEGG pathways involved in transition from healthy to precancer to cancer
check button Figure of enriched GO biological processes.
TissueDisease StageEnriched GO biological Processes
ColorectumADGO analysis - Figure of enriched GO biological processes: Top 15 enriched GO BP terms are showed in the bar plot of each disease state in each tissue. Each row represents a significant GO biological process which is colored according to the -log10(p.adjust).
ColorectumSERGO analysis - Figure of enriched GO biological processes: Top 15 enriched GO BP terms are showed in the bar plot of each disease state in each tissue. Each row represents a significant GO biological process which is colored according to the -log10(p.adjust).
ColorectumMSSGO analysis - Figure of enriched GO biological processes: Top 15 enriched GO BP terms are showed in the bar plot of each disease state in each tissue. Each row represents a significant GO biological process which is colored according to the -log10(p.adjust).
ColorectumMSI-HGO analysis - Figure of enriched GO biological processes: Top 15 enriched GO BP terms are showed in the bar plot of each disease state in each tissue. Each row represents a significant GO biological process which is colored according to the -log10(p.adjust).
ColorectumFAPGO analysis - Figure of enriched GO biological processes: Top 15 enriched GO BP terms are showed in the bar plot of each disease state in each tissue. Each row represents a significant GO biological process which is colored according to the -log10(p.adjust).
∗Top 15 enriched GO BP terms are showed in the bar plot of each disease state in each tissue. Each row represents a significant GO biological process which is colored according to the -log10(p.adjust).
Page: 1 2 3 4 5 6 7 8 9 

check button Enriched GO biological processes.
GO IDTissueDisease StageDescriptionGene RatioBg Ratiopvaluep.adjustCount
GO:0008380ColorectumADRNA splicing169/3918434/187233.59e-182.04e-15169
GO:0000377ColorectumADRNA splicing, via transesterification reactions with bulged adenosine as nucleophile130/3918320/187235.88e-162.16e-13130
GO:0000398ColorectumADmRNA splicing, via spliceosome130/3918320/187235.88e-162.16e-13130
GO:0000375ColorectumADRNA splicing, via transesterification reactions131/3918324/187237.11e-162.22e-13131
GO:1903311ColorectumADregulation of mRNA metabolic process117/3918288/187231.69e-144.23e-12117
GO:0043484ColorectumADregulation of RNA splicing70/3918148/187236.47e-131.16e-1070
GO:0048024ColorectumADregulation of mRNA splicing, via spliceosome50/3918101/187231.62e-101.56e-0850
GO:0050684ColorectumADregulation of mRNA processing61/3918137/187234.23e-103.58e-0861
GO:00083801ColorectumSERRNA splicing123/2897434/187233.84e-128.41e-10123
GO:00003751ColorectumSERRNA splicing, via transesterification reactions90/2897324/187238.68e-097.50e-0790
GO:00003771ColorectumSERRNA splicing, via transesterification reactions with bulged adenosine as nucleophile89/2897320/187239.82e-098.14e-0789
GO:00003981ColorectumSERmRNA splicing, via spliceosome89/2897320/187239.82e-098.14e-0789
GO:00434841ColorectumSERregulation of RNA splicing49/2897148/187237.02e-084.49e-0649
GO:19033111ColorectumSERregulation of mRNA metabolic process78/2897288/187232.61e-071.43e-0578
GO:00480241ColorectumSERregulation of mRNA splicing, via spliceosome35/2897101/187231.52e-066.85e-0535
GO:00506841ColorectumSERregulation of mRNA processing42/2897137/187235.57e-062.01e-0442
GO:00083802ColorectumMSSRNA splicing159/3467434/187231.75e-191.22e-16159
GO:19033112ColorectumMSSregulation of mRNA metabolic process115/3467288/187231.23e-176.41e-15115
GO:00003772ColorectumMSSRNA splicing, via transesterification reactions with bulged adenosine as nucleophile121/3467320/187232.52e-168.27e-14121
GO:00003982ColorectumMSSmRNA splicing, via spliceosome121/3467320/187232.52e-168.27e-14121
Page: 1 2 3 4 5 

check button Enriched KEGG pathways.
Pathway IDTissueDisease StageDescriptionGene RatioBg Ratiopvaluep.adjustqvalueCount
Page: 1 

Top

Cell-cell communication analysis

check buttonIdentification of potential cell-cell interactions between two cell types and their ligand-receptor pairs for different disease states
LigandReceptorLRpairPathwayTissueDisease Stage
Page: 1 

Top

Single-cell gene regulatory network inference analysis

check buttonFind out the significant the regulons (TFs) and the target genes of each regulon across cell types for different disease states
TFCell TypeTissueDisease StageTarget GeneRSSRegulon Activity
∗The dot plots of a searched regulon are shown for all cell subpopulations in each disease state of each tissue based on the regulon specific score inferred using pySCENIC and by calculating the average expression.
Page: 1 

Top

Somatic mutation of malignant transformation related genes

check buttonAnnotation of somatic variants for genes involved in malignant transformation
Hugo SymbolVariant ClassVariant ClassificationdbSNP RSHGVScHGVSpHGVSp ShortSWISSPROTBIOTYPESIFTPolyPhenTumor Sample BarcodeTissueHistologySexAgeStageTherapy TypesDrugsOutcome
RBM23deletionFrame_Shift_Delnovelc.1237delNp.Ala413LeufsTer2p.A413Lfs*2Q86U06protein_codingTCGA-D8-A27V-01Breastbreast invasive carcinomaFemale<65I/IIHormone TherapytamoxiphenSD
RBM23SNVMissense_Mutationnovelc.1249N>Gp.Leu417Valp.L417VQ86U06protein_codingtolerated(0.26)benign(0.074)TCGA-C5-A1MH-01Cervixcervical & endocervical cancerFemale>=65III/IVChemotherapycisplatinPD
RBM23SNVMissense_Mutationnovelc.874N>Gp.Ile292Valp.I292VQ86U06protein_codingtolerated(0.13)benign(0.124)TCGA-F5-6814-01Colorectumrectum adenocarcinomaMale<65I/IIUnknownUnknownSD
RBM23SNVMissense_Mutationnovelc.425N>Ap.Ser142Asnp.S142NQ86U06protein_codingtolerated(0.06)benign(0.444)TCGA-F5-6814-01Colorectumrectum adenocarcinomaMale<65I/IIUnknownUnknownSD
RBM23SNVMissense_Mutationnovelc.56N>Cp.Lys19Thrp.K19TQ86U06protein_codingdeleterious_low_confidence(0)possibly_damaging(0.702)TCGA-F5-6814-01Colorectumrectum adenocarcinomaMale<65I/IIUnknownUnknownSD
RBM23SNVMissense_Mutationnovelc.1232C>Ap.Pro411Glnp.P411QQ86U06protein_codingtolerated(0.06)benign(0.308)TCGA-A5-A0G2-01Endometriumuterine corpus endometrioid carcinomaFemale<65III/IVUnknownUnknownSD
RBM23SNVMissense_Mutationnovelc.407G>Tp.Arg136Metp.R136MQ86U06protein_codingdeleterious(0.01)benign(0.007)TCGA-A5-A1OF-01Endometriumuterine corpus endometrioid carcinomaFemale<65I/IIUnknownUnknownSD
RBM23SNVMissense_Mutationrs373264361c.269G>Ap.Arg90Glnp.R90QQ86U06protein_codingtolerated(0.23)benign(0)TCGA-A5-A1OF-01Endometriumuterine corpus endometrioid carcinomaFemale<65I/IIUnknownUnknownSD
RBM23SNVMissense_Mutationc.727N>Tp.Ala243Serp.A243SQ86U06protein_codingtolerated(0.06)possibly_damaging(0.673)TCGA-AP-A059-01Endometriumuterine corpus endometrioid carcinomaFemale>=65I/IIUnknownUnknownSD
RBM23SNVMissense_Mutationc.101N>Tp.Tyr34Phep.Y34FQ86U06protein_codingtolerated_low_confidence(0.11)benign(0.011)TCGA-AP-A059-01Endometriumuterine corpus endometrioid carcinomaFemale>=65I/IIUnknownUnknownSD
Page: 1 2 3 4 

Top

Related drugs of malignant transformation related genes

check buttonIdentification of chemicals and drugs interact with genes involved in malignant transfromation
(DGIdb 4.0)
Entrez IDSymbolCategoryInteraction TypesDrug Claim NameDrug NamePMIDs
Page: 1