
|
|||||
|
 | |
| |
| |
| |
| |
| |
|
Gene: RBM22 |
Gene summary for RBM22 |
| Gene information | Species | Human | Gene symbol | RBM22 | Gene ID | 55696 |
| Gene name | RNA binding motif protein 22 | |
| Gene Alias | Cwc2 | |
| Cytomap | 5q33.1 | |
| Gene Type | protein-coding | GO ID | GO:0000375 | UniProtAcc | Q9NW64 |
Top |
Malignant transformation analysis |
| Identification of the aberrant gene expression in precancerous and cancerous lesions by comparing the gene expression of stem-like cells in diseased tissues with normal stem cells |
| Entrez ID | Symbol | Replicates | Species | Organ | Tissue | Adj P-value | Log2FC | Malignancy |
| 55696 | RBM22 | LZE4T | Human | Esophagus | ESCC | 5.23e-08 | 3.59e-01 | 0.0811 |
| 55696 | RBM22 | LZE7T | Human | Esophagus | ESCC | 4.20e-11 | 2.52e-01 | 0.0667 |
| 55696 | RBM22 | LZE8T | Human | Esophagus | ESCC | 1.07e-05 | 3.17e-01 | 0.067 |
| 55696 | RBM22 | LZE20T | Human | Esophagus | ESCC | 3.35e-08 | 7.67e-02 | 0.0662 |
| 55696 | RBM22 | LZE24T | Human | Esophagus | ESCC | 5.17e-16 | 3.43e-01 | 0.0596 |
| 55696 | RBM22 | P1T-E | Human | Esophagus | ESCC | 7.04e-05 | 3.16e-01 | 0.0875 |
| 55696 | RBM22 | P2T-E | Human | Esophagus | ESCC | 1.34e-45 | 8.73e-01 | 0.1177 |
| 55696 | RBM22 | P4T-E | Human | Esophagus | ESCC | 2.72e-12 | 3.65e-01 | 0.1323 |
| 55696 | RBM22 | P5T-E | Human | Esophagus | ESCC | 1.14e-22 | 4.13e-01 | 0.1327 |
| 55696 | RBM22 | P8T-E | Human | Esophagus | ESCC | 1.64e-16 | 3.41e-01 | 0.0889 |
| 55696 | RBM22 | P9T-E | Human | Esophagus | ESCC | 4.79e-14 | 2.10e-01 | 0.1131 |
| 55696 | RBM22 | P10T-E | Human | Esophagus | ESCC | 3.14e-16 | 2.68e-01 | 0.116 |
| 55696 | RBM22 | P11T-E | Human | Esophagus | ESCC | 7.18e-17 | 9.84e-01 | 0.1426 |
| 55696 | RBM22 | P12T-E | Human | Esophagus | ESCC | 6.82e-24 | 5.95e-01 | 0.1122 |
| 55696 | RBM22 | P15T-E | Human | Esophagus | ESCC | 2.08e-26 | 6.23e-01 | 0.1149 |
| 55696 | RBM22 | P16T-E | Human | Esophagus | ESCC | 8.68e-23 | 4.36e-01 | 0.1153 |
| 55696 | RBM22 | P17T-E | Human | Esophagus | ESCC | 5.19e-12 | 4.94e-01 | 0.1278 |
| 55696 | RBM22 | P19T-E | Human | Esophagus | ESCC | 1.12e-07 | 4.09e-01 | 0.1662 |
| 55696 | RBM22 | P20T-E | Human | Esophagus | ESCC | 6.58e-07 | 1.95e-01 | 0.1124 |
| 55696 | RBM22 | P21T-E | Human | Esophagus | ESCC | 2.84e-18 | 3.57e-01 | 0.1617 |
| Page: 1 2 3 4 5 6 |
| Tissue | Expression Dynamics | Abbreviation |
| Esophagus | 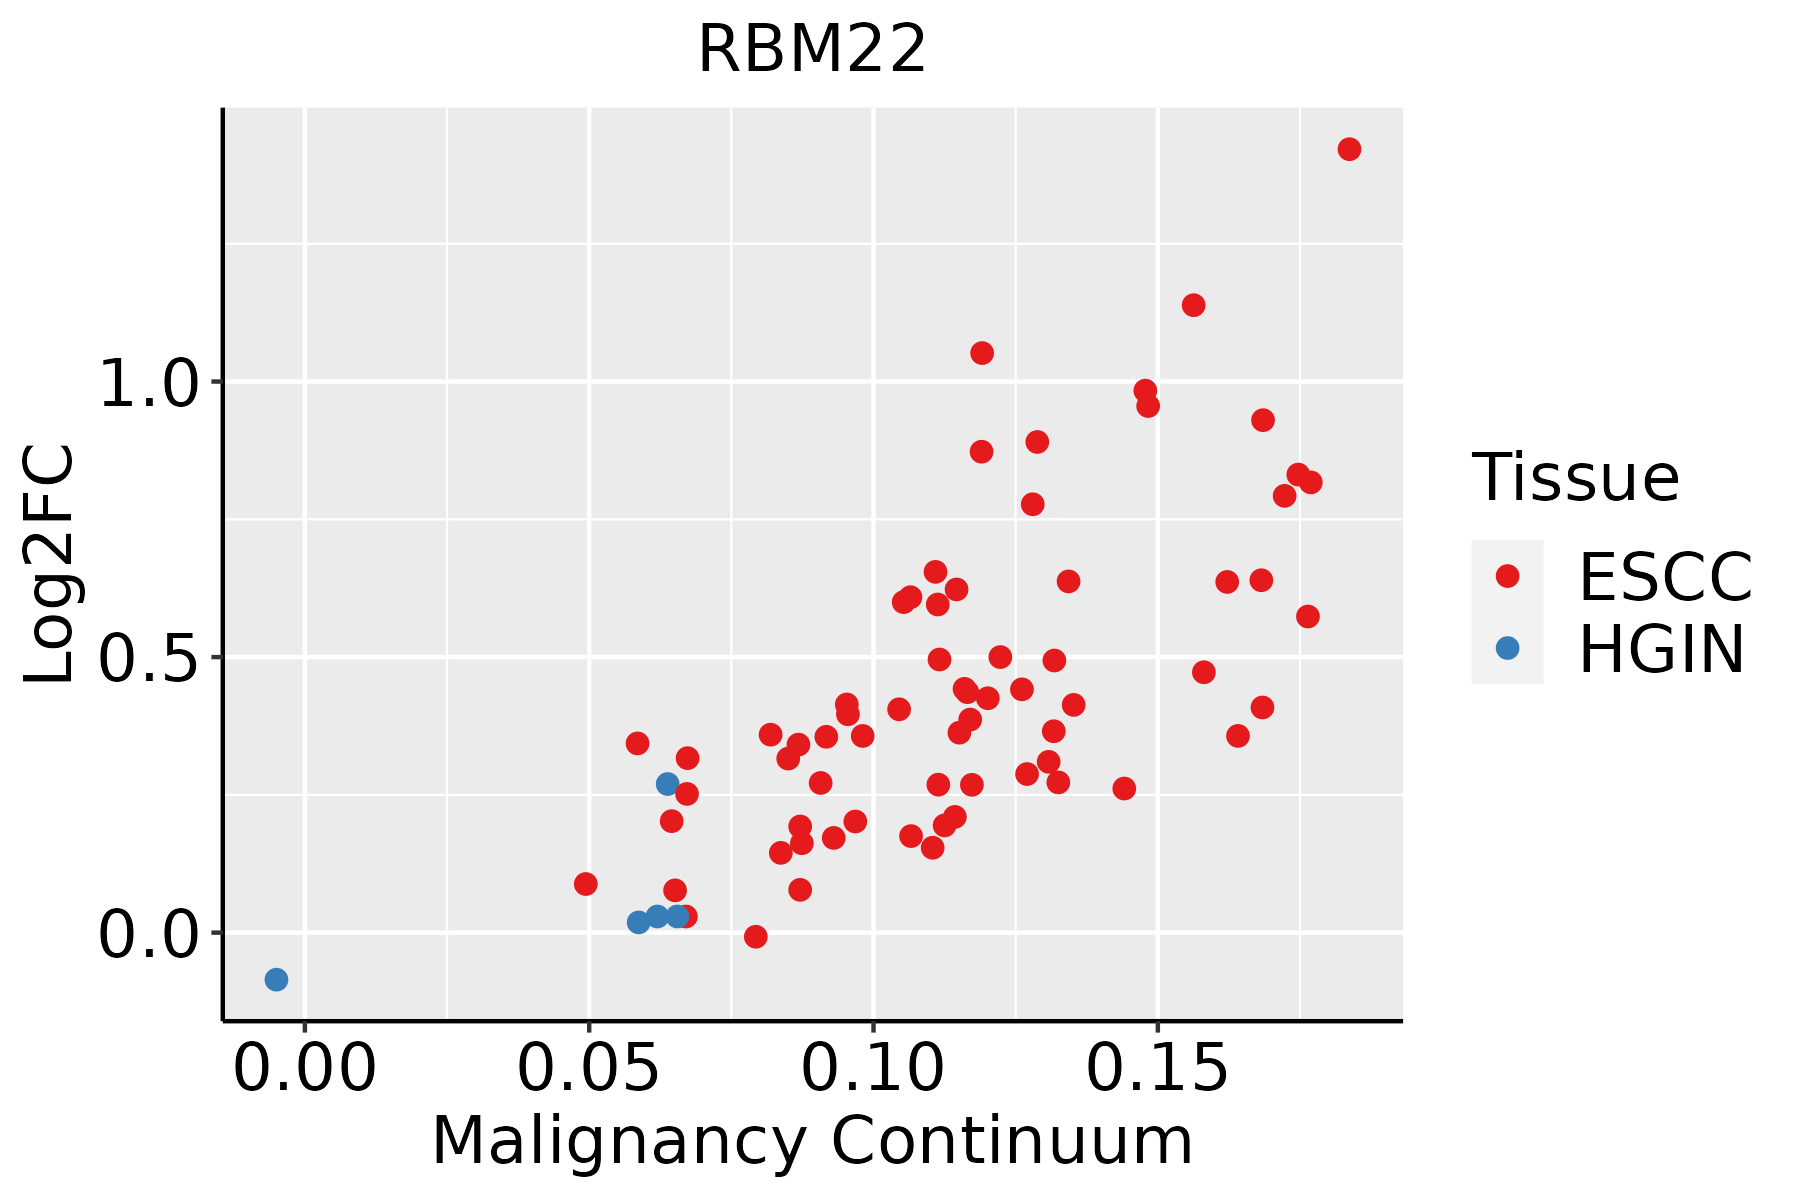 | ESCC: Esophageal squamous cell carcinoma |
| HGIN: High-grade intraepithelial neoplasias | ||
| LGIN: Low-grade intraepithelial neoplasias | ||
| Liver |  | HCC: Hepatocellular carcinoma |
| NAFLD: Non-alcoholic fatty liver disease | ||
| Oral Cavity | 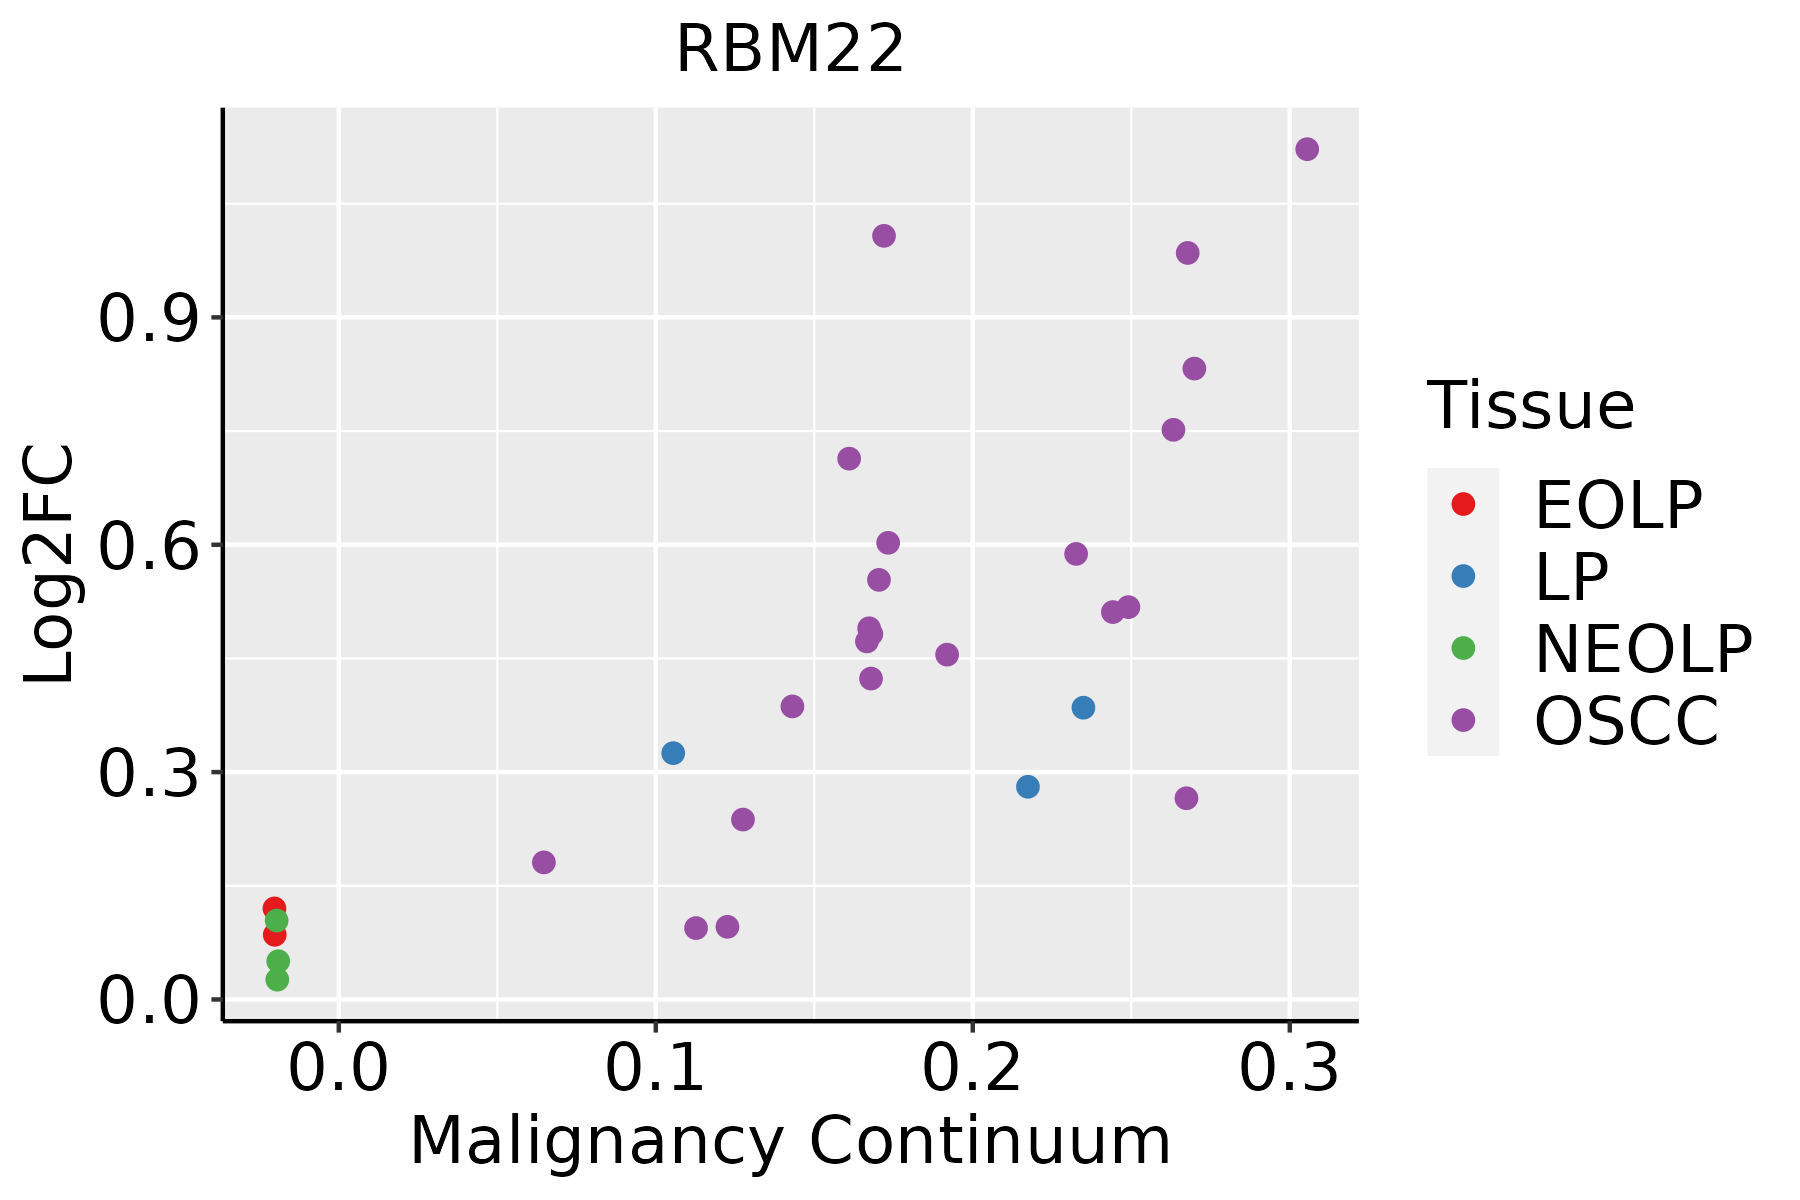 | EOLP: Erosive Oral lichen planus |
| LP: leukoplakia | ||
| NEOLP: Non-erosive oral lichen planus | ||
| OSCC: Oral squamous cell carcinoma | ||
| Skin | 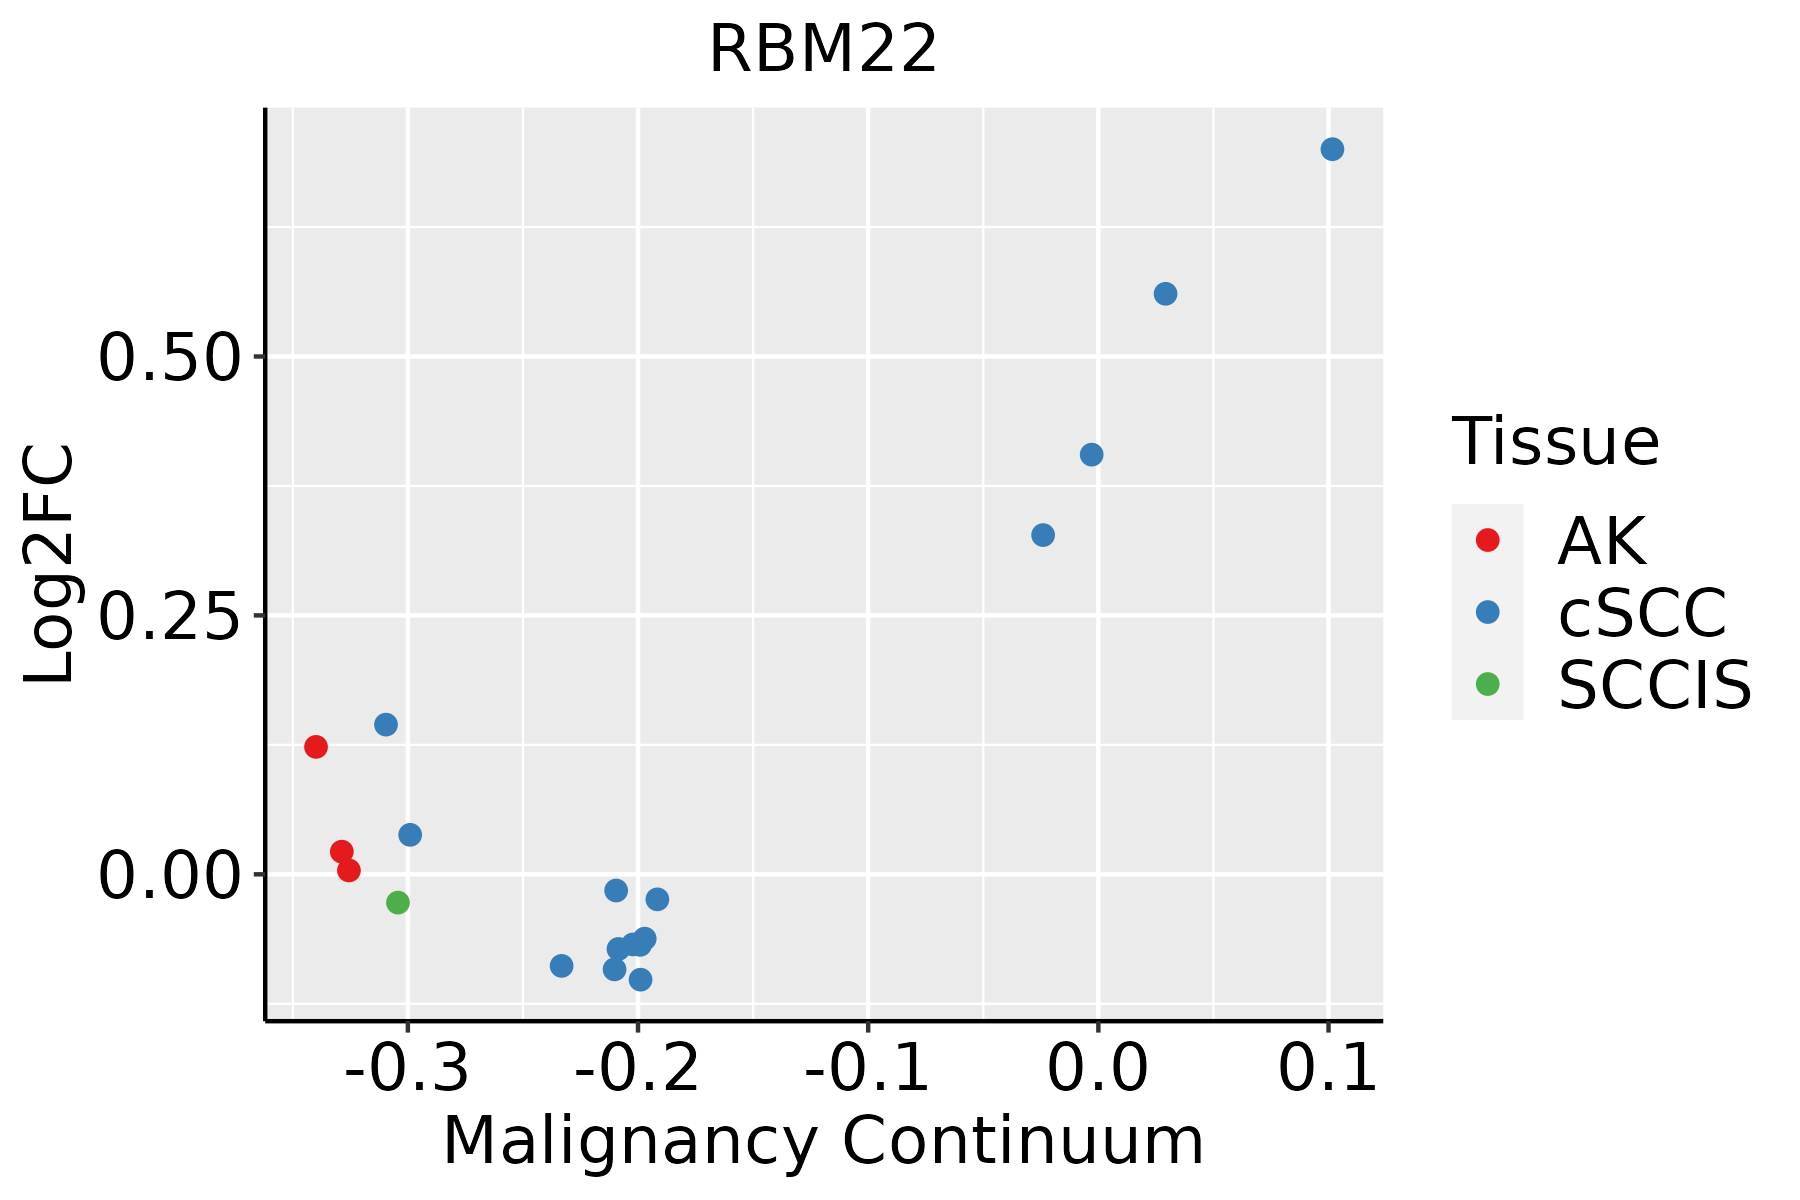 | AK: Actinic keratosis |
| cSCC: Cutaneous squamous cell carcinoma | ||
| SCCIS:squamous cell carcinoma in situ | ||
| Thyroid | 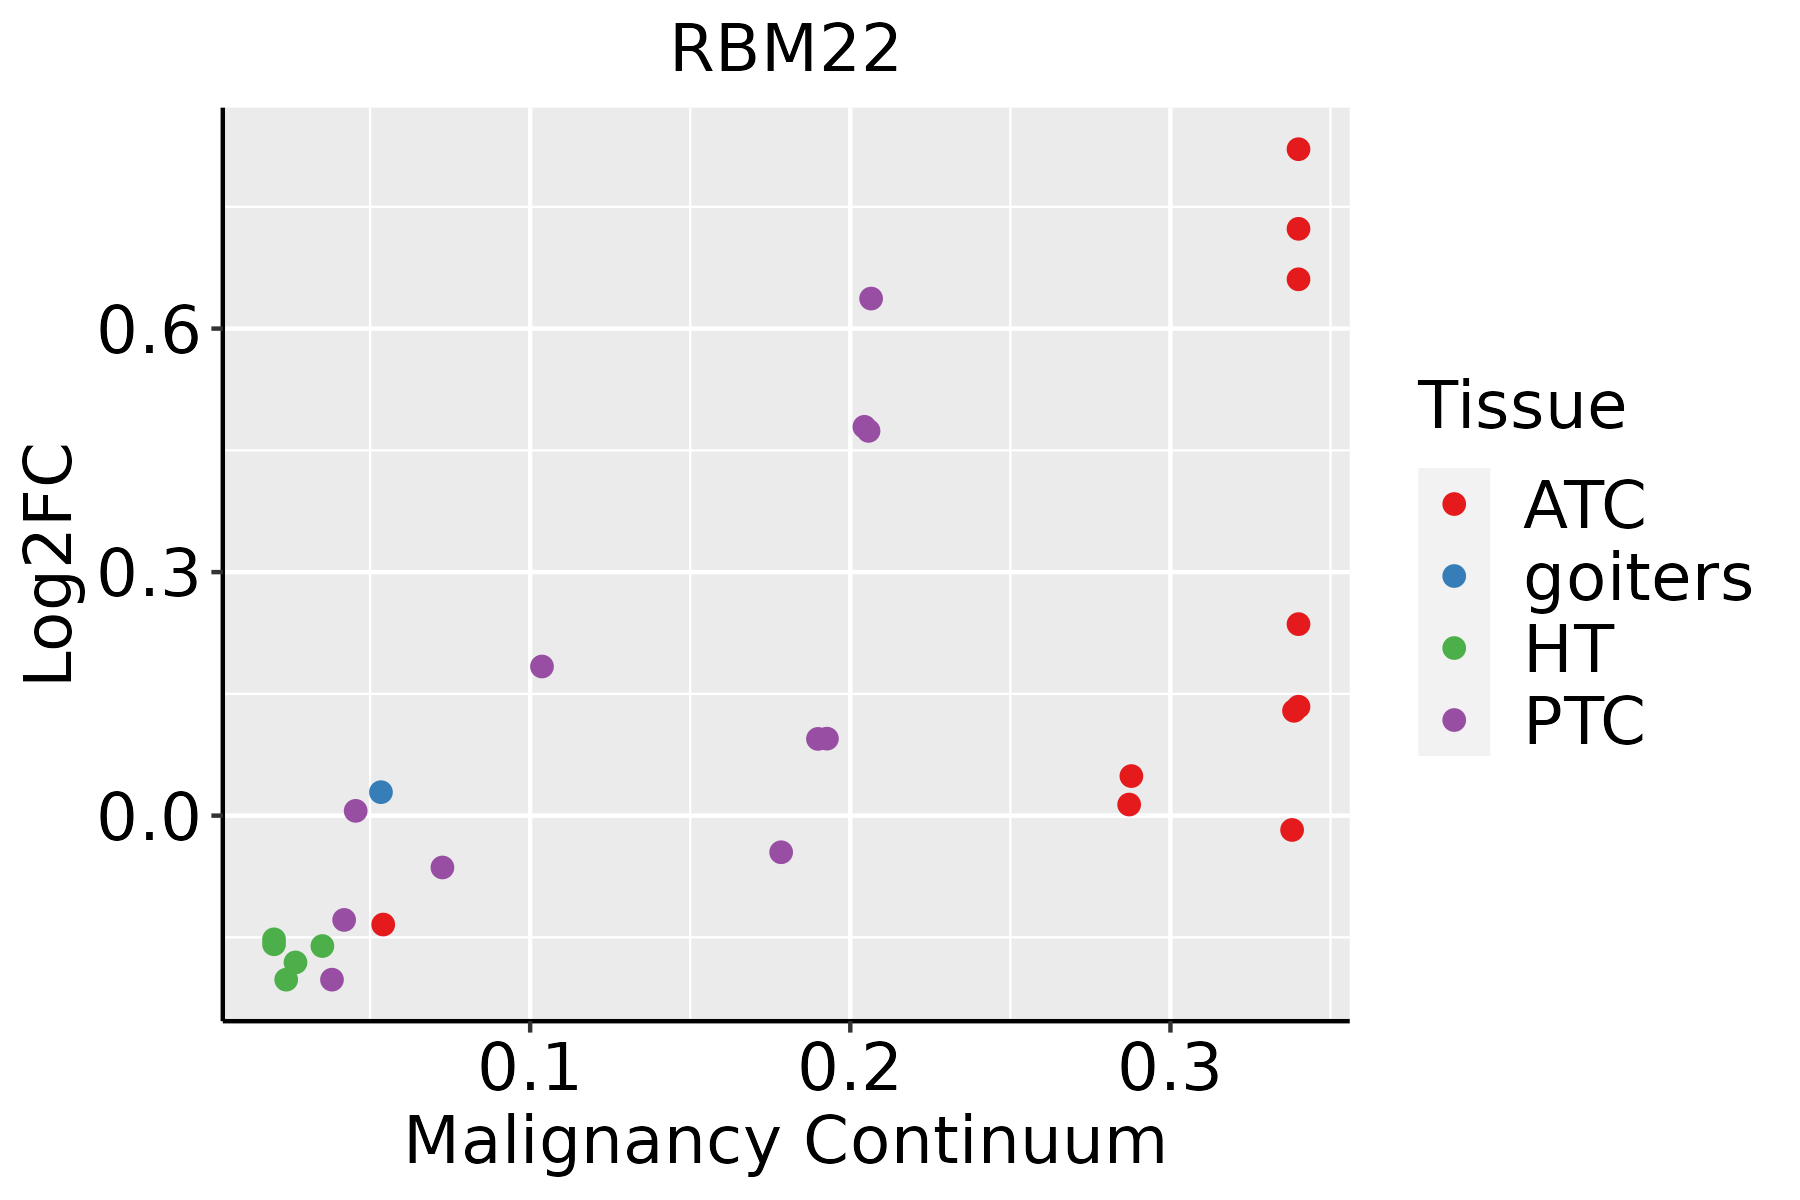 | ATC: Anaplastic thyroid cancer |
| HT: Hashimoto's thyroiditis | ||
| PTC: Papillary thyroid cancer |
| ∗log2FC in expression of this searched gene in stem-like cells from each diseased tissue sample relative to stem-like cells in normal samples in each tissue plotted against the malignancy continuum. Samples are colored based on if they are from different disease stage. |
Top |
Malignant transformation related pathway analysis |
| Find out the enriched GO biological processes and KEGG pathways involved in transition from healthy to precancer to cancer |
| Tissue | Disease Stage | Enriched GO biological Processes |
| Colorectum | AD |  |
| Colorectum | SER |  |
| Colorectum | MSS |  |
| Colorectum | MSI-H |  |
| Colorectum | FAP |  |
| ∗Top 15 enriched GO BP terms are showed in the bar plot of each disease state in each tissue. Each row represents a significant GO biological process which is colored according to the -log10(p.adjust). |
| Page: 1 2 3 4 5 6 7 8 9 |
| GO ID | Tissue | Disease Stage | Description | Gene Ratio | Bg Ratio | pvalue | p.adjust | Count |
| GO:0008380111 | Esophagus | ESCC | RNA splicing | 336/8552 | 434/18723 | 1.74e-42 | 3.67e-39 | 336 |
| GO:0072594110 | Esophagus | ESCC | establishment of protein localization to organelle | 311/8552 | 422/18723 | 3.02e-32 | 2.13e-29 | 311 |
| GO:0000375111 | Esophagus | ESCC | RNA splicing, via transesterification reactions | 248/8552 | 324/18723 | 3.05e-30 | 1.49e-27 | 248 |
| GO:0000377111 | Esophagus | ESCC | RNA splicing, via transesterification reactions with bulged adenosine as nucleophile | 244/8552 | 320/18723 | 2.52e-29 | 1.07e-26 | 244 |
| GO:0000398111 | Esophagus | ESCC | mRNA splicing, via spliceosome | 244/8552 | 320/18723 | 2.52e-29 | 1.07e-26 | 244 |
| GO:0006913110 | Esophagus | ESCC | nucleocytoplasmic transport | 230/8552 | 301/18723 | 6.04e-28 | 2.02e-25 | 230 |
| GO:0051169110 | Esophagus | ESCC | nuclear transport | 230/8552 | 301/18723 | 6.04e-28 | 2.02e-25 | 230 |
| GO:003238618 | Esophagus | ESCC | regulation of intracellular transport | 243/8552 | 337/18723 | 3.20e-23 | 7.25e-21 | 243 |
| GO:003450418 | Esophagus | ESCC | protein localization to nucleus | 211/8552 | 290/18723 | 4.06e-21 | 6.60e-19 | 211 |
| GO:0051168110 | Esophagus | ESCC | nuclear export | 126/8552 | 154/18723 | 1.88e-20 | 2.65e-18 | 126 |
| GO:1903829111 | Esophagus | ESCC | positive regulation of cellular protein localization | 199/8552 | 276/18723 | 2.99e-19 | 3.45e-17 | 199 |
| GO:0033157110 | Esophagus | ESCC | regulation of intracellular protein transport | 169/8552 | 229/18723 | 3.31e-18 | 3.23e-16 | 169 |
| GO:0032388110 | Esophagus | ESCC | positive regulation of intracellular transport | 152/8552 | 202/18723 | 7.89e-18 | 7.36e-16 | 152 |
| GO:0043484111 | Esophagus | ESCC | regulation of RNA splicing | 116/8552 | 148/18723 | 3.18e-16 | 2.38e-14 | 116 |
| GO:1904951111 | Esophagus | ESCC | positive regulation of establishment of protein localization | 216/8552 | 319/18723 | 1.01e-15 | 6.86e-14 | 216 |
| GO:0046822110 | Esophagus | ESCC | regulation of nucleocytoplasmic transport | 88/8552 | 106/18723 | 1.88e-15 | 1.19e-13 | 88 |
| GO:009031617 | Esophagus | ESCC | positive regulation of intracellular protein transport | 122/8552 | 160/18723 | 2.45e-15 | 1.49e-13 | 122 |
| GO:001703818 | Esophagus | ESCC | protein import | 149/8552 | 206/18723 | 5.90e-15 | 3.31e-13 | 149 |
| GO:0051222111 | Esophagus | ESCC | positive regulation of protein transport | 204/8552 | 303/18723 | 1.56e-14 | 8.38e-13 | 204 |
| GO:190018018 | Esophagus | ESCC | regulation of protein localization to nucleus | 102/8552 | 136/18723 | 2.84e-12 | 1.13e-10 | 102 |
| Page: 1 2 3 4 5 6 7 8 9 10 11 12 13 14 |
| Pathway ID | Tissue | Disease Stage | Description | Gene Ratio | Bg Ratio | pvalue | p.adjust | qvalue | Count |
| hsa0304027 | Esophagus | ESCC | Spliceosome | 128/4205 | 217/8465 | 3.31e-03 | 8.79e-03 | 4.50e-03 | 128 |
| hsa0304037 | Esophagus | ESCC | Spliceosome | 128/4205 | 217/8465 | 3.31e-03 | 8.79e-03 | 4.50e-03 | 128 |
| hsa030407 | Liver | Cirrhotic | Spliceosome | 102/2530 | 217/8465 | 5.69e-08 | 9.47e-07 | 5.84e-07 | 102 |
| hsa0304012 | Liver | Cirrhotic | Spliceosome | 102/2530 | 217/8465 | 5.69e-08 | 9.47e-07 | 5.84e-07 | 102 |
| hsa0304022 | Liver | HCC | Spliceosome | 122/4020 | 217/8465 | 5.55e-03 | 1.60e-02 | 8.91e-03 | 122 |
| hsa0304032 | Liver | HCC | Spliceosome | 122/4020 | 217/8465 | 5.55e-03 | 1.60e-02 | 8.91e-03 | 122 |
| hsa0304016 | Oral cavity | OSCC | Spliceosome | 123/3704 | 217/8465 | 7.21e-05 | 2.74e-04 | 1.40e-04 | 123 |
| hsa0304017 | Oral cavity | OSCC | Spliceosome | 123/3704 | 217/8465 | 7.21e-05 | 2.74e-04 | 1.40e-04 | 123 |
| Page: 1 |
Top |
Cell-cell communication analysis |
| Identification of potential cell-cell interactions between two cell types and their ligand-receptor pairs for different disease states |
| Ligand | Receptor | LRpair | Pathway | Tissue | Disease Stage |
| Page: 1 |
Top |
Single-cell gene regulatory network inference analysis |
| Find out the significant the regulons (TFs) and the target genes of each regulon across cell types for different disease states |
| TF | Cell Type | Tissue | Disease Stage | Target Gene | RSS | Regulon Activity |
| ∗The dot plots of a searched regulon are shown for all cell subpopulations in each disease state of each tissue based on the regulon specific score inferred using pySCENIC and by calculating the average expression. |
| Page: 1 |
Top |
Somatic mutation of malignant transformation related genes |
| Annotation of somatic variants for genes involved in malignant transformation |
| Hugo Symbol | Variant Class | Variant Classification | dbSNP RS | HGVSc | HGVSp | HGVSp Short | SWISSPROT | BIOTYPE | SIFT | PolyPhen | Tumor Sample Barcode | Tissue | Histology | Sex | Age | Stage | Therapy Types | Drugs | Outcome |
| RBM22 | SNV | Missense_Mutation | c.616A>G | p.Asn206Asp | p.N206D | Q9NW64 | protein_coding | deleterious(0.04) | benign(0.038) | TCGA-D8-A1XK-01 | Breast | breast invasive carcinoma | Female | <65 | I/II | Chemotherapy | doxorubicine+cyclophosphamide | SD | |
| RBM22 | insertion | Nonsense_Mutation | novel | c.384_385insTGGTATTAGGTCTATTTTGGTAATTATATTTTG | p.Ser128_Asp129insTrpTyrTerValTyrPheGlyAsnTyrIleLeu | p.S128_D129insWY*VYFGNYIL | Q9NW64 | protein_coding | TCGA-A8-A097-01 | Breast | breast invasive carcinoma | Female | >=65 | I/II | Hormone Therapy | tamoxiphen | SD | ||
| RBM22 | insertion | Frame_Shift_Ins | novel | c.369_370insTTTCATAGTTCTAAGACAT | p.Glu124PhefsTer7 | p.E124Ffs*7 | Q9NW64 | protein_coding | TCGA-AR-A0U0-01 | Breast | breast invasive carcinoma | Female | >=65 | I/II | Unknown | Unknown | SD | ||
| RBM22 | deletion | Frame_Shift_Del | novel | c.696delN | p.Thr233HisfsTer7 | p.T233Hfs*7 | Q9NW64 | protein_coding | TCGA-D8-A27V-01 | Breast | breast invasive carcinoma | Female | <65 | I/II | Hormone Therapy | tamoxiphen | SD | ||
| RBM22 | SNV | Missense_Mutation | novel | c.836C>T | p.Ala279Val | p.A279V | Q9NW64 | protein_coding | deleterious(0.02) | possibly_damaging(0.734) | TCGA-2W-A8YY-01 | Cervix | cervical & endocervical cancer | Female | <65 | I/II | Chemotherapy | cisplatin | CR |
| RBM22 | SNV | Missense_Mutation | rs755478465 | c.191N>A | p.Arg64His | p.R64H | Q9NW64 | protein_coding | tolerated(0.11) | probably_damaging(0.999) | TCGA-A6-5665-01 | Colorectum | colon adenocarcinoma | Female | >=65 | I/II | Unknown | Unknown | PD |
| RBM22 | SNV | Missense_Mutation | c.959A>G | p.Asp320Gly | p.D320G | Q9NW64 | protein_coding | tolerated(0.17) | benign(0.031) | TCGA-AA-3492-01 | Colorectum | colon adenocarcinoma | Female | >=65 | I/II | Unknown | Unknown | SD | |
| RBM22 | SNV | Missense_Mutation | c.602N>A | p.Arg201His | p.R201H | Q9NW64 | protein_coding | deleterious(0) | probably_damaging(0.999) | TCGA-AA-3811-01 | Colorectum | colon adenocarcinoma | Female | >=65 | III/IV | Unknown | Unknown | PD | |
| RBM22 | SNV | Missense_Mutation | c.125G>T | p.Gly42Val | p.G42V | Q9NW64 | protein_coding | deleterious(0) | probably_damaging(0.998) | TCGA-AD-6895-01 | Colorectum | colon adenocarcinoma | Male | >=65 | III/IV | Unknown | Unknown | SD | |
| RBM22 | SNV | Missense_Mutation | c.391N>G | p.Thr131Ala | p.T131A | Q9NW64 | protein_coding | tolerated(0.33) | benign(0.017) | TCGA-AD-6964-01 | Colorectum | colon adenocarcinoma | Male | <65 | III/IV | Chemotherapy | folfox | PD |
| Page: 1 2 3 4 |
Top |
Related drugs of malignant transformation related genes |
| Identification of chemicals and drugs interact with genes involved in malignant transfromation |
| (DGIdb 4.0) |
| Entrez ID | Symbol | Category | Interaction Types | Drug Claim Name | Drug Name | PMIDs |
| Page: 1 |

Copyright 2023-Present -The University of Texas Health Science Center at Houston |