
|
|||||
|
 | |
| |
| |
| |
| |
| |
|
Gene: RBM17 |
Gene summary for RBM17 |
| Gene information | Species | Human | Gene symbol | RBM17 | Gene ID | 84991 |
| Gene name | RNA binding motif protein 17 | |
| Gene Alias | SPF45 | |
| Cytomap | 10p15.1 | |
| Gene Type | protein-coding | GO ID | GO:0000375 | UniProtAcc | Q5W009 |
Top |
Malignant transformation analysis |
| Identification of the aberrant gene expression in precancerous and cancerous lesions by comparing the gene expression of stem-like cells in diseased tissues with normal stem cells |
| Entrez ID | Symbol | Replicates | Species | Organ | Tissue | Adj P-value | Log2FC | Malignancy |
| 84991 | RBM17 | LZE2T | Human | Esophagus | ESCC | 8.37e-06 | 1.11e+00 | 0.082 |
| 84991 | RBM17 | LZE4T | Human | Esophagus | ESCC | 1.65e-16 | 6.28e-01 | 0.0811 |
| 84991 | RBM17 | LZE7T | Human | Esophagus | ESCC | 2.18e-06 | 1.29e-01 | 0.0667 |
| 84991 | RBM17 | LZE20T | Human | Esophagus | ESCC | 6.23e-12 | 3.00e-01 | 0.0662 |
| 84991 | RBM17 | LZE22D1 | Human | Esophagus | HGIN | 2.65e-03 | 1.72e-01 | 0.0595 |
| 84991 | RBM17 | LZE22T | Human | Esophagus | ESCC | 3.17e-11 | 1.01e+00 | 0.068 |
| 84991 | RBM17 | LZE24T | Human | Esophagus | ESCC | 7.02e-37 | 1.22e+00 | 0.0596 |
| 84991 | RBM17 | LZE21T | Human | Esophagus | ESCC | 5.61e-03 | 7.53e-01 | 0.0655 |
| 84991 | RBM17 | LZE6T | Human | Esophagus | ESCC | 3.84e-02 | -1.13e-01 | 0.0845 |
| 84991 | RBM17 | P1T-E | Human | Esophagus | ESCC | 2.06e-24 | 1.21e+00 | 0.0875 |
| 84991 | RBM17 | P2T-E | Human | Esophagus | ESCC | 2.12e-58 | 1.25e+00 | 0.1177 |
| 84991 | RBM17 | P4T-E | Human | Esophagus | ESCC | 4.04e-63 | 1.70e+00 | 0.1323 |
| 84991 | RBM17 | P5T-E | Human | Esophagus | ESCC | 7.82e-60 | 1.29e+00 | 0.1327 |
| 84991 | RBM17 | P8T-E | Human | Esophagus | ESCC | 3.81e-52 | 9.81e-01 | 0.0889 |
| 84991 | RBM17 | P9T-E | Human | Esophagus | ESCC | 7.86e-24 | 8.03e-01 | 0.1131 |
| 84991 | RBM17 | P10T-E | Human | Esophagus | ESCC | 1.05e-32 | 7.76e-01 | 0.116 |
| 84991 | RBM17 | P11T-E | Human | Esophagus | ESCC | 1.46e-18 | 8.46e-01 | 0.1426 |
| 84991 | RBM17 | P12T-E | Human | Esophagus | ESCC | 5.30e-63 | 1.40e+00 | 0.1122 |
| 84991 | RBM17 | P15T-E | Human | Esophagus | ESCC | 5.11e-59 | 1.39e+00 | 0.1149 |
| 84991 | RBM17 | P16T-E | Human | Esophagus | ESCC | 1.27e-49 | 1.03e+00 | 0.1153 |
| Page: 1 2 3 4 5 6 7 |
| Tissue | Expression Dynamics | Abbreviation |
| Esophagus | 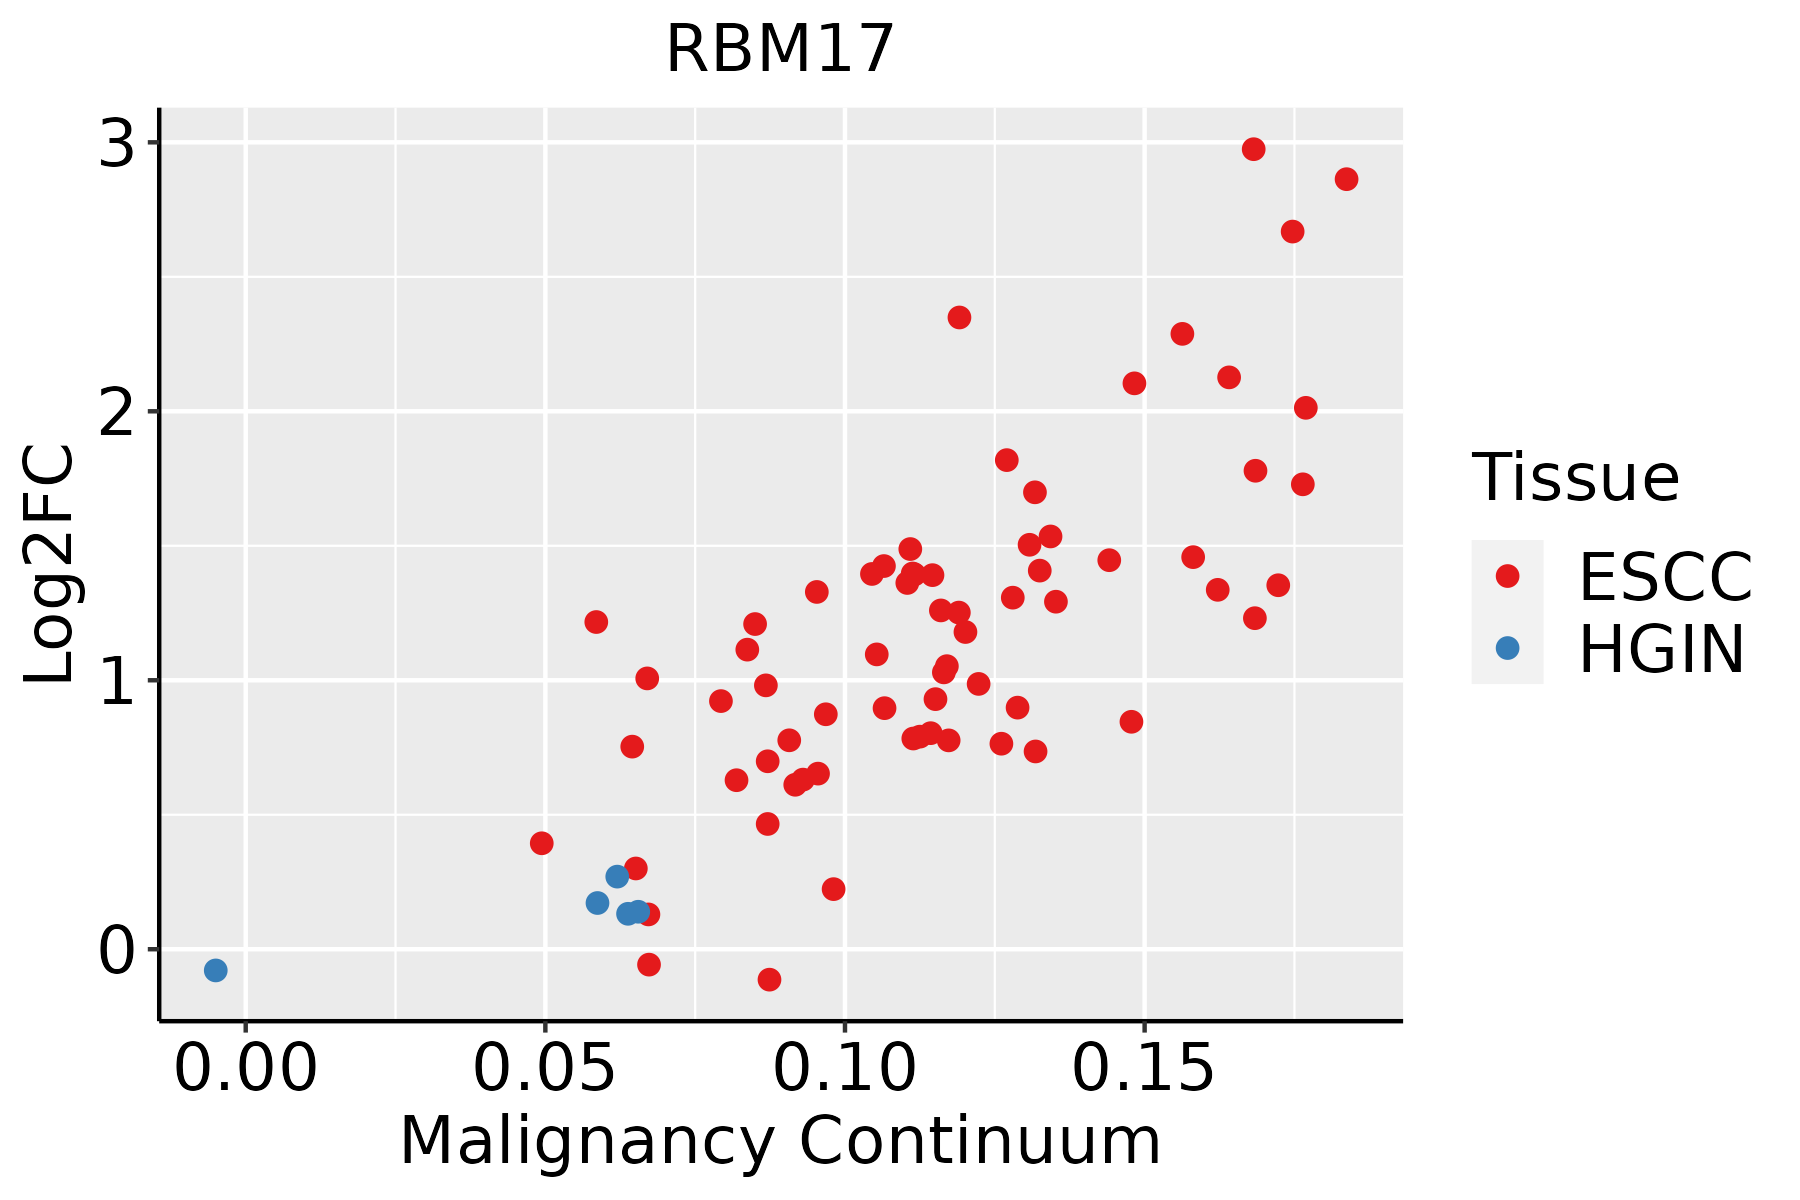 | ESCC: Esophageal squamous cell carcinoma |
| HGIN: High-grade intraepithelial neoplasias | ||
| LGIN: Low-grade intraepithelial neoplasias | ||
| Liver |  | HCC: Hepatocellular carcinoma |
| NAFLD: Non-alcoholic fatty liver disease | ||
| Oral Cavity | 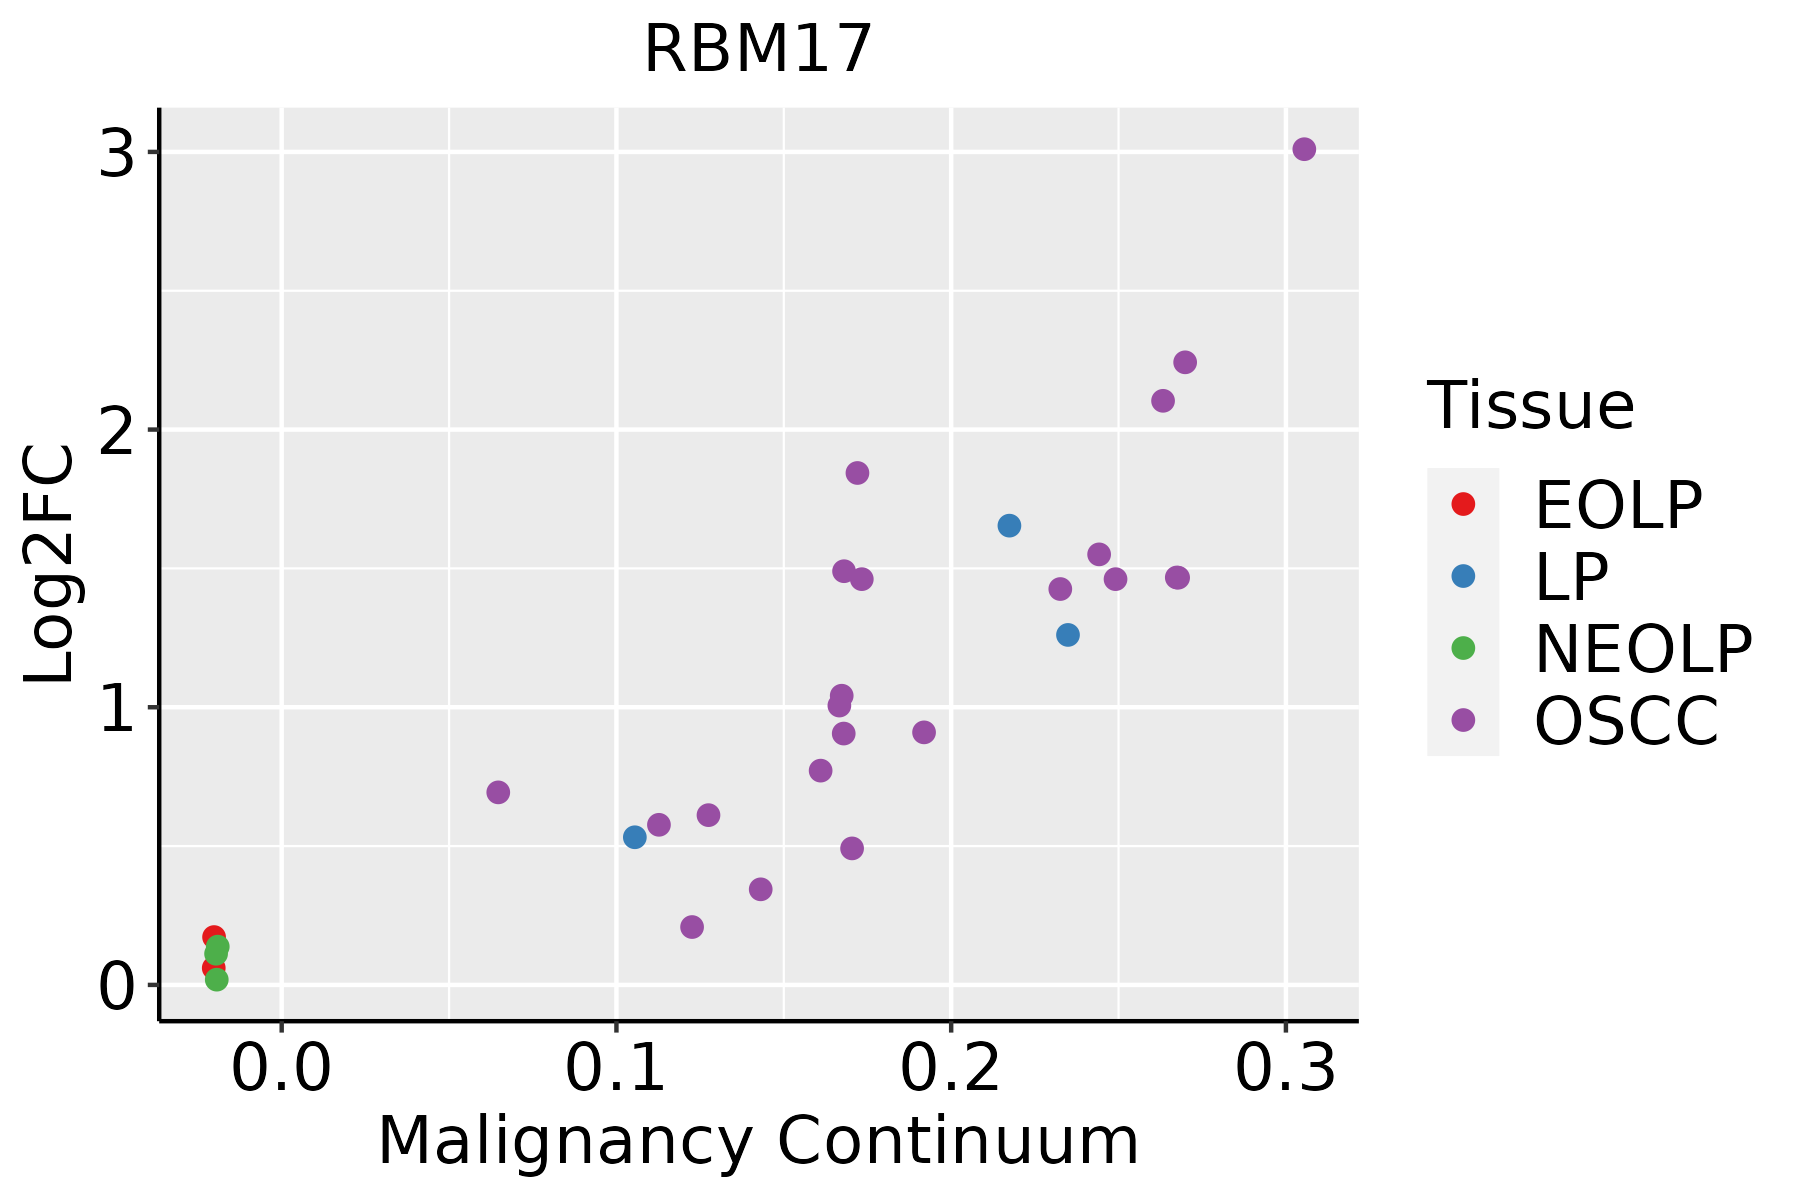 | EOLP: Erosive Oral lichen planus |
| LP: leukoplakia | ||
| NEOLP: Non-erosive oral lichen planus | ||
| OSCC: Oral squamous cell carcinoma | ||
| Skin | 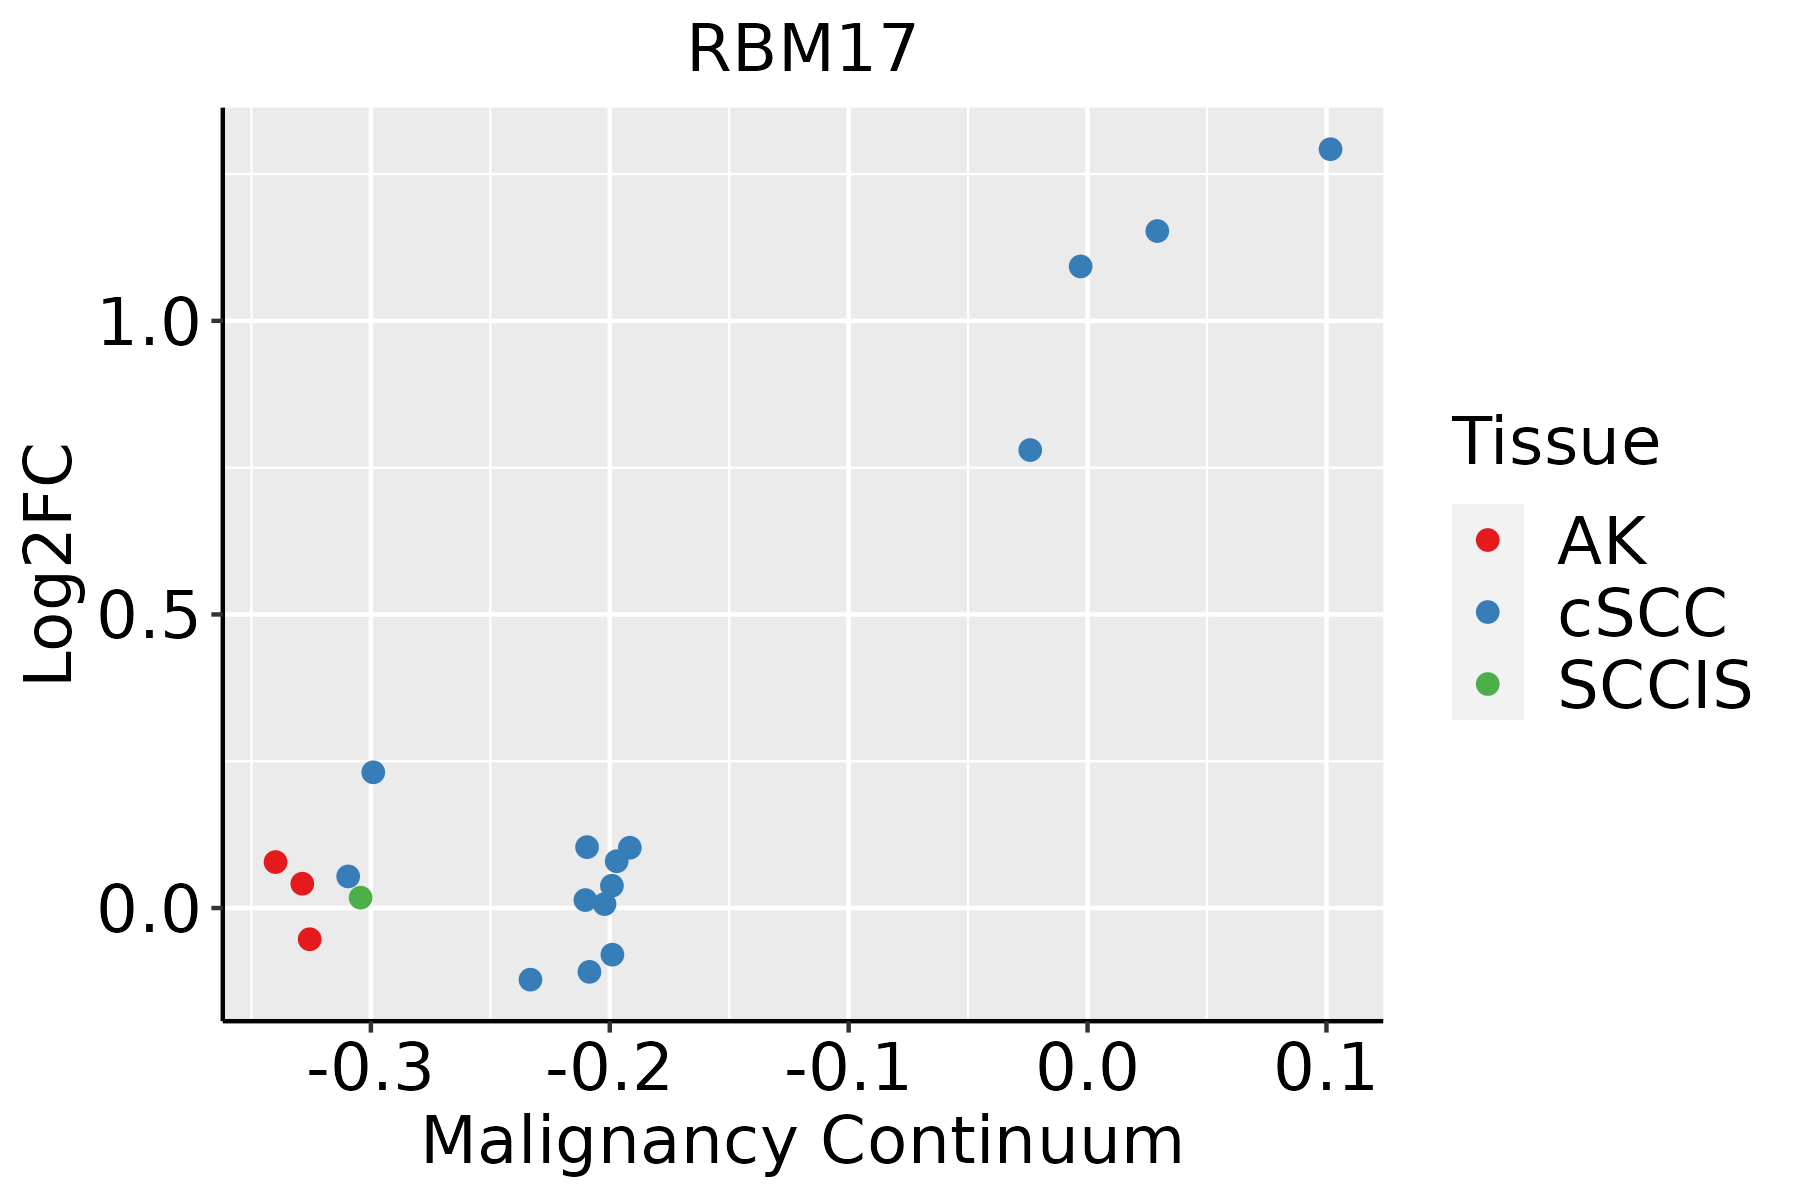 | AK: Actinic keratosis |
| cSCC: Cutaneous squamous cell carcinoma | ||
| SCCIS:squamous cell carcinoma in situ | ||
| Thyroid | 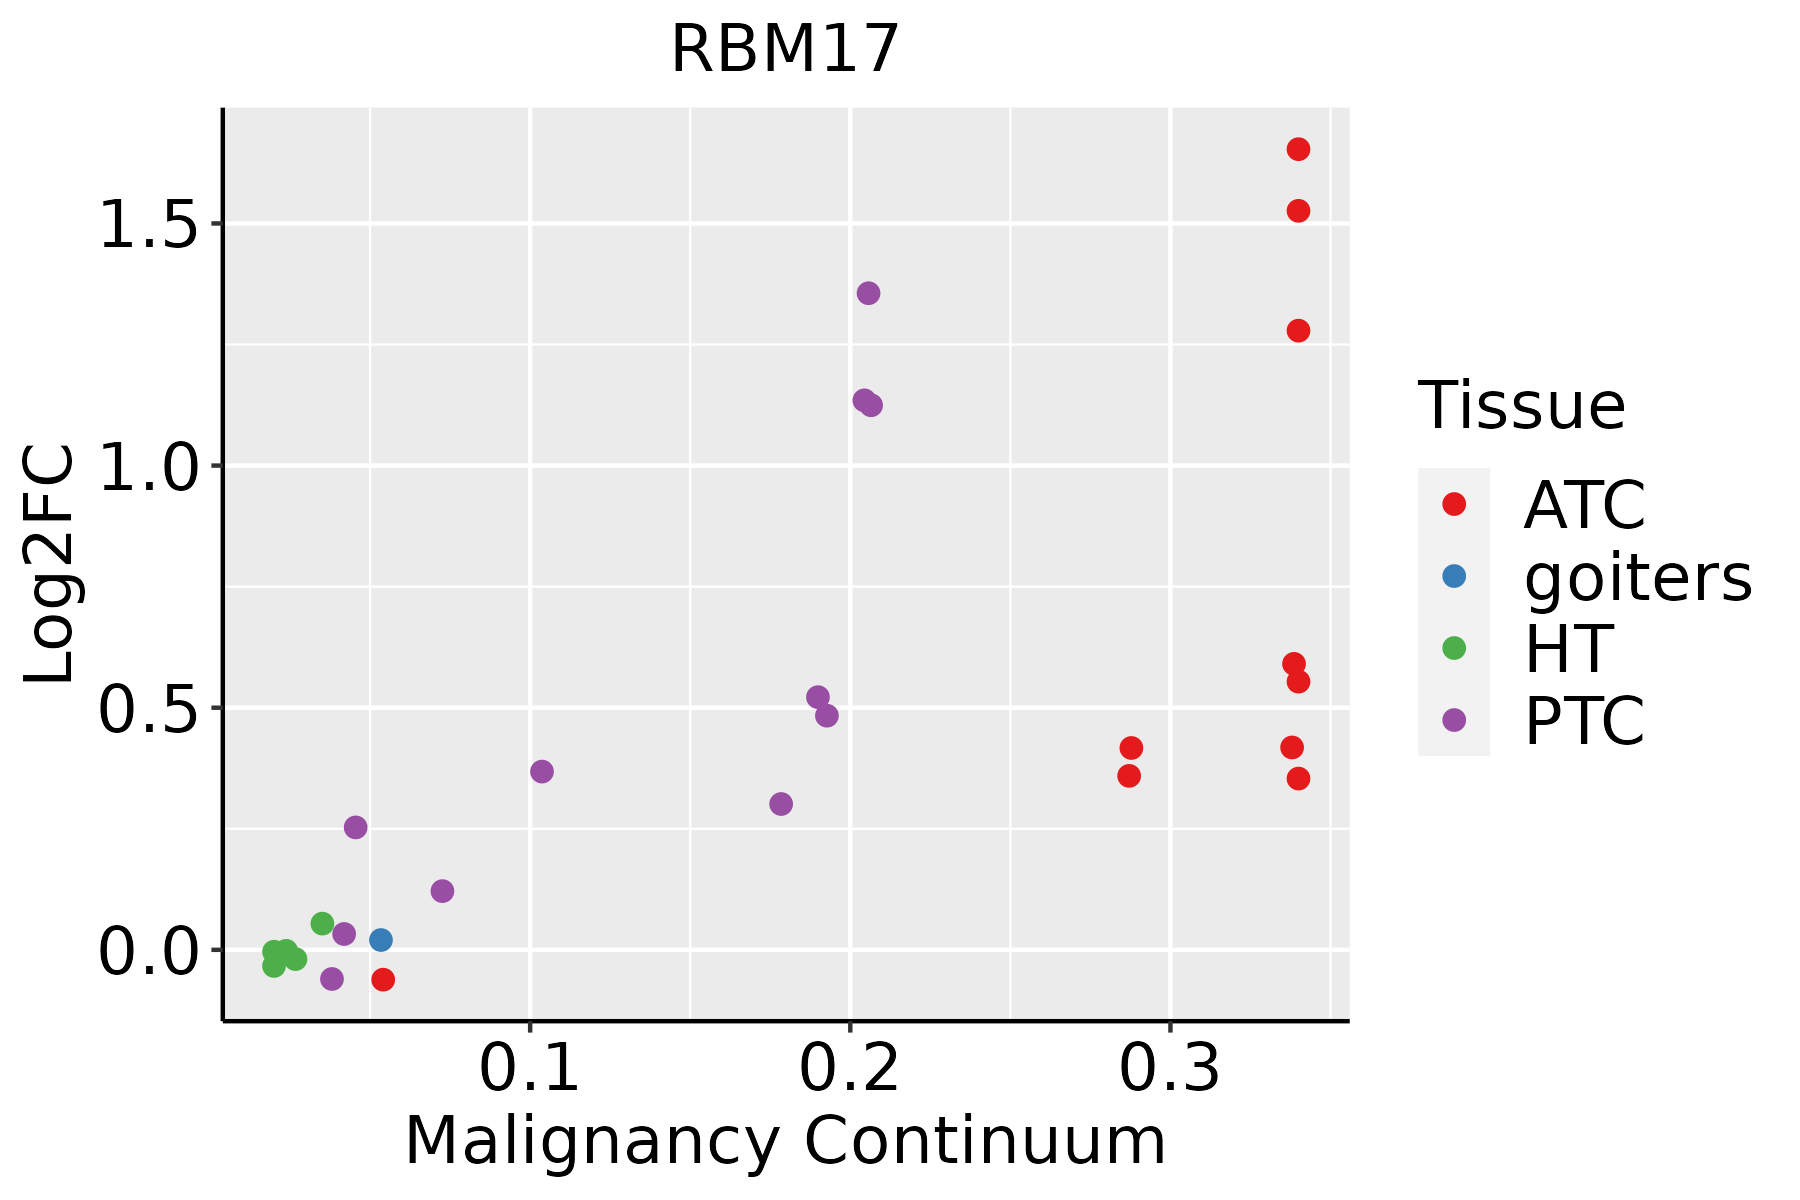 | ATC: Anaplastic thyroid cancer |
| HT: Hashimoto's thyroiditis | ||
| PTC: Papillary thyroid cancer |
| ∗log2FC in expression of this searched gene in stem-like cells from each diseased tissue sample relative to stem-like cells in normal samples in each tissue plotted against the malignancy continuum. Samples are colored based on if they are from different disease stage. |
Top |
Malignant transformation related pathway analysis |
| Find out the enriched GO biological processes and KEGG pathways involved in transition from healthy to precancer to cancer |
| Tissue | Disease Stage | Enriched GO biological Processes |
| Colorectum | AD |  |
| Colorectum | SER |  |
| Colorectum | MSS |  |
| Colorectum | MSI-H |  |
| Colorectum | FAP |  |
| ∗Top 15 enriched GO BP terms are showed in the bar plot of each disease state in each tissue. Each row represents a significant GO biological process which is colored according to the -log10(p.adjust). |
| Page: 1 2 3 4 5 6 7 8 9 |
| GO ID | Tissue | Disease Stage | Description | Gene Ratio | Bg Ratio | pvalue | p.adjust | Count |
| GO:000838026 | Esophagus | HGIN | RNA splicing | 160/2587 | 434/18723 | 3.74e-34 | 1.12e-30 | 160 |
| GO:000037520 | Esophagus | HGIN | RNA splicing, via transesterification reactions | 115/2587 | 324/18723 | 3.16e-23 | 3.80e-20 | 115 |
| GO:000037720 | Esophagus | HGIN | RNA splicing, via transesterification reactions with bulged adenosine as nucleophile | 113/2587 | 320/18723 | 1.24e-22 | 9.26e-20 | 113 |
| GO:000039820 | Esophagus | HGIN | mRNA splicing, via spliceosome | 113/2587 | 320/18723 | 1.24e-22 | 9.26e-20 | 113 |
| GO:000038018 | Esophagus | HGIN | alternative mRNA splicing, via spliceosome | 32/2587 | 77/18723 | 2.06e-09 | 1.54e-07 | 32 |
| GO:0008380111 | Esophagus | ESCC | RNA splicing | 336/8552 | 434/18723 | 1.74e-42 | 3.67e-39 | 336 |
| GO:0000375111 | Esophagus | ESCC | RNA splicing, via transesterification reactions | 248/8552 | 324/18723 | 3.05e-30 | 1.49e-27 | 248 |
| GO:0000377111 | Esophagus | ESCC | RNA splicing, via transesterification reactions with bulged adenosine as nucleophile | 244/8552 | 320/18723 | 2.52e-29 | 1.07e-26 | 244 |
| GO:0000398111 | Esophagus | ESCC | mRNA splicing, via spliceosome | 244/8552 | 320/18723 | 2.52e-29 | 1.07e-26 | 244 |
| GO:000038019 | Esophagus | ESCC | alternative mRNA splicing, via spliceosome | 55/8552 | 77/18723 | 4.07e-06 | 4.38e-05 | 55 |
| GO:000838012 | Liver | Cirrhotic | RNA splicing | 229/4634 | 434/18723 | 9.13e-37 | 2.86e-33 | 229 |
| GO:000037512 | Liver | Cirrhotic | RNA splicing, via transesterification reactions | 175/4634 | 324/18723 | 5.95e-30 | 7.47e-27 | 175 |
| GO:000037712 | Liver | Cirrhotic | RNA splicing, via transesterification reactions with bulged adenosine as nucleophile | 172/4634 | 320/18723 | 4.02e-29 | 3.60e-26 | 172 |
| GO:000039812 | Liver | Cirrhotic | mRNA splicing, via spliceosome | 172/4634 | 320/18723 | 4.02e-29 | 3.60e-26 | 172 |
| GO:000038011 | Liver | Cirrhotic | alternative mRNA splicing, via spliceosome | 43/4634 | 77/18723 | 5.31e-09 | 2.10e-07 | 43 |
| GO:000838022 | Liver | HCC | RNA splicing | 313/7958 | 434/18723 | 1.36e-36 | 1.73e-33 | 313 |
| GO:000037522 | Liver | HCC | RNA splicing, via transesterification reactions | 228/7958 | 324/18723 | 1.47e-24 | 4.06e-22 | 228 |
| GO:000037722 | Liver | HCC | RNA splicing, via transesterification reactions with bulged adenosine as nucleophile | 224/7958 | 320/18723 | 1.16e-23 | 2.62e-21 | 224 |
| GO:000039822 | Liver | HCC | mRNA splicing, via spliceosome | 224/7958 | 320/18723 | 1.16e-23 | 2.62e-21 | 224 |
| GO:000038021 | Liver | HCC | alternative mRNA splicing, via spliceosome | 52/7958 | 77/18723 | 7.87e-06 | 9.27e-05 | 52 |
| Page: 1 2 3 |
| Pathway ID | Tissue | Disease Stage | Description | Gene Ratio | Bg Ratio | pvalue | p.adjust | qvalue | Count |
| hsa0304018 | Esophagus | HGIN | Spliceosome | 79/1383 | 217/8465 | 3.22e-13 | 7.00e-12 | 5.56e-12 | 79 |
| hsa0304019 | Esophagus | HGIN | Spliceosome | 79/1383 | 217/8465 | 3.22e-13 | 7.00e-12 | 5.56e-12 | 79 |
| hsa0304027 | Esophagus | ESCC | Spliceosome | 128/4205 | 217/8465 | 3.31e-03 | 8.79e-03 | 4.50e-03 | 128 |
| hsa0304037 | Esophagus | ESCC | Spliceosome | 128/4205 | 217/8465 | 3.31e-03 | 8.79e-03 | 4.50e-03 | 128 |
| hsa030407 | Liver | Cirrhotic | Spliceosome | 102/2530 | 217/8465 | 5.69e-08 | 9.47e-07 | 5.84e-07 | 102 |
| hsa0304012 | Liver | Cirrhotic | Spliceosome | 102/2530 | 217/8465 | 5.69e-08 | 9.47e-07 | 5.84e-07 | 102 |
| hsa0304022 | Liver | HCC | Spliceosome | 122/4020 | 217/8465 | 5.55e-03 | 1.60e-02 | 8.91e-03 | 122 |
| hsa0304032 | Liver | HCC | Spliceosome | 122/4020 | 217/8465 | 5.55e-03 | 1.60e-02 | 8.91e-03 | 122 |
| hsa0304016 | Oral cavity | OSCC | Spliceosome | 123/3704 | 217/8465 | 7.21e-05 | 2.74e-04 | 1.40e-04 | 123 |
| hsa0304017 | Oral cavity | OSCC | Spliceosome | 123/3704 | 217/8465 | 7.21e-05 | 2.74e-04 | 1.40e-04 | 123 |
| hsa0304026 | Oral cavity | LP | Spliceosome | 106/2418 | 217/8465 | 1.30e-10 | 2.40e-09 | 1.55e-09 | 106 |
| hsa0304036 | Oral cavity | LP | Spliceosome | 106/2418 | 217/8465 | 1.30e-10 | 2.40e-09 | 1.55e-09 | 106 |
| Page: 1 |
Top |
Cell-cell communication analysis |
| Identification of potential cell-cell interactions between two cell types and their ligand-receptor pairs for different disease states |
| Ligand | Receptor | LRpair | Pathway | Tissue | Disease Stage |
| Page: 1 |
Top |
Single-cell gene regulatory network inference analysis |
| Find out the significant the regulons (TFs) and the target genes of each regulon across cell types for different disease states |
| TF | Cell Type | Tissue | Disease Stage | Target Gene | RSS | Regulon Activity |
| RBM17 | PCV | Cervix | ADJ | KCTD12,ICAM2,CLDN5, etc. | 1.22e-01 |  |
| RBM17 | MVA | Cervix | ADJ | KCTD12,ICAM2,CLDN5, etc. | 2.45e-01 | |
| RBM17 | END | Cervix | CC | KCTD12,ICAM2,CLDN5, etc. | 3.76e-01 |  |
| RBM17 | MVA | Cervix | CC | KCTD12,ICAM2,CLDN5, etc. | 2.47e-02 | |
| RBM17 | END | Cervix | Healthy | KCTD12,ICAM2,CLDN5, etc. | 1.74e-01 |  |
| RBM17 | END | Cervix | HSIL_HPV | KCTD12,ICAM2,CLDN5, etc. | 3.84e-01 |  |
| RBM17 | MVA | Cervix | HSIL_HPV | KCTD12,ICAM2,CLDN5, etc. | 7.31e-02 | |
| RBM17 | END | Cervix | N_HPV | KCTD12,ICAM2,CLDN5, etc. | 3.68e-01 |  |
| RBM17 | ICAF | Cervix | N_HPV | KCTD12,ICAM2,CLDN5, etc. | 3.61e-02 | |
| RBM17 | FIB | Endometrium | ADJ | NSMCE1,MIIP,RAB33A, etc. | 1.95e-02 |  |
| ∗The dot plots of a searched regulon are shown for all cell subpopulations in each disease state of each tissue based on the regulon specific score inferred using pySCENIC and by calculating the average expression. |
| Page: 1 2 3 |
Top |
Somatic mutation of malignant transformation related genes |
| Annotation of somatic variants for genes involved in malignant transformation |
| Hugo Symbol | Variant Class | Variant Classification | dbSNP RS | HGVSc | HGVSp | HGVSp Short | SWISSPROT | BIOTYPE | SIFT | PolyPhen | Tumor Sample Barcode | Tissue | Histology | Sex | Age | Stage | Therapy Types | Drugs | Outcome |
| RBM17 | SNV | Missense_Mutation | c.263N>G | p.Ser88Cys | p.S88C | Q96I25 | protein_coding | tolerated(0.18) | possibly_damaging(0.785) | TCGA-C8-A26Y-01 | Breast | breast invasive carcinoma | Female | >=65 | I/II | Unknown | Unknown | SD | |
| RBM17 | SNV | Missense_Mutation | c.841G>A | p.Asp281Asn | p.D281N | Q96I25 | protein_coding | tolerated(0.22) | benign(0.023) | TCGA-DR-A0ZM-01 | Cervix | cervical & endocervical cancer | Female | <65 | III/IV | Unspecific | Cisplatin | SD | |
| RBM17 | SNV | Missense_Mutation | novel | c.973N>A | p.Glu325Lys | p.E325K | Q96I25 | protein_coding | deleterious(0.03) | probably_damaging(0.999) | TCGA-MY-A5BF-01 | Cervix | cervical & endocervical cancer | Female | >=65 | I/II | Chemotherapy | cisplatin | CR |
| RBM17 | SNV | Missense_Mutation | novel | c.729G>A | p.Met243Ile | p.M243I | Q96I25 | protein_coding | deleterious(0.01) | probably_damaging(0.94) | TCGA-VS-A8EB-01 | Cervix | cervical & endocervical cancer | Female | <65 | III/IV | Unknown | Unknown | PD |
| RBM17 | SNV | Missense_Mutation | rs753761759 | c.817N>T | p.Arg273Cys | p.R273C | Q96I25 | protein_coding | deleterious(0) | probably_damaging(0.99) | TCGA-A6-3809-01 | Colorectum | colon adenocarcinoma | Female | >=65 | I/II | Unknown | Unknown | SD |
| RBM17 | SNV | Missense_Mutation | c.823N>A | p.Gly275Ser | p.G275S | Q96I25 | protein_coding | deleterious(0.03) | probably_damaging(0.999) | TCGA-AA-A01R-01 | Colorectum | colon adenocarcinoma | Male | <65 | III/IV | Chemotherapy | 5-fluorouracil | PD | |
| RBM17 | SNV | Missense_Mutation | c.769C>T | p.His257Tyr | p.H257Y | Q96I25 | protein_coding | tolerated(0.15) | possibly_damaging(0.73) | TCGA-AZ-6605-01 | Colorectum | colon adenocarcinoma | Male | >=65 | III/IV | Chemotherapy | folfox | SD | |
| RBM17 | SNV | Missense_Mutation | rs780062896 | c.413N>A | p.Arg138His | p.R138H | Q96I25 | protein_coding | tolerated(0.21) | benign(0.018) | TCGA-A5-A0G2-01 | Endometrium | uterine corpus endometrioid carcinoma | Female | <65 | III/IV | Unknown | Unknown | SD |
| RBM17 | SNV | Missense_Mutation | novel | c.1102N>T | p.Ala368Ser | p.A368S | Q96I25 | protein_coding | tolerated(0.12) | probably_damaging(0.967) | TCGA-A5-A0G2-01 | Endometrium | uterine corpus endometrioid carcinoma | Female | <65 | III/IV | Unknown | Unknown | SD |
| RBM17 | SNV | Missense_Mutation | c.821N>A | p.Gly274Asp | p.G274D | Q96I25 | protein_coding | deleterious(0) | probably_damaging(0.999) | TCGA-AX-A05S-01 | Endometrium | uterine corpus endometrioid carcinoma | Female | >=65 | III/IV | Unspecific | Carboplatin & Paclitaxel | PD |
| Page: 1 2 3 4 |
Top |
Related drugs of malignant transformation related genes |
| Identification of chemicals and drugs interact with genes involved in malignant transfromation |
| (DGIdb 4.0) |
| Entrez ID | Symbol | Category | Interaction Types | Drug Claim Name | Drug Name | PMIDs |
| Page: 1 |

Copyright 2023-Present -The University of Texas Health Science Center at Houston |