Schematic overview of the cellular and molecular mechanisms involved in the cancer progression, including the proposed cellular and molecular mechanisms in cancer cells trajectory. AT1: alveolar type 1 cells; AT2: alveolar type 2 cells; AAH: atypical adenomatous hyperplasia; AIS: adenocarcinoma in situ; MIA: minimally invasive adenocarcinoma; IA: invasive adenocarcinoma; EMT: epithelial-mesenchymal transition

Home

Download

Statistics

Help

Contact

Center for Computational Systems Medicine
leaf

Gene summary

leaf

Malignant transformation analysis

leaf

Malignant transformation related pathway analysis

leaf

Cell-cell communication analysis

leaf

Single-cell gene regulatory network inference analysis

leaf

Somatic mutation of malignant transformation related genes

leaf

Related drugs of malignant transformation related genes

Gene: RBM14

Gene summary for RBM14

check button Gene summary.

Gene informationSpeciesHuman
Gene symbol

RBM14

Gene ID

10432

Gene nameRNA binding motif protein 14
Gene AliasCOAA
Cytomap11q13.2
Gene Typeprotein-coding
GO ID

GO:0000226

UniProtAcc

A0A0S2Z567


Top

Malignant transformation analysis

check button Identification of the aberrant gene expression in precancerous and cancerous lesions by comparing the gene expression of stem-like cells in diseased tissues with normal stem cells
check button Malignant transformation involving gene list.
Entrez IDSymbolReplicatesSpeciesOrganTissueAdj P-valueLog2FCMalignancy
10432RBM14HTA11_3410_2000001011HumanColorectumAD6.55e-041.28e-010.0155
10432RBM14HTA11_1938_2000001011HumanColorectumAD2.24e-041.86e-01-0.0811
10432RBM14HTA11_78_2000001011HumanColorectumAD2.20e-051.60e-01-0.1088
10432RBM14HTA11_347_2000001011HumanColorectumAD7.02e-071.55e-01-0.1954
10432RBM14HTA11_411_2000001011HumanColorectumSER5.61e-032.55e-01-0.2602
10432RBM14HTA11_3361_2000001011HumanColorectumAD5.46e-031.69e-01-0.1207
10432RBM14HTA11_83_2000001011HumanColorectumSER2.04e-021.35e-01-0.1526
10432RBM14HTA11_696_2000001011HumanColorectumAD4.46e-071.63e-01-0.1464
10432RBM14HTA11_866_2000001011HumanColorectumAD1.71e-029.74e-02-0.1001
10432RBM14HTA11_1391_2000001011HumanColorectumAD3.65e-102.44e-01-0.059
10432RBM14HTA11_5216_2000001011HumanColorectumSER3.40e-021.93e-01-0.1462
10432RBM14HTA11_866_3004761011HumanColorectumAD1.36e-071.83e-010.096
10432RBM14HTA11_10623_2000001011HumanColorectumAD8.98e-031.87e-01-0.0177
10432RBM14HTA11_6801_2000001011HumanColorectumSER2.21e-023.87e-010.0171
10432RBM14HTA11_7696_3000711011HumanColorectumAD9.32e-102.13e-010.0674
10432RBM14HTA11_7469_2000001011HumanColorectumAD3.81e-022.45e-01-0.0124
10432RBM14HTA11_6818_2000001021HumanColorectumAD2.64e-031.45e-010.0588
10432RBM14HTA11_99999970781_79442HumanColorectumMSS2.05e-061.74e-010.294
10432RBM14HTA11_99999965062_69753HumanColorectumMSI-H5.36e-075.36e-010.3487
10432RBM14HTA11_99999965104_69814HumanColorectumMSS7.49e-103.40e-010.281
Page: 1 2 3 4 5 6 

check button Transcriptomic changes along malignancy continuum.
TissueExpression DynamicsAbbreviation
Colorectum (GSE201348)The image shows the transcriptomic changes along malignancy continuum.log2FC in expression of this searched gene in stem-like cells from each diseased tissue sample relative to stem-like cells in normal samples in each tissue plotted against the malignancy continuum. Samples are colored based on if they are from different disease stage.FAP: Familial adenomatous polyposis
CRC: Colorectal cancer
Colorectum (HTA11)The image shows the transcriptomic changes along malignancy continuum.log2FC in expression of this searched gene in stem-like cells from each diseased tissue sample relative to stem-like cells in normal samples in each tissue plotted against the malignancy continuum. Samples are colored based on if they are from different disease stage.AD: Adenomas
SER: Sessile serrated lesions
MSI-H: Microsatellite-high colorectal cancer
MSS: Microsatellite stable colorectal cancer
EsophagusThe image shows the transcriptomic changes along malignancy continuum.log2FC in expression of this searched gene in stem-like cells from each diseased tissue sample relative to stem-like cells in normal samples in each tissue plotted against the malignancy continuum. Samples are colored based on if they are from different disease stage.ESCC: Esophageal squamous cell carcinoma
HGIN: High-grade intraepithelial neoplasias
LGIN: Low-grade intraepithelial neoplasias
Oral CavityThe image shows the transcriptomic changes along malignancy continuum.log2FC in expression of this searched gene in stem-like cells from each diseased tissue sample relative to stem-like cells in normal samples in each tissue plotted against the malignancy continuum. Samples are colored based on if they are from different disease stage.
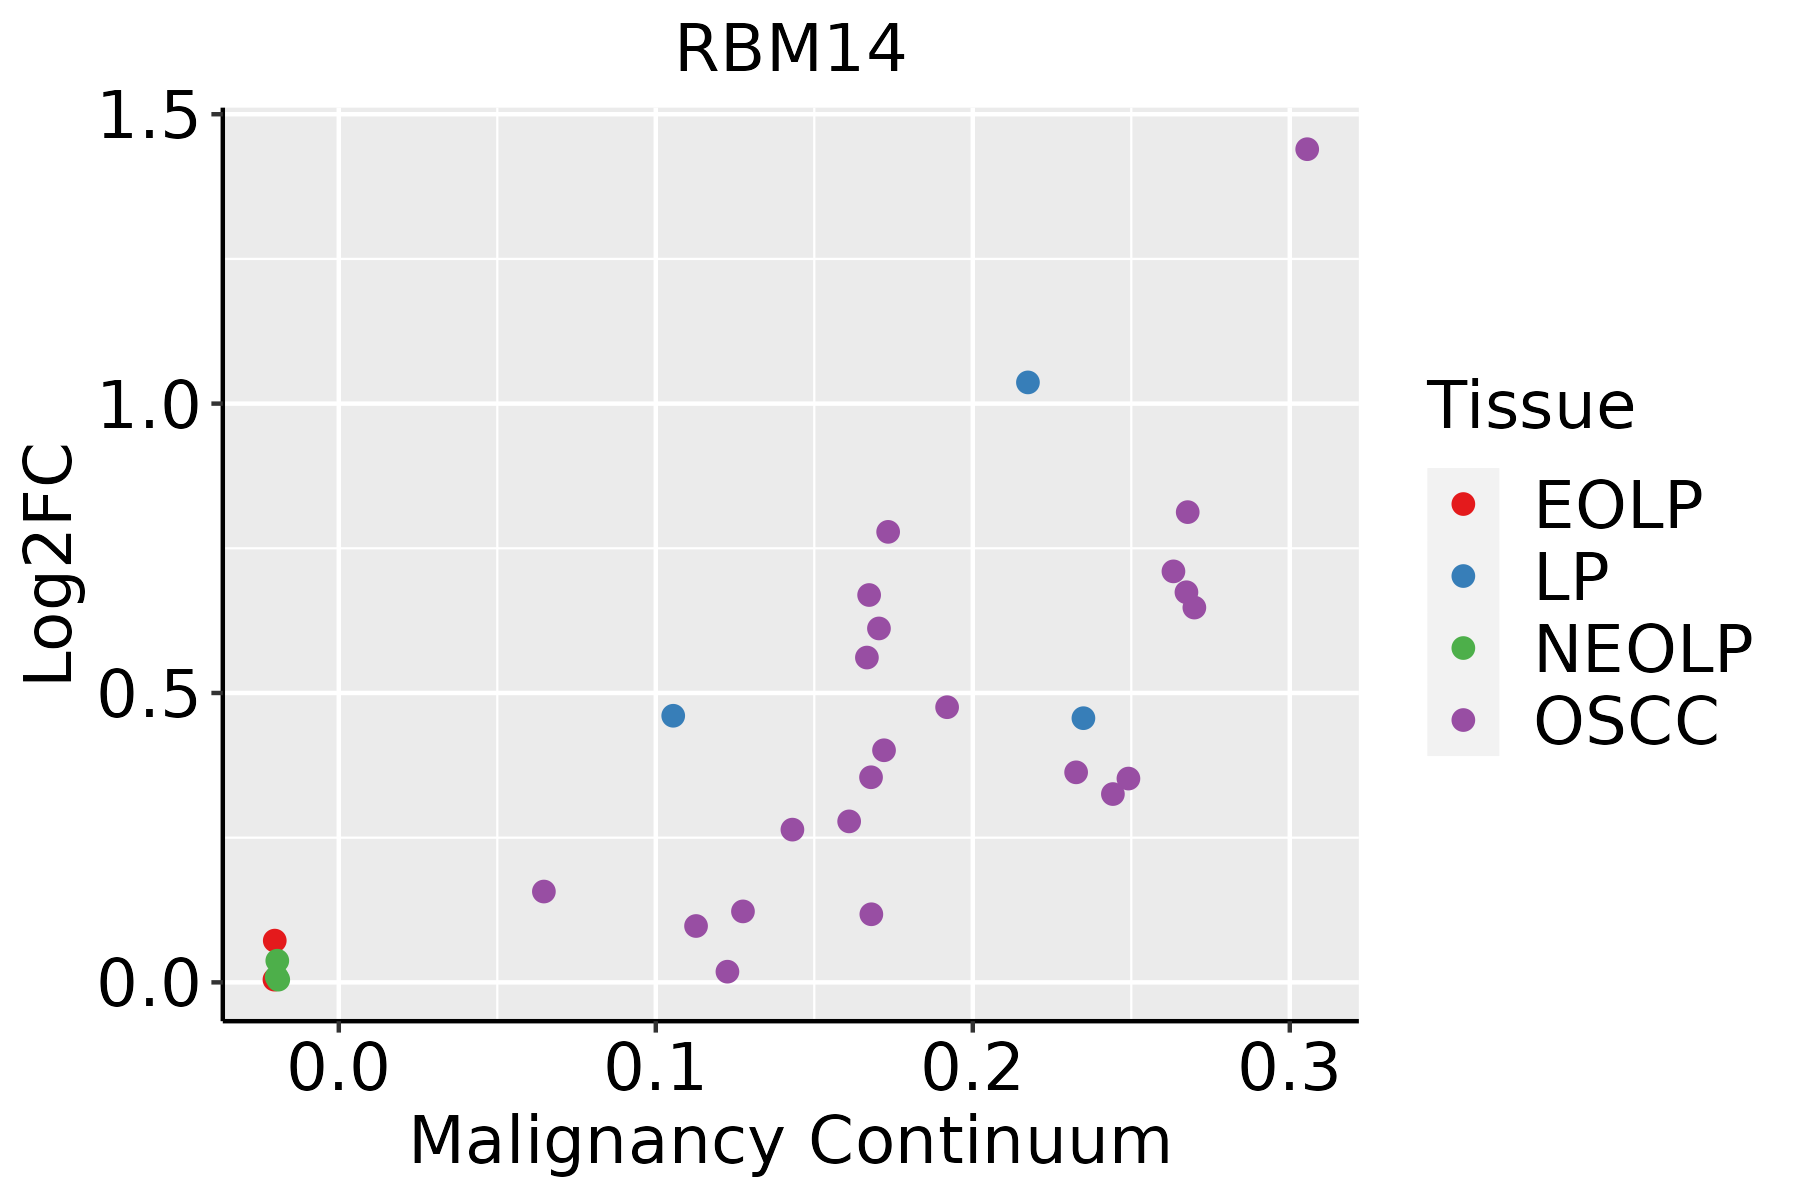
EOLP: Erosive Oral lichen planus
LP: leukoplakia
NEOLP: Non-erosive oral lichen planus
OSCC: Oral squamous cell carcinoma
SkinThe image shows the transcriptomic changes along malignancy continuum.log2FC in expression of this searched gene in stem-like cells from each diseased tissue sample relative to stem-like cells in normal samples in each tissue plotted against the malignancy continuum. Samples are colored based on if they are from different disease stage.
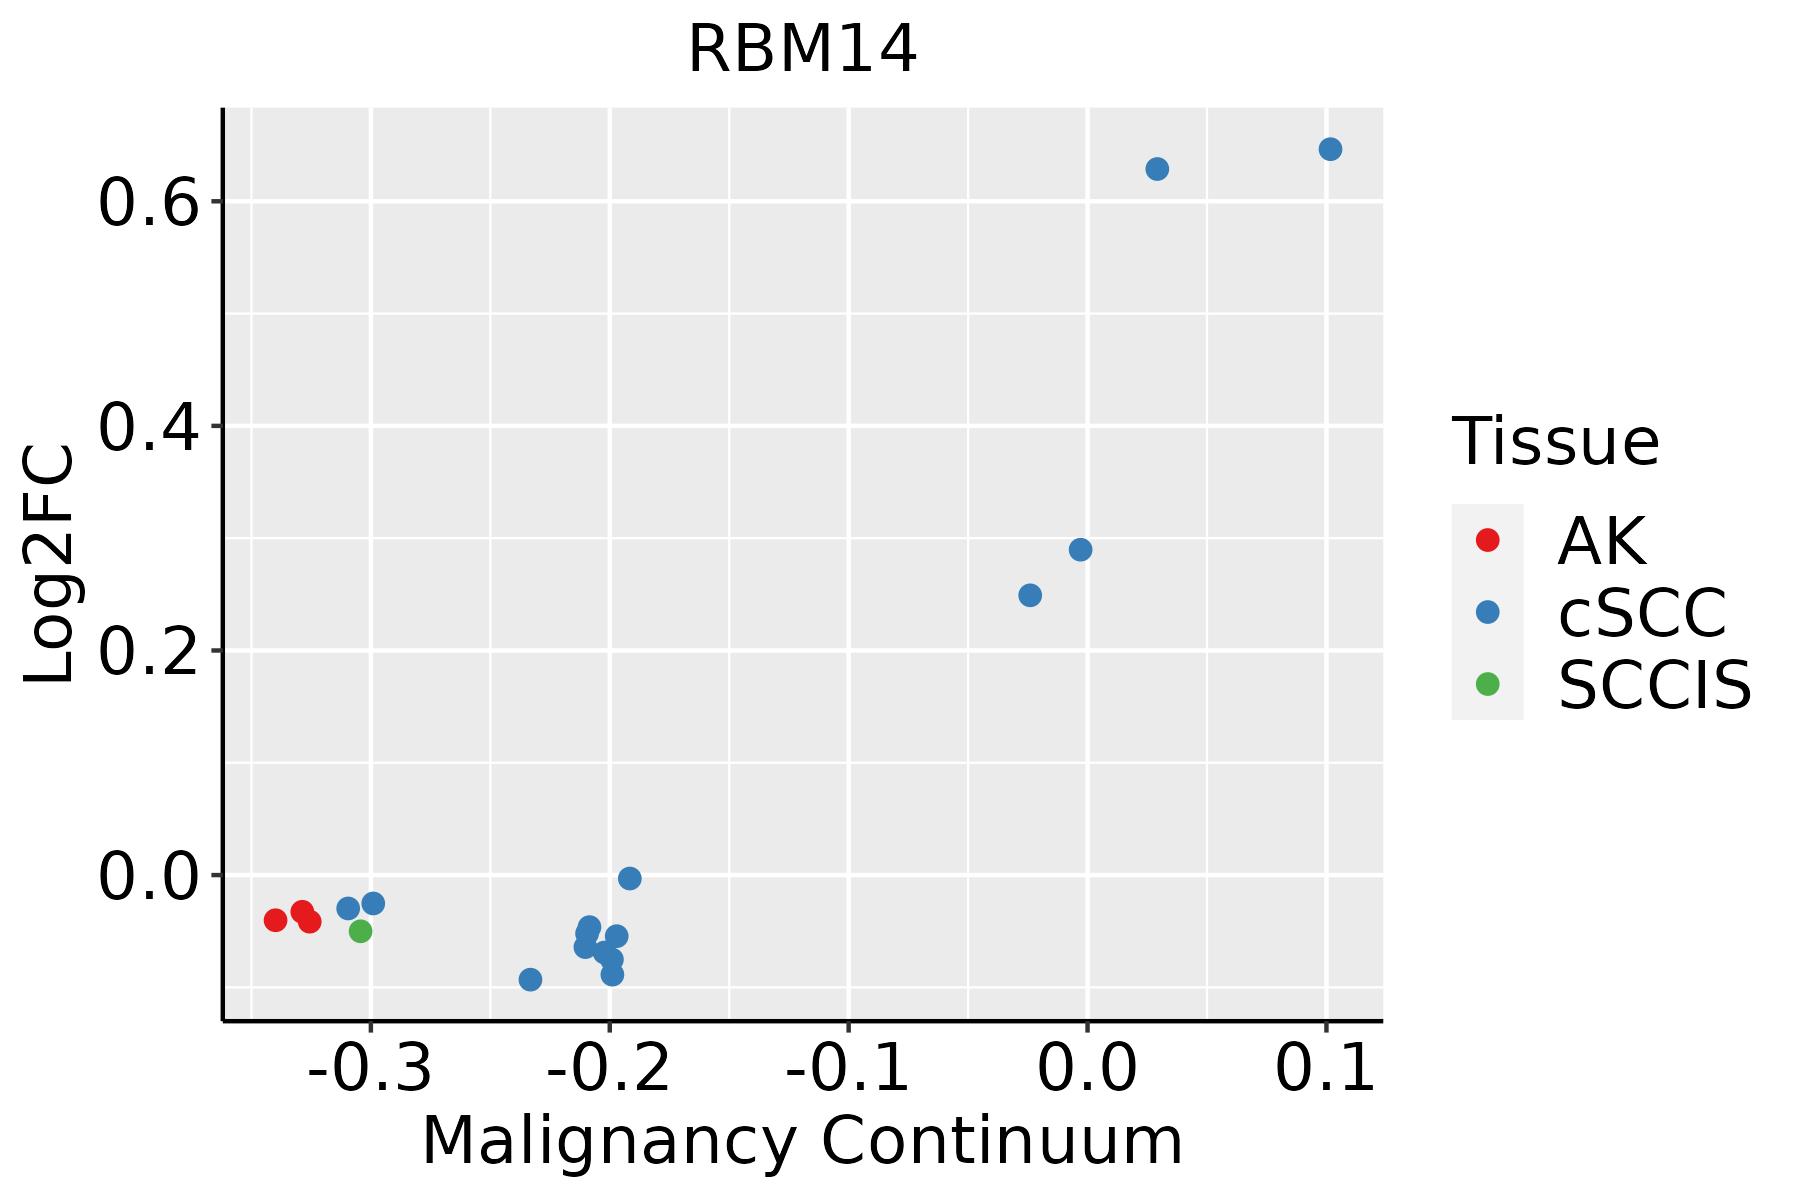
AK: Actinic keratosis
cSCC: Cutaneous squamous cell carcinoma
SCCIS:squamous cell carcinoma in situ
ThyroidThe image shows the transcriptomic changes along malignancy continuum.log2FC in expression of this searched gene in stem-like cells from each diseased tissue sample relative to stem-like cells in normal samples in each tissue plotted against the malignancy continuum. Samples are colored based on if they are from different disease stage.
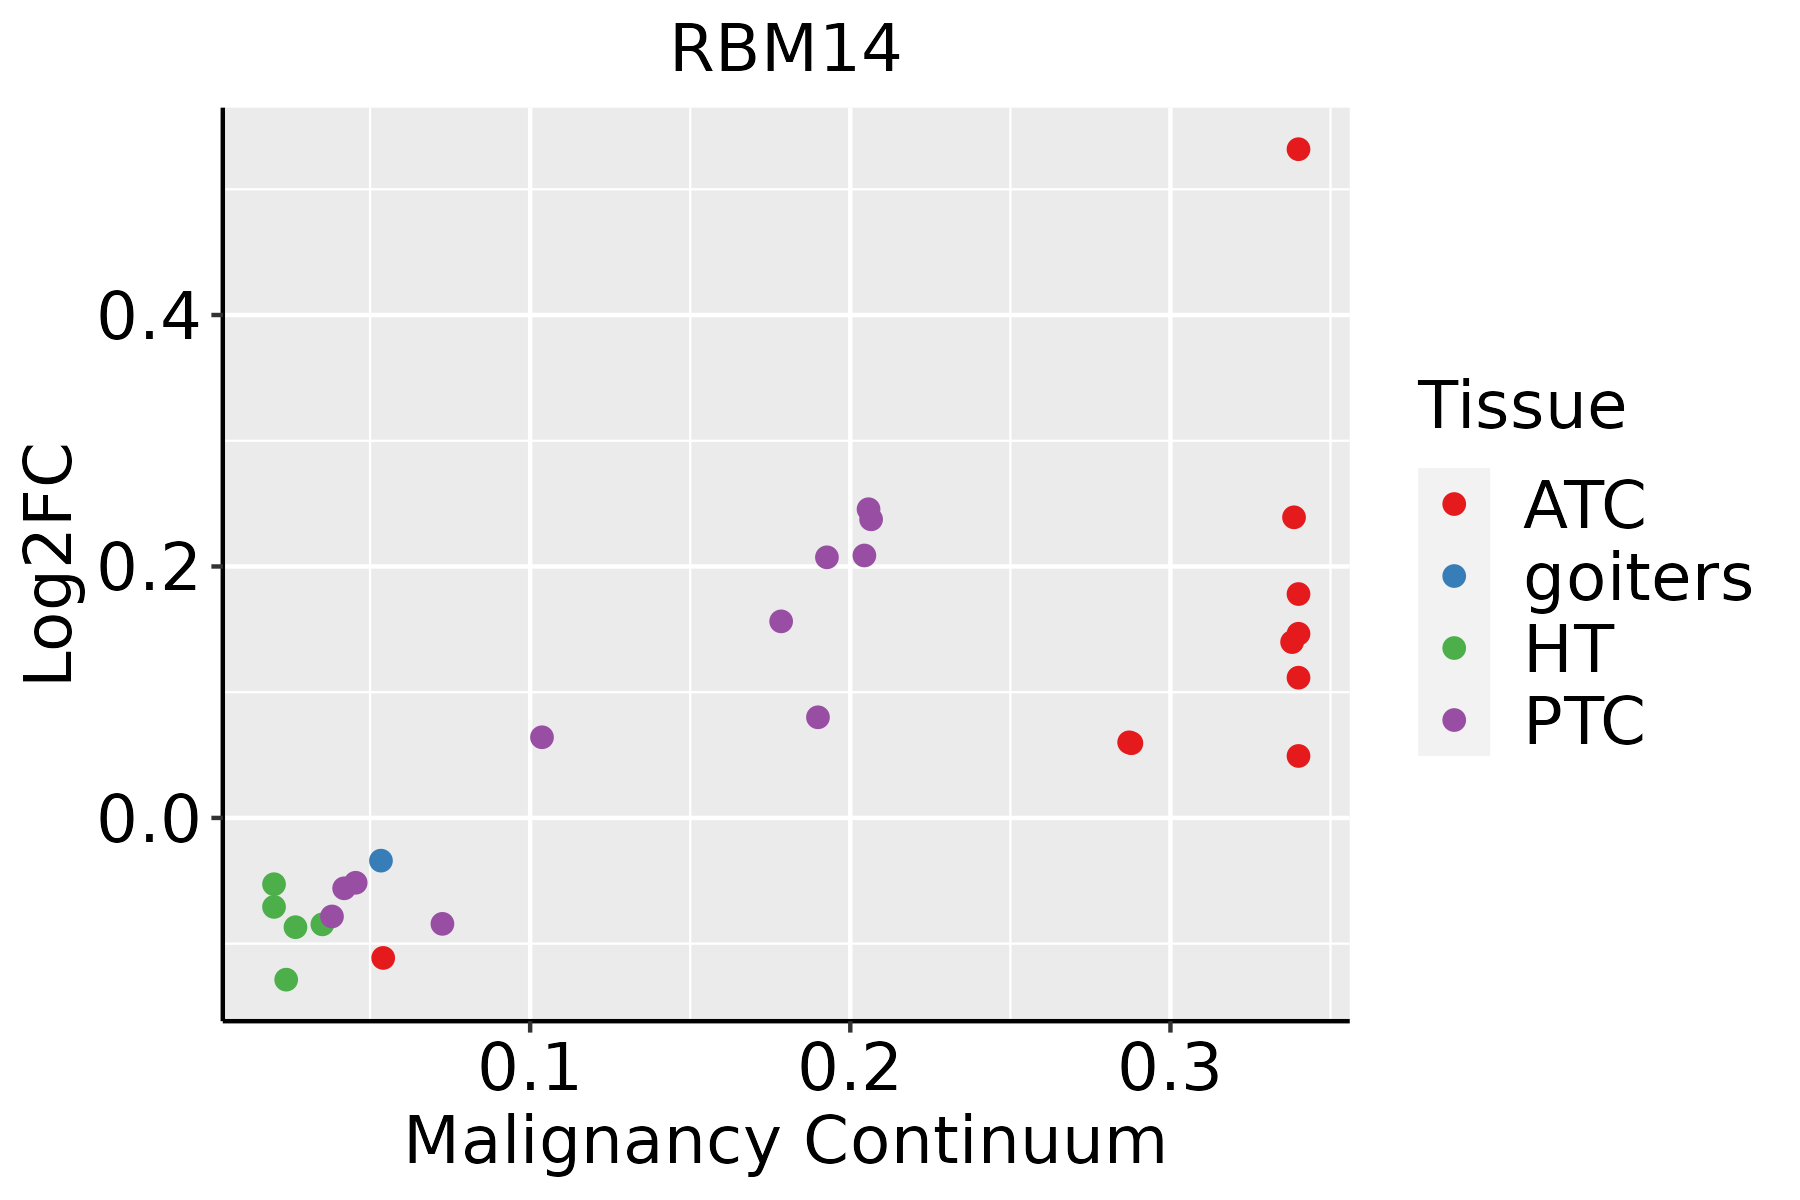
ATC: Anaplastic thyroid cancer
HT: Hashimoto's thyroiditis
PTC: Papillary thyroid cancer
∗log2FC in expression of this searched gene in stem-like cells from each diseased tissue sample relative to stem-like cells in normal samples in each tissue plotted against the malignancy continuum. Samples are colored based on if they are from different disease stage.

Top

Malignant transformation related pathway analysis

check buttonFind out the enriched GO biological processes and KEGG pathways involved in transition from healthy to precancer to cancer
check button Figure of enriched GO biological processes.
TissueDisease StageEnriched GO biological Processes
ColorectumADGO analysis - Figure of enriched GO biological processes: Top 15 enriched GO BP terms are showed in the bar plot of each disease state in each tissue. Each row represents a significant GO biological process which is colored according to the -log10(p.adjust).
ColorectumSERGO analysis - Figure of enriched GO biological processes: Top 15 enriched GO BP terms are showed in the bar plot of each disease state in each tissue. Each row represents a significant GO biological process which is colored according to the -log10(p.adjust).
ColorectumMSSGO analysis - Figure of enriched GO biological processes: Top 15 enriched GO BP terms are showed in the bar plot of each disease state in each tissue. Each row represents a significant GO biological process which is colored according to the -log10(p.adjust).
ColorectumMSI-HGO analysis - Figure of enriched GO biological processes: Top 15 enriched GO BP terms are showed in the bar plot of each disease state in each tissue. Each row represents a significant GO biological process which is colored according to the -log10(p.adjust).
ColorectumFAPGO analysis - Figure of enriched GO biological processes: Top 15 enriched GO BP terms are showed in the bar plot of each disease state in each tissue. Each row represents a significant GO biological process which is colored according to the -log10(p.adjust).
∗Top 15 enriched GO BP terms are showed in the bar plot of each disease state in each tissue. Each row represents a significant GO biological process which is colored according to the -log10(p.adjust).
Page: 1 2 3 4 5 6 7 8 9 

check button Enriched GO biological processes.
GO IDTissueDisease StageDescriptionGene RatioBg Ratiopvaluep.adjustCount
GO:0008380ColorectumADRNA splicing169/3918434/187233.59e-182.04e-15169
GO:0000377ColorectumADRNA splicing, via transesterification reactions with bulged adenosine as nucleophile130/3918320/187235.88e-162.16e-13130
GO:0000398ColorectumADmRNA splicing, via spliceosome130/3918320/187235.88e-162.16e-13130
GO:0000375ColorectumADRNA splicing, via transesterification reactions131/3918324/187237.11e-162.22e-13131
GO:0010639ColorectumADnegative regulation of organelle organization114/3918348/187231.41e-076.49e-06114
GO:0051494ColorectumADnegative regulation of cytoskeleton organization58/3918163/187231.04e-052.40e-0458
GO:0007178ColorectumADtransmembrane receptor protein serine/threonine kinase signaling pathway99/3918355/187239.92e-049.28e-0399
GO:0060395ColorectumADSMAD protein signal transduction28/391882/187233.73e-032.63e-0228
GO:0046605ColorectumADregulation of centrosome cycle18/391849/187237.93e-034.73e-0218
GO:00083801ColorectumSERRNA splicing123/2897434/187233.84e-128.41e-10123
GO:00003751ColorectumSERRNA splicing, via transesterification reactions90/2897324/187238.68e-097.50e-0790
GO:00003771ColorectumSERRNA splicing, via transesterification reactions with bulged adenosine as nucleophile89/2897320/187239.82e-098.14e-0789
GO:00003981ColorectumSERmRNA splicing, via spliceosome89/2897320/187239.82e-098.14e-0789
GO:00106391ColorectumSERnegative regulation of organelle organization90/2897348/187233.14e-071.69e-0590
GO:00514941ColorectumSERnegative regulation of cytoskeleton organization48/2897163/187234.34e-061.63e-0448
GO:00466051ColorectumSERregulation of centrosome cycle17/289749/187237.17e-049.44e-0317
GO:0010824ColorectumSERregulation of centrosome duplication15/289745/187232.29e-032.19e-0215
GO:00083802ColorectumMSSRNA splicing159/3467434/187231.75e-191.22e-16159
GO:00003772ColorectumMSSRNA splicing, via transesterification reactions with bulged adenosine as nucleophile121/3467320/187232.52e-168.27e-14121
GO:00003982ColorectumMSSmRNA splicing, via spliceosome121/3467320/187232.52e-168.27e-14121
Page: 1 2 3 4 5 6 7 8 

check button Enriched KEGG pathways.
Pathway IDTissueDisease StageDescriptionGene RatioBg Ratiopvaluep.adjustqvalueCount
Page: 1 

Top

Cell-cell communication analysis

check buttonIdentification of potential cell-cell interactions between two cell types and their ligand-receptor pairs for different disease states
LigandReceptorLRpairPathwayTissueDisease Stage
Page: 1 

Top

Single-cell gene regulatory network inference analysis

check buttonFind out the significant the regulons (TFs) and the target genes of each regulon across cell types for different disease states
TFCell TypeTissueDisease StageTarget GeneRSSRegulon Activity
∗The dot plots of a searched regulon are shown for all cell subpopulations in each disease state of each tissue based on the regulon specific score inferred using pySCENIC and by calculating the average expression.
Page: 1 

Top

Somatic mutation of malignant transformation related genes

check buttonAnnotation of somatic variants for genes involved in malignant transformation
Hugo SymbolVariant ClassVariant ClassificationdbSNP RSHGVScHGVSpHGVSp ShortSWISSPROTBIOTYPESIFTPolyPhenTumor Sample BarcodeTissueHistologySexAgeStageTherapy TypesDrugsOutcome
RBM14SNVMissense_Mutationc.545N>Gp.Ser182Cysp.S182CQ96PK6protein_codingdeleterious(0.01)probably_damaging(0.925)TCGA-A8-A095-01Breastbreast invasive carcinomaFemale<65I/IIChemotherapy5-fluorouracilCR
RBM14SNVMissense_Mutationc.674N>Gp.Ser225Cysp.S225CQ96PK6protein_codingdeleterious_low_confidence(0)possibly_damaging(0.89)TCGA-A8-A095-01Breastbreast invasive carcinomaFemale<65I/IIChemotherapy5-fluorouracilCR
RBM14SNVMissense_Mutationc.1754N>Ap.Arg585Glnp.R585QQ96PK6protein_codingtolerated(0.1)benign(0.003)TCGA-AR-A24V-01Breastbreast invasive carcinomaFemale<65I/IIChemotherapydoxorubicinSD
RBM14SNVMissense_Mutationrs764529837c.1220N>Tp.Ser407Leup.S407LQ96PK6protein_codingdeleterious(0.01)benign(0.019)TCGA-D8-A27G-01Breastbreast invasive carcinomaFemale>=65I/IIUnknownUnknownSD
RBM14SNVMissense_Mutationc.592T>Cp.Phe198Leup.F198LQ96PK6protein_codingdeleterious(0.01)benign(0.001)TCGA-E2-A14R-01Breastbreast invasive carcinomaFemale<65I/IIChemotherapydoxorubicinPD
RBM14SNVMissense_Mutationrs773352601c.938C>Tp.Ser313Leup.S313LQ96PK6protein_codingtolerated(0.22)possibly_damaging(0.885)TCGA-C5-A7UH-01Cervixcervical & endocervical cancerFemale<65III/IVChemotherapycisplatinSD
RBM14SNVMissense_Mutationc.1436C>Tp.Ser479Leup.S479LQ96PK6protein_codingdeleterious(0.02)benign(0.018)TCGA-C5-A7UH-01Cervixcervical & endocervical cancerFemale<65III/IVChemotherapycisplatinSD
RBM14SNVMissense_Mutationnovelc.280N>Ap.Glu94Lysp.E94KQ96PK6protein_codingdeleterious(0.03)probably_damaging(0.93)TCGA-C5-A8XH-01Cervixcervical & endocervical cancerFemale<65I/IIUnknownUnknownSD
RBM14insertionIn_Frame_Insnovelc.414_434dupGGGCAAGCGCATCAACGTGGAp.Gly139_Glu145dupp.G139_E145dupQ96PK6protein_codingTCGA-Q1-A6DW-01Cervixcervical & endocervical cancerFemale<65I/IIChemotherapycisplatinSD
RBM14SNVMissense_Mutationrs751672990c.608N>Ap.Arg203Hisp.R203HQ96PK6protein_codingdeleterious(0)benign(0.049)TCGA-5M-AAT6-01Colorectumcolon adenocarcinomaFemale<65III/IVUnknownUnknownPD
Page: 1 2 3 4 5 6 7 

Top

Related drugs of malignant transformation related genes

check buttonIdentification of chemicals and drugs interact with genes involved in malignant transfromation
(DGIdb 4.0)
Entrez IDSymbolCategoryInteraction TypesDrug Claim NameDrug NamePMIDs
Page: 1