
|
|||||
|
 | |
| |
| |
| |
| |
| |
|
Gene: RBM12B |
Gene summary for RBM12B |
| Gene information | Species | Human | Gene symbol | RBM12B | Gene ID | 389677 |
| Gene name | RNA binding motif protein 12B | |
| Gene Alias | MGC:33837 | |
| Cytomap | 8q22.1 | |
| Gene Type | protein-coding | GO ID | GO:0006139 | UniProtAcc | Q8IXT5 |
Top |
Malignant transformation analysis |
| Identification of the aberrant gene expression in precancerous and cancerous lesions by comparing the gene expression of stem-like cells in diseased tissues with normal stem cells |
| Entrez ID | Symbol | Replicates | Species | Organ | Tissue | Adj P-value | Log2FC | Malignancy |
| 389677 | RBM12B | HCC1_Meng | Human | Liver | HCC | 1.89e-46 | 1.60e-01 | 0.0246 |
| 389677 | RBM12B | HCC2_Meng | Human | Liver | HCC | 4.52e-26 | 2.71e-01 | 0.0107 |
| 389677 | RBM12B | HCC2 | Human | Liver | HCC | 2.30e-04 | 2.02e+00 | 0.5341 |
| 389677 | RBM12B | Pt14.a | Human | Liver | HCC | 1.89e-03 | 3.36e-01 | 0.0169 |
| 389677 | RBM12B | S014 | Human | Liver | HCC | 1.06e-04 | 2.80e-01 | 0.2254 |
| 389677 | RBM12B | S015 | Human | Liver | HCC | 1.22e-06 | 4.14e-01 | 0.2375 |
| 389677 | RBM12B | S016 | Human | Liver | HCC | 6.02e-15 | 4.27e-01 | 0.2243 |
| 389677 | RBM12B | S027 | Human | Liver | HCC | 8.09e-03 | 4.50e-01 | 0.2446 |
| 389677 | RBM12B | S028 | Human | Liver | HCC | 1.68e-14 | 5.62e-01 | 0.2503 |
| 389677 | RBM12B | S029 | Human | Liver | HCC | 1.11e-03 | 3.12e-01 | 0.2581 |
| 389677 | RBM12B | male-WTA | Human | Thyroid | PTC | 2.20e-15 | 1.35e-01 | 0.1037 |
| 389677 | RBM12B | PTC01 | Human | Thyroid | PTC | 1.53e-10 | 9.55e-02 | 0.1899 |
| 389677 | RBM12B | PTC04 | Human | Thyroid | PTC | 7.87e-11 | 2.60e-01 | 0.1927 |
| 389677 | RBM12B | PTC05 | Human | Thyroid | PTC | 3.09e-17 | 5.51e-01 | 0.2065 |
| 389677 | RBM12B | PTC06 | Human | Thyroid | PTC | 2.04e-22 | 5.80e-01 | 0.2057 |
| 389677 | RBM12B | PTC07 | Human | Thyroid | PTC | 4.08e-24 | 3.93e-01 | 0.2044 |
| 389677 | RBM12B | ATC12 | Human | Thyroid | ATC | 3.94e-13 | 1.29e-01 | 0.34 |
| 389677 | RBM12B | ATC13 | Human | Thyroid | ATC | 5.76e-41 | 6.26e-01 | 0.34 |
| 389677 | RBM12B | ATC2 | Human | Thyroid | ATC | 4.32e-08 | 7.29e-01 | 0.34 |
| 389677 | RBM12B | ATC4 | Human | Thyroid | ATC | 4.23e-11 | 1.72e-01 | 0.34 |
| Page: 1 2 |
| Tissue | Expression Dynamics | Abbreviation |
| Liver |  | HCC: Hepatocellular carcinoma |
| NAFLD: Non-alcoholic fatty liver disease | ||
| Thyroid | 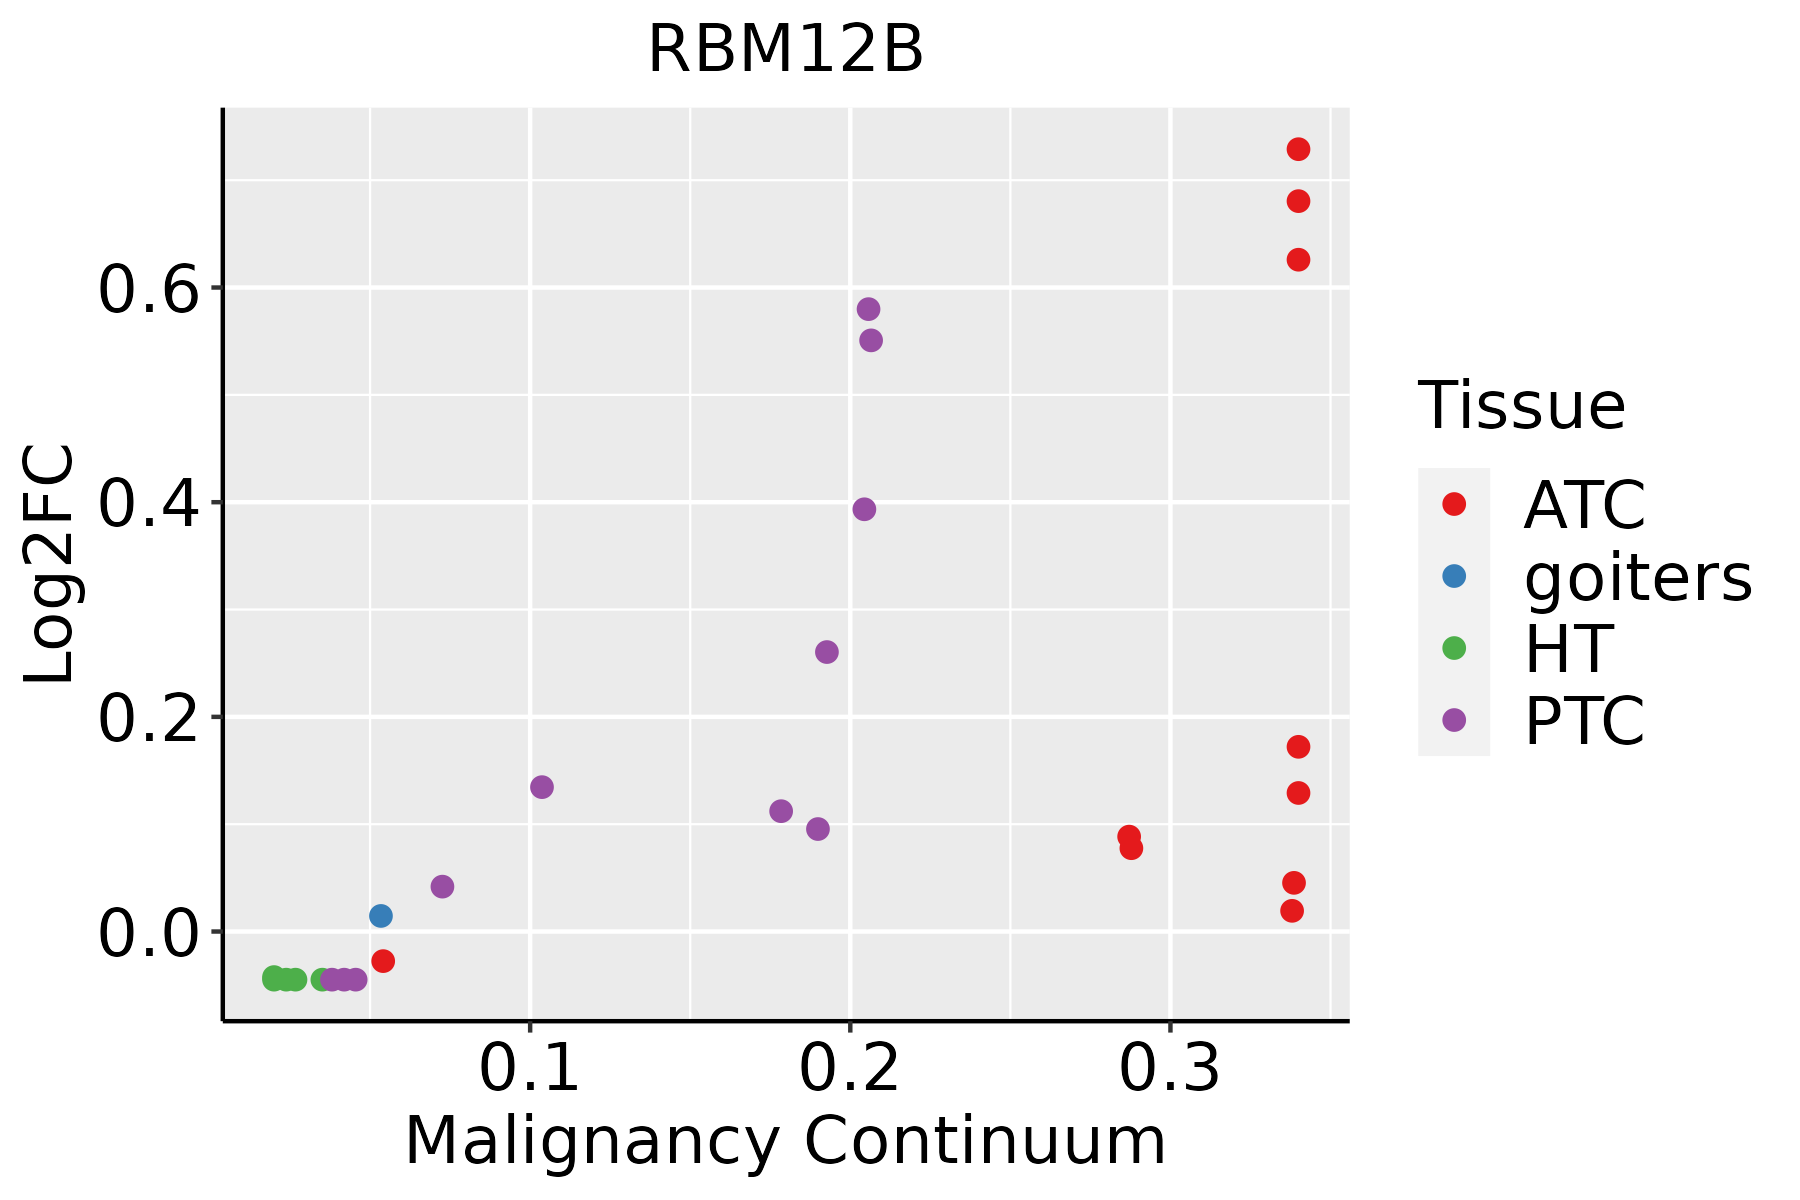 | ATC: Anaplastic thyroid cancer |
| HT: Hashimoto's thyroiditis | ||
| PTC: Papillary thyroid cancer |
| ∗log2FC in expression of this searched gene in stem-like cells from each diseased tissue sample relative to stem-like cells in normal samples in each tissue plotted against the malignancy continuum. Samples are colored based on if they are from different disease stage. |
Top |
Malignant transformation related pathway analysis |
| Find out the enriched GO biological processes and KEGG pathways involved in transition from healthy to precancer to cancer |
| Tissue | Disease Stage | Enriched GO biological Processes |
| Colorectum | AD |  |
| Colorectum | SER |  |
| Colorectum | MSS |  |
| Colorectum | MSI-H |  |
| Colorectum | FAP |  |
| ∗Top 15 enriched GO BP terms are showed in the bar plot of each disease state in each tissue. Each row represents a significant GO biological process which is colored according to the -log10(p.adjust). |
| Page: 1 2 3 4 5 6 7 8 9 |
| GO ID | Tissue | Disease Stage | Description | Gene Ratio | Bg Ratio | pvalue | p.adjust | Count |
| GO:000838022 | Liver | HCC | RNA splicing | 313/7958 | 434/18723 | 1.36e-36 | 1.73e-33 | 313 |
| GO:004348422 | Liver | HCC | regulation of RNA splicing | 113/7958 | 148/18723 | 4.32e-17 | 4.15e-15 | 113 |
| GO:0008380113 | Thyroid | PTC | RNA splicing | 273/5968 | 434/18723 | 4.44e-41 | 1.40e-37 | 273 |
| GO:0043484113 | Thyroid | PTC | regulation of RNA splicing | 102/5968 | 148/18723 | 2.03e-20 | 3.21e-18 | 102 |
| GO:000838034 | Thyroid | ATC | RNA splicing | 270/6293 | 434/18723 | 7.50e-35 | 1.19e-31 | 270 |
| GO:004348435 | Thyroid | ATC | regulation of RNA splicing | 100/6293 | 148/18723 | 2.75e-17 | 2.72e-15 | 100 |
| Page: 1 |
| Pathway ID | Tissue | Disease Stage | Description | Gene Ratio | Bg Ratio | pvalue | p.adjust | qvalue | Count |
| Page: 1 |
Top |
Cell-cell communication analysis |
| Identification of potential cell-cell interactions between two cell types and their ligand-receptor pairs for different disease states |
| Ligand | Receptor | LRpair | Pathway | Tissue | Disease Stage |
| Page: 1 |
Top |
Single-cell gene regulatory network inference analysis |
| Find out the significant the regulons (TFs) and the target genes of each regulon across cell types for different disease states |
| TF | Cell Type | Tissue | Disease Stage | Target Gene | RSS | Regulon Activity |
| ∗The dot plots of a searched regulon are shown for all cell subpopulations in each disease state of each tissue based on the regulon specific score inferred using pySCENIC and by calculating the average expression. |
| Page: 1 |
Top |
Somatic mutation of malignant transformation related genes |
| Annotation of somatic variants for genes involved in malignant transformation |
| Hugo Symbol | Variant Class | Variant Classification | dbSNP RS | HGVSc | HGVSp | HGVSp Short | SWISSPROT | BIOTYPE | SIFT | PolyPhen | Tumor Sample Barcode | Tissue | Histology | Sex | Age | Stage | Therapy Types | Drugs | Outcome |
| RBM12B | SNV | Missense_Mutation | novel | c.2285N>C | p.His762Pro | p.H762P | Q8IXT5 | protein_coding | tolerated_low_confidence(0.13) | benign(0) | TCGA-A8-A06T-01 | Breast | breast invasive carcinoma | Female | >=65 | III/IV | Hormone Therapy | anastrozole | SD |
| RBM12B | SNV | Missense_Mutation | novel | c.2657N>C | p.Val886Ala | p.V886A | Q8IXT5 | protein_coding | tolerated(0.13) | benign(0) | TCGA-AN-A046-01 | Breast | breast invasive carcinoma | Female | >=65 | I/II | Unknown | Unknown | SD |
| RBM12B | SNV | Missense_Mutation | novel | c.415N>T | p.His139Tyr | p.H139Y | Q8IXT5 | protein_coding | tolerated(0.79) | benign(0) | TCGA-2W-A8YY-01 | Cervix | cervical & endocervical cancer | Female | <65 | I/II | Chemotherapy | cisplatin | CR |
| RBM12B | SNV | Missense_Mutation | rs371306525 | c.2867C>T | p.Ser956Leu | p.S956L | Q8IXT5 | protein_coding | deleterious(0.04) | probably_damaging(0.922) | TCGA-MY-A5BE-01 | Cervix | cervical & endocervical cancer | Female | <65 | I/II | Unknown | Unknown | SD |
| RBM12B | SNV | Missense_Mutation | rs745848080 | c.2197N>T | p.Arg733Trp | p.R733W | Q8IXT5 | protein_coding | deleterious_low_confidence(0) | probably_damaging(0.924) | TCGA-5M-AAT6-01 | Colorectum | colon adenocarcinoma | Female | <65 | III/IV | Unknown | Unknown | PD |
| RBM12B | SNV | Missense_Mutation | rs373301535 | c.1909N>T | p.Arg637Trp | p.R637W | Q8IXT5 | protein_coding | deleterious_low_confidence(0.01) | probably_damaging(0.937) | TCGA-AA-3492-01 | Colorectum | colon adenocarcinoma | Female | >=65 | I/II | Unknown | Unknown | SD |
| RBM12B | SNV | Missense_Mutation | c.1363N>G | p.Met455Val | p.M455V | Q8IXT5 | protein_coding | tolerated(0.31) | benign(0) | TCGA-AA-3663-01 | Colorectum | colon adenocarcinoma | Male | <65 | I/II | Unknown | Unknown | SD | |
| RBM12B | SNV | Missense_Mutation | rs774533933 | c.2176N>A | p.Pro726Thr | p.P726T | Q8IXT5 | protein_coding | tolerated_low_confidence(0.15) | benign(0.034) | TCGA-AA-3715-01 | Colorectum | colon adenocarcinoma | Male | >=65 | I/II | Unknown | Unknown | PD |
| RBM12B | SNV | Missense_Mutation | novel | c.1216N>C | p.Asn406His | p.N406H | Q8IXT5 | protein_coding | deleterious(0) | probably_damaging(0.999) | TCGA-AA-3984-01 | Colorectum | colon adenocarcinoma | Female | <65 | I/II | Unknown | Unknown | SD |
| RBM12B | SNV | Missense_Mutation | rs373712480 | c.2669G>A | p.Arg890His | p.R890H | Q8IXT5 | protein_coding | tolerated(0.06) | benign(0.01) | TCGA-AA-A010-01 | Colorectum | colon adenocarcinoma | Female | <65 | I/II | Chemotherapy | folinic | CR |
| Page: 1 2 3 4 5 6 7 8 9 10 11 |
Top |
Related drugs of malignant transformation related genes |
| Identification of chemicals and drugs interact with genes involved in malignant transfromation |
| (DGIdb 4.0) |
| Entrez ID | Symbol | Category | Interaction Types | Drug Claim Name | Drug Name | PMIDs |
| Page: 1 |

Copyright 2023-Present -The University of Texas Health Science Center at Houston |