
|
|||||
|
 | |
| |
| |
| |
| |
| |
|
Gene: RBM12 |
Gene summary for RBM12 |
| Gene information | Species | Human | Gene symbol | RBM12 | Gene ID | 10137 |
| Gene name | RNA binding motif protein 12 | |
| Gene Alias | HRIHFB2091 | |
| Cytomap | 20q11.22 | |
| Gene Type | protein-coding | GO ID | GO:0006139 | UniProtAcc | Q9NTZ6 |
Top |
Malignant transformation analysis |
| Identification of the aberrant gene expression in precancerous and cancerous lesions by comparing the gene expression of stem-like cells in diseased tissues with normal stem cells |
| Entrez ID | Symbol | Replicates | Species | Organ | Tissue | Adj P-value | Log2FC | Malignancy |
| 10137 | RBM12 | HCC1_Meng | Human | Liver | HCC | 4.28e-49 | 7.55e-02 | 0.0246 |
| 10137 | RBM12 | HCC2_Meng | Human | Liver | HCC | 2.42e-20 | 1.18e-01 | 0.0107 |
| 10137 | RBM12 | HCC1 | Human | Liver | HCC | 1.20e-04 | 2.68e+00 | 0.5336 |
| 10137 | RBM12 | HCC2 | Human | Liver | HCC | 9.25e-06 | 2.48e+00 | 0.5341 |
| 10137 | RBM12 | S014 | Human | Liver | HCC | 5.68e-15 | 6.05e-01 | 0.2254 |
| 10137 | RBM12 | S015 | Human | Liver | HCC | 2.90e-10 | 5.61e-01 | 0.2375 |
| 10137 | RBM12 | S016 | Human | Liver | HCC | 4.20e-15 | 5.07e-01 | 0.2243 |
| 10137 | RBM12 | S027 | Human | Liver | HCC | 1.27e-05 | 6.79e-01 | 0.2446 |
| 10137 | RBM12 | S028 | Human | Liver | HCC | 3.93e-14 | 6.44e-01 | 0.2503 |
| 10137 | RBM12 | S029 | Human | Liver | HCC | 2.99e-11 | 5.69e-01 | 0.2581 |
| 10137 | RBM12 | C04 | Human | Oral cavity | OSCC | 1.62e-03 | 4.35e-01 | 0.2633 |
| 10137 | RBM12 | C21 | Human | Oral cavity | OSCC | 7.53e-10 | 4.95e-01 | 0.2678 |
| 10137 | RBM12 | C30 | Human | Oral cavity | OSCC | 1.76e-21 | 9.42e-01 | 0.3055 |
| 10137 | RBM12 | C38 | Human | Oral cavity | OSCC | 1.27e-04 | 6.79e-01 | 0.172 |
| 10137 | RBM12 | C46 | Human | Oral cavity | OSCC | 1.88e-04 | 9.83e-02 | 0.1673 |
| 10137 | RBM12 | C57 | Human | Oral cavity | OSCC | 1.74e-06 | 3.37e-01 | 0.1679 |
| 10137 | RBM12 | C08 | Human | Oral cavity | OSCC | 1.89e-07 | 1.67e-01 | 0.1919 |
| 10137 | RBM12 | SYSMH1 | Human | Oral cavity | OSCC | 5.07e-03 | 1.90e-01 | 0.1127 |
| 10137 | RBM12 | SYSMH3 | Human | Oral cavity | OSCC | 7.44e-11 | 3.27e-01 | 0.2442 |
| 10137 | RBM12 | GSM5252132_BPH389PrGF | Human | Prostate | BPH | 5.22e-03 | 2.83e-01 | -0.2247 |
| Page: 1 2 |
| Tissue | Expression Dynamics | Abbreviation |
| Liver | 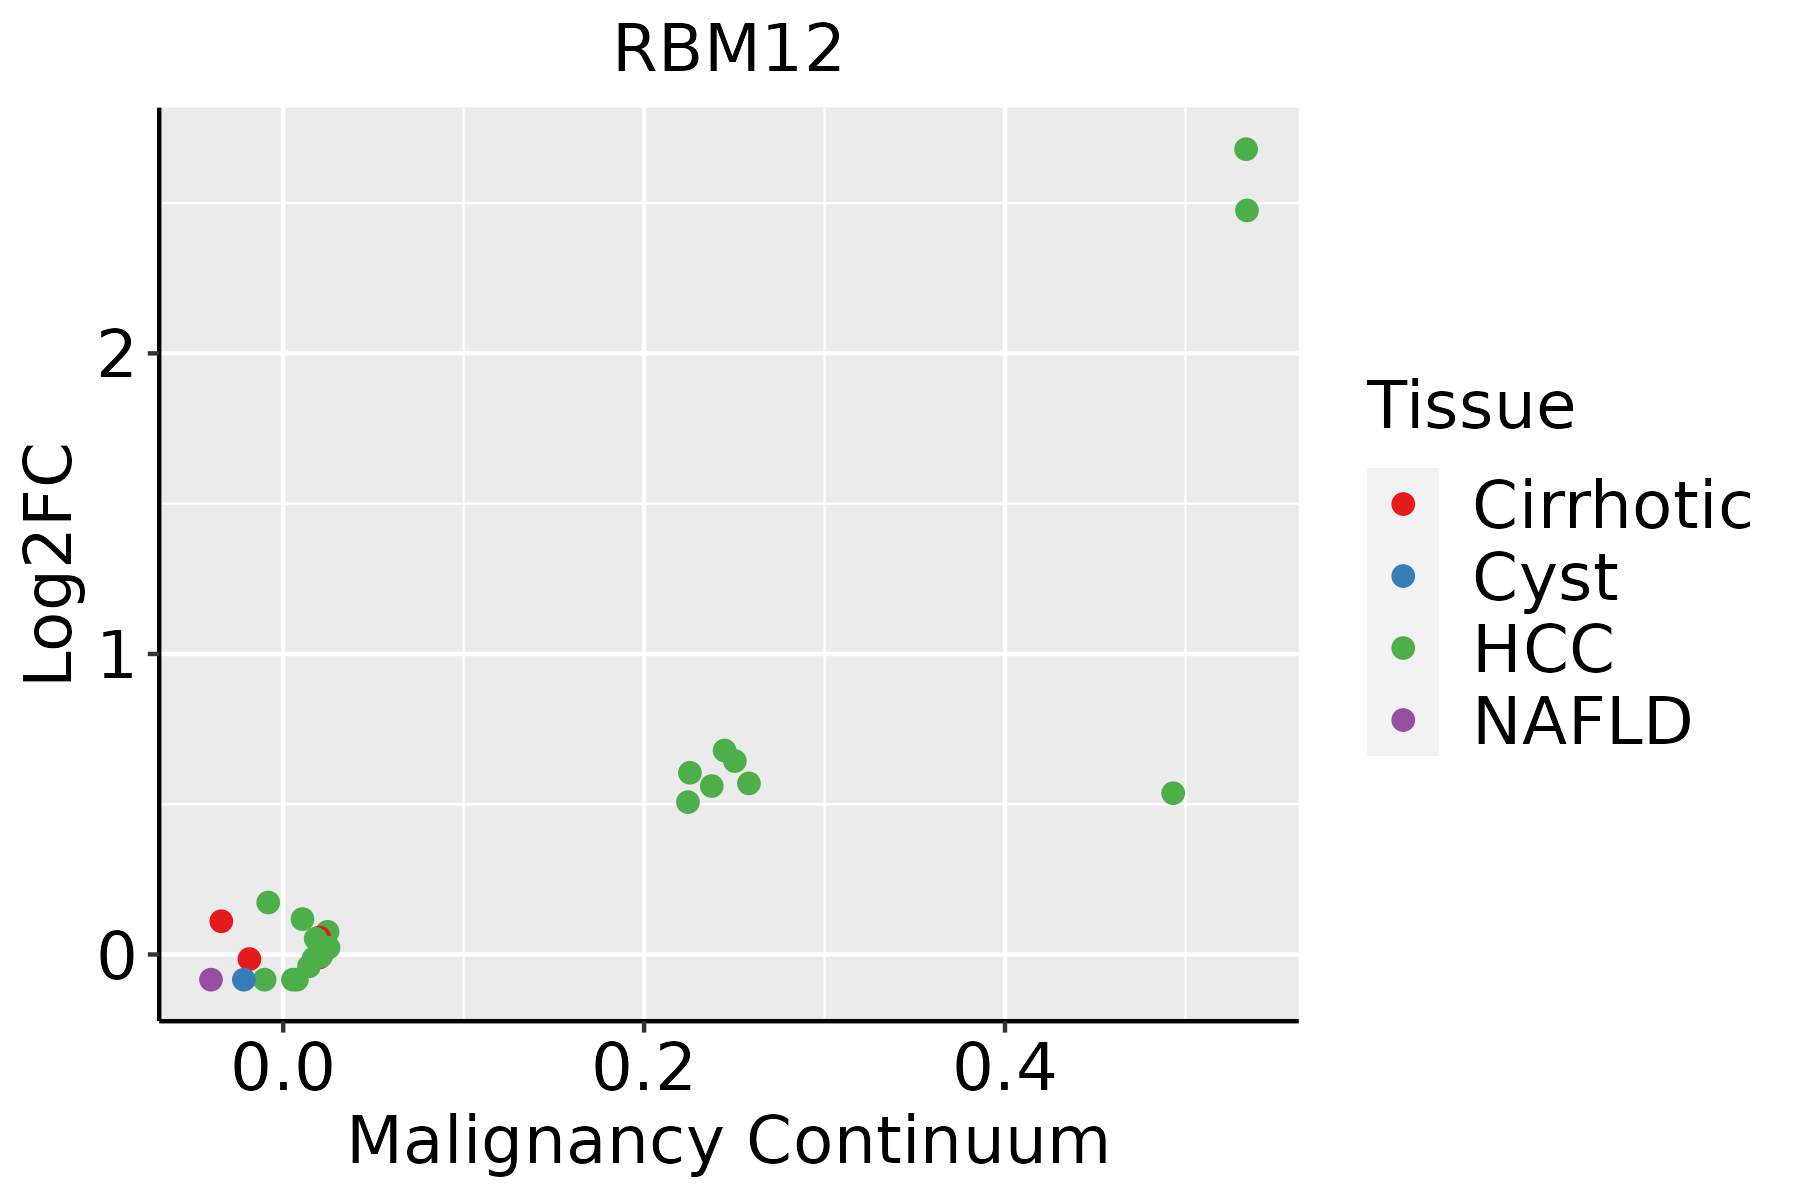 | HCC: Hepatocellular carcinoma |
| NAFLD: Non-alcoholic fatty liver disease | ||
| Oral Cavity |  | EOLP: Erosive Oral lichen planus |
| LP: leukoplakia | ||
| NEOLP: Non-erosive oral lichen planus | ||
| OSCC: Oral squamous cell carcinoma | ||
| Prostate |  | BPH: Benign Prostatic Hyperplasia |
| ∗log2FC in expression of this searched gene in stem-like cells from each diseased tissue sample relative to stem-like cells in normal samples in each tissue plotted against the malignancy continuum. Samples are colored based on if they are from different disease stage. |
Top |
Malignant transformation related pathway analysis |
| Find out the enriched GO biological processes and KEGG pathways involved in transition from healthy to precancer to cancer |
| Tissue | Disease Stage | Enriched GO biological Processes |
| Colorectum | AD |  |
| Colorectum | SER |  |
| Colorectum | MSS |  |
| Colorectum | MSI-H |  |
| Colorectum | FAP |  |
| ∗Top 15 enriched GO BP terms are showed in the bar plot of each disease state in each tissue. Each row represents a significant GO biological process which is colored according to the -log10(p.adjust). |
| Page: 1 2 3 4 5 6 7 8 9 |
| GO ID | Tissue | Disease Stage | Description | Gene Ratio | Bg Ratio | pvalue | p.adjust | Count |
| GO:000838022 | Liver | HCC | RNA splicing | 313/7958 | 434/18723 | 1.36e-36 | 1.73e-33 | 313 |
| GO:004348422 | Liver | HCC | regulation of RNA splicing | 113/7958 | 148/18723 | 4.32e-17 | 4.15e-15 | 113 |
| GO:000838020 | Oral cavity | OSCC | RNA splicing | 308/7305 | 434/18723 | 2.43e-42 | 7.70e-39 | 308 |
| GO:004348420 | Oral cavity | OSCC | regulation of RNA splicing | 108/7305 | 148/18723 | 4.25e-17 | 3.69e-15 | 108 |
| GO:000838018 | Prostate | BPH | RNA splicing | 147/3107 | 434/18723 | 5.17e-19 | 2.29e-16 | 147 |
| GO:004348418 | Prostate | BPH | regulation of RNA splicing | 71/3107 | 148/18723 | 6.14e-19 | 2.53e-16 | 71 |
| GO:000838019 | Prostate | Tumor | RNA splicing | 153/3246 | 434/18723 | 9.15e-20 | 5.79e-17 | 153 |
| GO:004348419 | Prostate | Tumor | regulation of RNA splicing | 70/3246 | 148/18723 | 3.22e-17 | 1.05e-14 | 70 |
| GO:0008380113 | Thyroid | PTC | RNA splicing | 273/5968 | 434/18723 | 4.44e-41 | 1.40e-37 | 273 |
| GO:0043484113 | Thyroid | PTC | regulation of RNA splicing | 102/5968 | 148/18723 | 2.03e-20 | 3.21e-18 | 102 |
| GO:000838034 | Thyroid | ATC | RNA splicing | 270/6293 | 434/18723 | 7.50e-35 | 1.19e-31 | 270 |
| GO:004348435 | Thyroid | ATC | regulation of RNA splicing | 100/6293 | 148/18723 | 2.75e-17 | 2.72e-15 | 100 |
| Page: 1 |
| Pathway ID | Tissue | Disease Stage | Description | Gene Ratio | Bg Ratio | pvalue | p.adjust | qvalue | Count |
| Page: 1 |
Top |
Cell-cell communication analysis |
| Identification of potential cell-cell interactions between two cell types and their ligand-receptor pairs for different disease states |
| Ligand | Receptor | LRpair | Pathway | Tissue | Disease Stage |
| Page: 1 |
Top |
Single-cell gene regulatory network inference analysis |
| Find out the significant the regulons (TFs) and the target genes of each regulon across cell types for different disease states |
| TF | Cell Type | Tissue | Disease Stage | Target Gene | RSS | Regulon Activity |
| ∗The dot plots of a searched regulon are shown for all cell subpopulations in each disease state of each tissue based on the regulon specific score inferred using pySCENIC and by calculating the average expression. |
| Page: 1 |
Top |
Somatic mutation of malignant transformation related genes |
| Annotation of somatic variants for genes involved in malignant transformation |
| Hugo Symbol | Variant Class | Variant Classification | dbSNP RS | HGVSc | HGVSp | HGVSp Short | SWISSPROT | BIOTYPE | SIFT | PolyPhen | Tumor Sample Barcode | Tissue | Histology | Sex | Age | Stage | Therapy Types | Drugs | Outcome |
| RBM12 | SNV | Missense_Mutation | rs199582639 | c.296N>A | p.Pro99Gln | p.P99Q | Q9NTZ6 | protein_coding | deleterious(0.01) | possibly_damaging(0.731) | TCGA-A2-A0CR-01 | Breast | breast invasive carcinoma | Female | <65 | I/II | Chemotherapy | adriamycin | CR |
| RBM12 | SNV | Missense_Mutation | c.2582A>T | p.Gln861Leu | p.Q861L | Q9NTZ6 | protein_coding | tolerated(0.27) | benign(0.38) | TCGA-A8-A09W-01 | Breast | breast invasive carcinoma | Female | >=65 | III/IV | Unknown | Unknown | SD | |
| RBM12 | SNV | Missense_Mutation | c.901N>A | p.Pro301Thr | p.P301T | Q9NTZ6 | protein_coding | tolerated(0.06) | benign(0.007) | TCGA-A8-A09Z-01 | Breast | breast invasive carcinoma | Female | >=65 | I/II | Unknown | Unknown | SD | |
| RBM12 | SNV | Missense_Mutation | novel | c.655N>G | p.Pro219Ala | p.P219A | Q9NTZ6 | protein_coding | deleterious_low_confidence(0.01) | probably_damaging(0.994) | TCGA-AC-A4ZE-01 | Breast | breast invasive carcinoma | Female | <65 | I/II | Unknown | Unknown | SD |
| RBM12 | SNV | Missense_Mutation | c.631N>A | p.Pro211Thr | p.P211T | Q9NTZ6 | protein_coding | deleterious_low_confidence(0.03) | possibly_damaging(0.614) | TCGA-B6-A0RT-01 | Breast | breast invasive carcinoma | Female | <65 | III/IV | Unknown | Unknown | SD | |
| RBM12 | SNV | Missense_Mutation | rs767631496 | c.2170C>T | p.Pro724Ser | p.P724S | Q9NTZ6 | protein_coding | deleterious_low_confidence(0.03) | benign(0.186) | TCGA-BH-A18P-01 | Breast | breast invasive carcinoma | Female | <65 | I/II | Unknown | Unknown | PD |
| RBM12 | SNV | Missense_Mutation | c.1185G>A | p.Met395Ile | p.M395I | Q9NTZ6 | protein_coding | tolerated(0.56) | benign(0) | TCGA-D8-A1XZ-01 | Breast | breast invasive carcinoma | Female | >=65 | III/IV | Hormone Therapy | tamoxiphen+anastrozolum | SD | |
| RBM12 | SNV | Missense_Mutation | c.2692G>A | p.Gly898Ser | p.G898S | Q9NTZ6 | protein_coding | deleterious(0.02) | probably_damaging(0.999) | TCGA-E2-A1LH-01 | Breast | breast invasive carcinoma | Female | <65 | I/II | Chemotherapy | adriamycin | SD | |
| RBM12 | insertion | Frame_Shift_Ins | novel | c.2055_2056insTTGAGGGTGA | p.Gly686LeufsTer17 | p.G686Lfs*17 | Q9NTZ6 | protein_coding | TCGA-A8-A06O-01 | Breast | breast invasive carcinoma | Female | <65 | I/II | Hormone Therapy | letrozole | SD | ||
| RBM12 | insertion | Frame_Shift_Ins | novel | c.2053_2054insGGATGAAGAAAATAGAAATGTCAGTAGAACT | p.Ala685GlyfsTer25 | p.A685Gfs*25 | Q9NTZ6 | protein_coding | TCGA-A8-A06O-01 | Breast | breast invasive carcinoma | Female | <65 | I/II | Hormone Therapy | letrozole | SD |
| Page: 1 2 3 4 5 6 7 8 9 |
Top |
Related drugs of malignant transformation related genes |
| Identification of chemicals and drugs interact with genes involved in malignant transfromation |
| (DGIdb 4.0) |
| Entrez ID | Symbol | Category | Interaction Types | Drug Claim Name | Drug Name | PMIDs |
| Page: 1 |

Copyright 2023-Present -The University of Texas Health Science Center at Houston |