
|
|||||
|
 | |
| |
| |
| |
| |
| |
|
Gene: RBM10 |
Gene summary for RBM10 |
| Gene information | Species | Human | Gene symbol | RBM10 | Gene ID | 8241 |
| Gene name | RNA binding motif protein 10 | |
| Gene Alias | DXS8237E | |
| Cytomap | Xp11.3 | |
| Gene Type | protein-coding | GO ID | GO:0000122 | UniProtAcc | P98175 |
Top |
Malignant transformation analysis |
| Identification of the aberrant gene expression in precancerous and cancerous lesions by comparing the gene expression of stem-like cells in diseased tissues with normal stem cells |
| Entrez ID | Symbol | Replicates | Species | Organ | Tissue | Adj P-value | Log2FC | Malignancy |
| 8241 | RBM10 | LZE4T | Human | Esophagus | ESCC | 7.56e-04 | 1.97e-01 | 0.0811 |
| 8241 | RBM10 | LZE5T | Human | Esophagus | ESCC | 1.18e-04 | 1.50e-01 | 0.0514 |
| 8241 | RBM10 | LZE7T | Human | Esophagus | ESCC | 2.56e-14 | 5.17e-01 | 0.0667 |
| 8241 | RBM10 | LZE8T | Human | Esophagus | ESCC | 3.97e-07 | 8.76e-02 | 0.067 |
| 8241 | RBM10 | LZE20T | Human | Esophagus | ESCC | 1.06e-02 | 8.45e-02 | 0.0662 |
| 8241 | RBM10 | LZE24T | Human | Esophagus | ESCC | 2.10e-08 | 1.44e-01 | 0.0596 |
| 8241 | RBM10 | P1T-E | Human | Esophagus | ESCC | 5.14e-11 | 2.63e-01 | 0.0875 |
| 8241 | RBM10 | P2T-E | Human | Esophagus | ESCC | 1.66e-26 | 5.04e-01 | 0.1177 |
| 8241 | RBM10 | P4T-E | Human | Esophagus | ESCC | 1.04e-14 | 3.30e-01 | 0.1323 |
| 8241 | RBM10 | P5T-E | Human | Esophagus | ESCC | 6.31e-15 | 1.50e-01 | 0.1327 |
| 8241 | RBM10 | P8T-E | Human | Esophagus | ESCC | 7.89e-22 | 3.08e-01 | 0.0889 |
| 8241 | RBM10 | P9T-E | Human | Esophagus | ESCC | 1.69e-11 | 8.04e-02 | 0.1131 |
| 8241 | RBM10 | P10T-E | Human | Esophagus | ESCC | 5.28e-23 | 2.59e-01 | 0.116 |
| 8241 | RBM10 | P11T-E | Human | Esophagus | ESCC | 5.37e-12 | 3.13e-01 | 0.1426 |
| 8241 | RBM10 | P12T-E | Human | Esophagus | ESCC | 1.25e-18 | 2.52e-01 | 0.1122 |
| 8241 | RBM10 | P15T-E | Human | Esophagus | ESCC | 3.34e-13 | 2.39e-01 | 0.1149 |
| 8241 | RBM10 | P16T-E | Human | Esophagus | ESCC | 2.80e-25 | 3.68e-01 | 0.1153 |
| 8241 | RBM10 | P17T-E | Human | Esophagus | ESCC | 2.24e-15 | 4.20e-01 | 0.1278 |
| 8241 | RBM10 | P19T-E | Human | Esophagus | ESCC | 2.01e-04 | 2.12e-01 | 0.1662 |
| 8241 | RBM10 | P20T-E | Human | Esophagus | ESCC | 2.21e-21 | 2.45e-01 | 0.1124 |
| Page: 1 2 3 4 5 |
| Tissue | Expression Dynamics | Abbreviation |
| Esophagus | 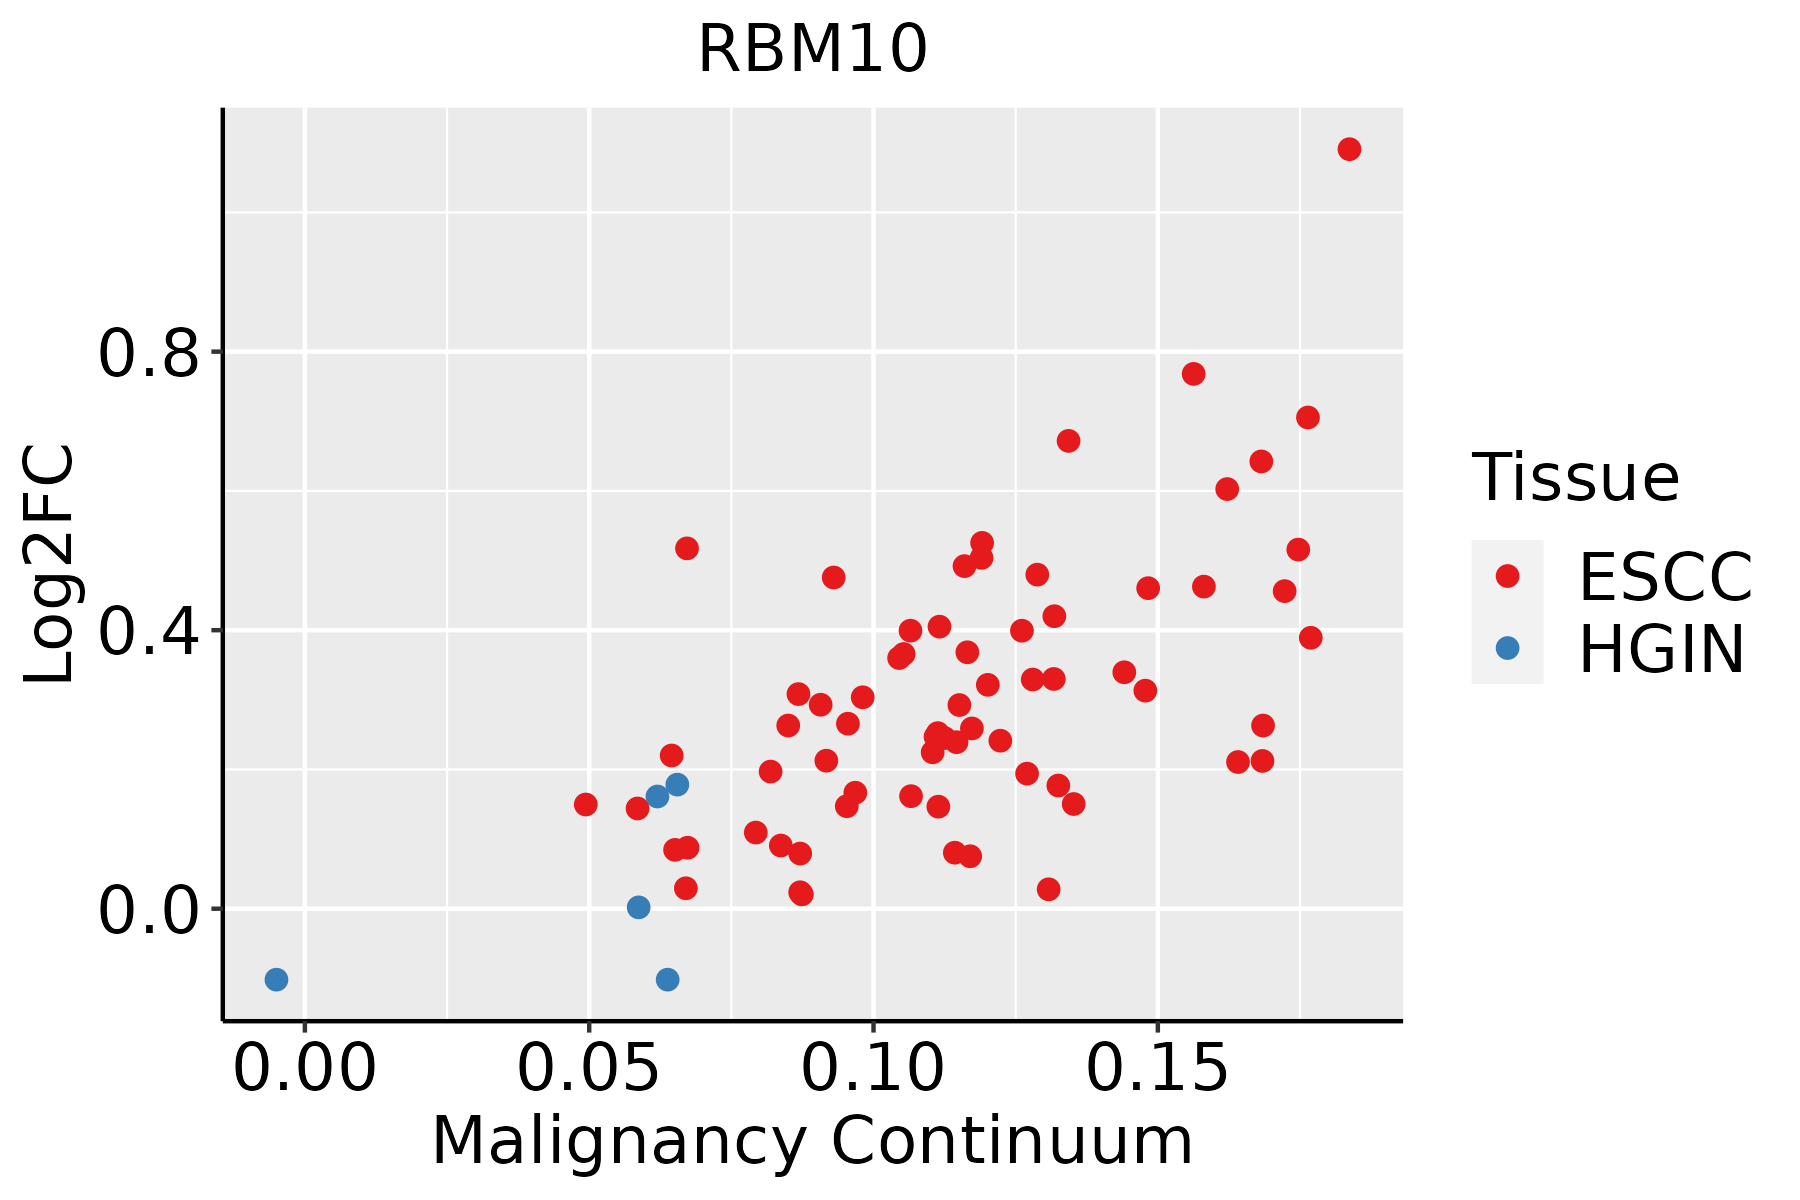 | ESCC: Esophageal squamous cell carcinoma |
| HGIN: High-grade intraepithelial neoplasias | ||
| LGIN: Low-grade intraepithelial neoplasias | ||
| Liver |  | HCC: Hepatocellular carcinoma |
| NAFLD: Non-alcoholic fatty liver disease | ||
| Oral Cavity | 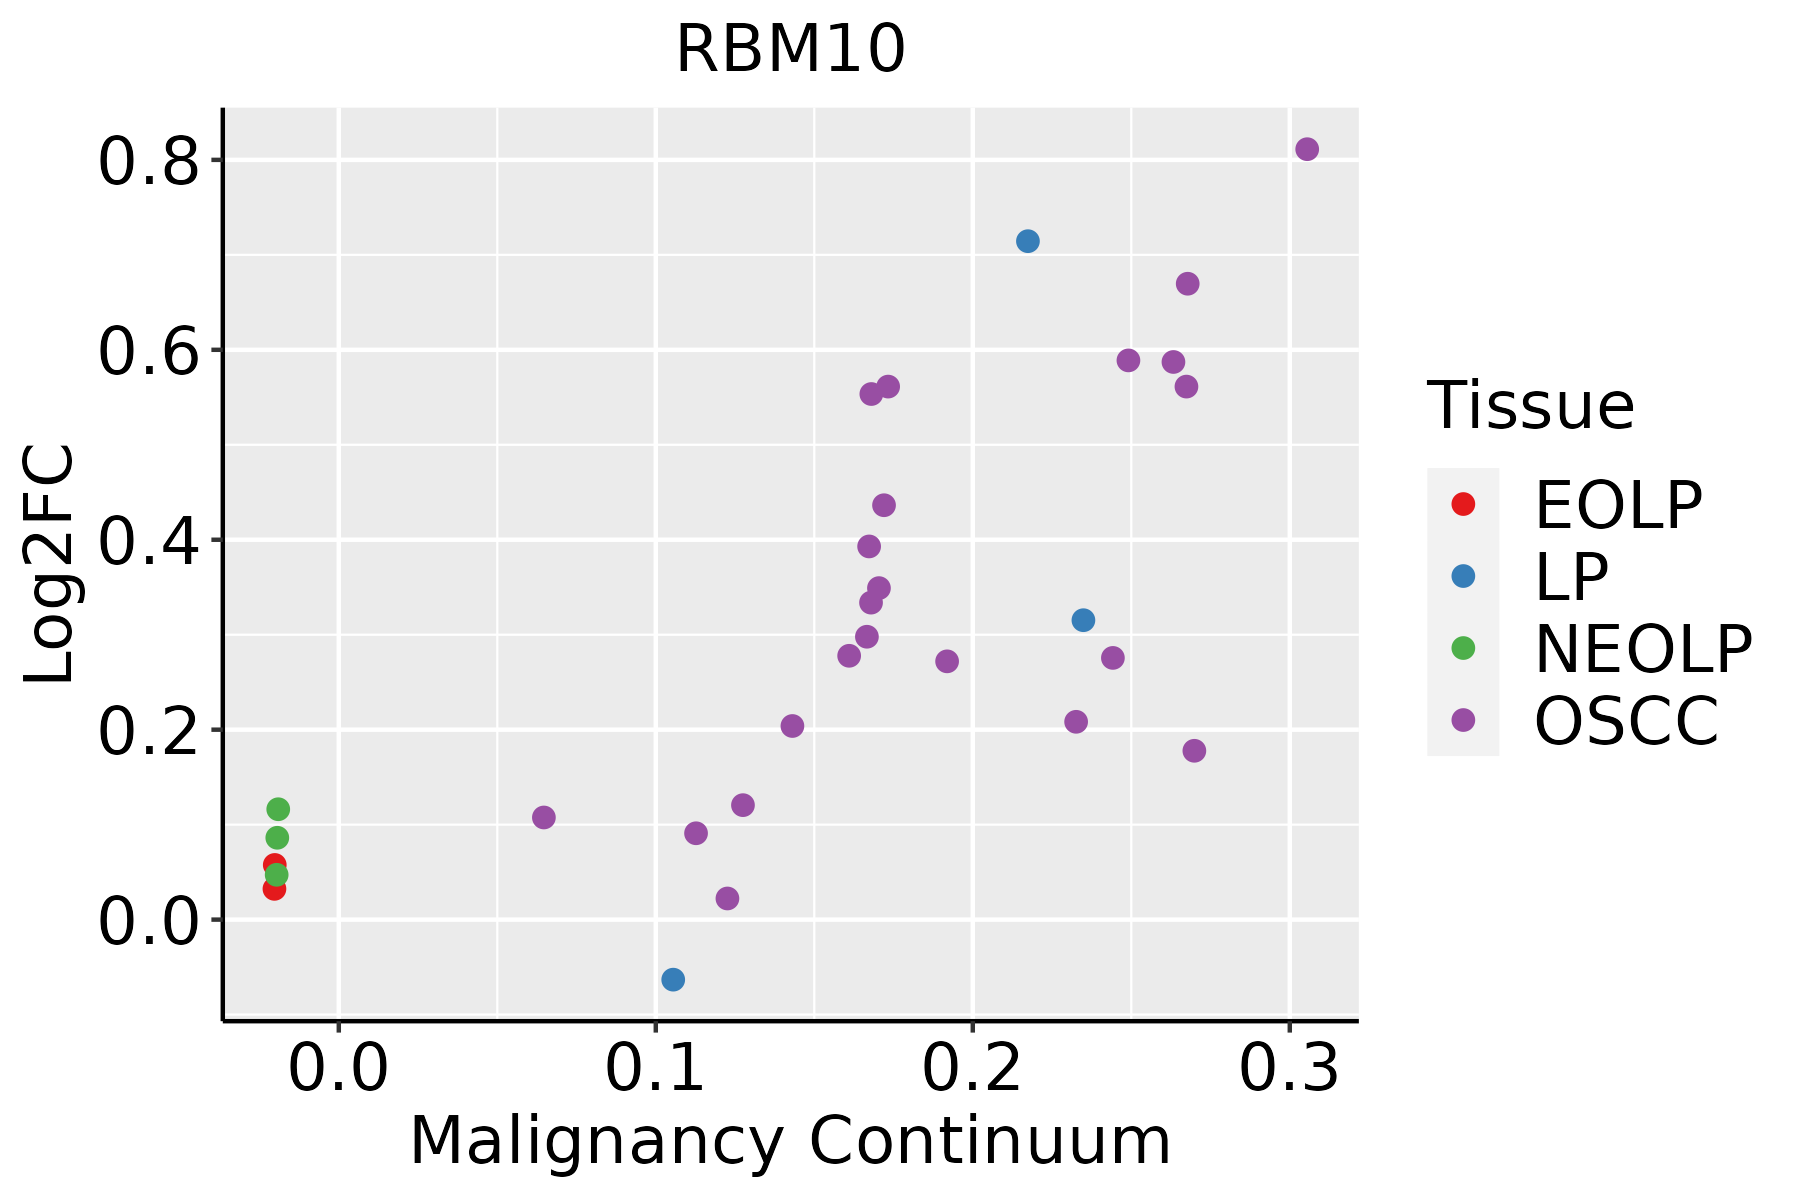 | EOLP: Erosive Oral lichen planus |
| LP: leukoplakia | ||
| NEOLP: Non-erosive oral lichen planus | ||
| OSCC: Oral squamous cell carcinoma |
| ∗log2FC in expression of this searched gene in stem-like cells from each diseased tissue sample relative to stem-like cells in normal samples in each tissue plotted against the malignancy continuum. Samples are colored based on if they are from different disease stage. |
Top |
Malignant transformation related pathway analysis |
| Find out the enriched GO biological processes and KEGG pathways involved in transition from healthy to precancer to cancer |
| Tissue | Disease Stage | Enriched GO biological Processes |
| Colorectum | AD |  |
| Colorectum | SER |  |
| Colorectum | MSS |  |
| Colorectum | MSI-H |  |
| Colorectum | FAP |  |
| ∗Top 15 enriched GO BP terms are showed in the bar plot of each disease state in each tissue. Each row represents a significant GO biological process which is colored according to the -log10(p.adjust). |
| Page: 1 2 3 4 5 6 7 8 9 |
| GO ID | Tissue | Disease Stage | Description | Gene Ratio | Bg Ratio | pvalue | p.adjust | Count |
| GO:0008380111 | Esophagus | ESCC | RNA splicing | 336/8552 | 434/18723 | 1.74e-42 | 3.67e-39 | 336 |
| GO:0000375111 | Esophagus | ESCC | RNA splicing, via transesterification reactions | 248/8552 | 324/18723 | 3.05e-30 | 1.49e-27 | 248 |
| GO:0000377111 | Esophagus | ESCC | RNA splicing, via transesterification reactions with bulged adenosine as nucleophile | 244/8552 | 320/18723 | 2.52e-29 | 1.07e-26 | 244 |
| GO:0000398111 | Esophagus | ESCC | mRNA splicing, via spliceosome | 244/8552 | 320/18723 | 2.52e-29 | 1.07e-26 | 244 |
| GO:1903311110 | Esophagus | ESCC | regulation of mRNA metabolic process | 210/8552 | 288/18723 | 3.25e-21 | 5.56e-19 | 210 |
| GO:0006401110 | Esophagus | ESCC | RNA catabolic process | 204/8552 | 278/18723 | 3.39e-21 | 5.66e-19 | 204 |
| GO:0034655110 | Esophagus | ESCC | nucleobase-containing compound catabolic process | 272/8552 | 407/18723 | 2.92e-18 | 2.90e-16 | 272 |
| GO:0006402110 | Esophagus | ESCC | mRNA catabolic process | 170/8552 | 232/18723 | 8.70e-18 | 8.00e-16 | 170 |
| GO:0043484111 | Esophagus | ESCC | regulation of RNA splicing | 116/8552 | 148/18723 | 3.18e-16 | 2.38e-14 | 116 |
| GO:0050684110 | Esophagus | ESCC | regulation of mRNA processing | 109/8552 | 137/18723 | 3.51e-16 | 2.59e-14 | 109 |
| GO:004670018 | Esophagus | ESCC | heterocycle catabolic process | 286/8552 | 445/18723 | 1.12e-15 | 7.47e-14 | 286 |
| GO:004427019 | Esophagus | ESCC | cellular nitrogen compound catabolic process | 288/8552 | 451/18723 | 3.03e-15 | 1.79e-13 | 288 |
| GO:001943918 | Esophagus | ESCC | aromatic compound catabolic process | 295/8552 | 467/18723 | 1.09e-14 | 5.98e-13 | 295 |
| GO:190136118 | Esophagus | ESCC | organic cyclic compound catabolic process | 307/8552 | 495/18723 | 9.99e-14 | 4.80e-12 | 307 |
| GO:0048024111 | Esophagus | ESCC | regulation of mRNA splicing, via spliceosome | 78/8552 | 101/18723 | 8.72e-11 | 2.66e-09 | 78 |
| GO:0009895111 | Esophagus | ESCC | negative regulation of catabolic process | 201/8552 | 320/18723 | 3.88e-10 | 1.05e-08 | 201 |
| GO:006101319 | Esophagus | ESCC | regulation of mRNA catabolic process | 115/8552 | 166/18723 | 5.90e-10 | 1.49e-08 | 115 |
| GO:004348719 | Esophagus | ESCC | regulation of RNA stability | 117/8552 | 170/18723 | 7.91e-10 | 1.94e-08 | 117 |
| GO:004348819 | Esophagus | ESCC | regulation of mRNA stability | 109/8552 | 158/18723 | 2.40e-09 | 5.35e-08 | 109 |
| GO:0031330111 | Esophagus | ESCC | negative regulation of cellular catabolic process | 166/8552 | 262/18723 | 5.17e-09 | 1.08e-07 | 166 |
| Page: 1 2 3 4 5 6 |
| Pathway ID | Tissue | Disease Stage | Description | Gene Ratio | Bg Ratio | pvalue | p.adjust | qvalue | Count |
| Page: 1 |
Top |
Cell-cell communication analysis |
| Identification of potential cell-cell interactions between two cell types and their ligand-receptor pairs for different disease states |
| Ligand | Receptor | LRpair | Pathway | Tissue | Disease Stage |
| Page: 1 |
Top |
Single-cell gene regulatory network inference analysis |
| Find out the significant the regulons (TFs) and the target genes of each regulon across cell types for different disease states |
| TF | Cell Type | Tissue | Disease Stage | Target Gene | RSS | Regulon Activity |
| ∗The dot plots of a searched regulon are shown for all cell subpopulations in each disease state of each tissue based on the regulon specific score inferred using pySCENIC and by calculating the average expression. |
| Page: 1 |
Top |
Somatic mutation of malignant transformation related genes |
| Annotation of somatic variants for genes involved in malignant transformation |
| Hugo Symbol | Variant Class | Variant Classification | dbSNP RS | HGVSc | HGVSp | HGVSp Short | SWISSPROT | BIOTYPE | SIFT | PolyPhen | Tumor Sample Barcode | Tissue | Histology | Sex | Age | Stage | Therapy Types | Drugs | Outcome |
| RBM10 | SNV | Missense_Mutation | c.1492G>A | p.Val498Ile | p.V498I | protein_coding | tolerated(0.13) | benign(0.059) | TCGA-A2-A0ET-01 | Breast | breast invasive carcinoma | Female | <65 | III/IV | Chemotherapy | cytoxan | SD | ||
| RBM10 | SNV | Missense_Mutation | novel | c.214N>T | p.Gly72Cys | p.G72C | protein_coding | tolerated(0.18) | probably_damaging(0.937) | TCGA-A2-A25A-01 | Breast | breast invasive carcinoma | Female | <65 | I/II | Unspecific | Cytoxan | SD | |
| RBM10 | SNV | Missense_Mutation | novel | c.2336C>G | p.Pro779Arg | p.P779R | protein_coding | tolerated(0.58) | possibly_damaging(0.766) | TCGA-A7-A0DB-01 | Breast | breast invasive carcinoma | Female | <65 | I/II | Hormone Therapy | arimidex | SD | |
| RBM10 | SNV | Missense_Mutation | novel | c.298G>A | p.Asp100Asn | p.D100N | protein_coding | tolerated(0.14) | possibly_damaging(0.765) | TCGA-AN-A046-01 | Breast | breast invasive carcinoma | Female | >=65 | I/II | Unknown | Unknown | SD | |
| RBM10 | SNV | Missense_Mutation | c.2065G>A | p.Asp689Asn | p.D689N | protein_coding | tolerated(0.18) | benign(0.27) | TCGA-AO-A128-01 | Breast | breast invasive carcinoma | Female | <65 | I/II | Chemotherapy | doxorubicin | SD | ||
| RBM10 | SNV | Missense_Mutation | novel | c.716C>T | p.Ala239Val | p.A239V | protein_coding | deleterious(0) | probably_damaging(0.94) | TCGA-BH-A208-01 | Breast | breast invasive carcinoma | Female | <65 | I/II | Unknown | Unknown | SD | |
| RBM10 | SNV | Missense_Mutation | novel | c.1553N>G | p.Ser518Cys | p.S518C | protein_coding | deleterious(0) | possibly_damaging(0.818) | TCGA-C8-A12P-01 | Breast | breast invasive carcinoma | Female | <65 | I/II | Unknown | Unknown | SD | |
| RBM10 | SNV | Missense_Mutation | c.2962N>A | p.Val988Met | p.V988M | protein_coding | tolerated(0.16) | benign(0.097) | TCGA-E9-A1RH-01 | Breast | breast invasive carcinoma | Female | <65 | I/II | Chemotherapy | 5-fluorouracil | SD | ||
| RBM10 | insertion | Frame_Shift_Ins | novel | c.2855_2856insGCACTCCAGCCTGGGCAACAAGAACGAGACTCCTTCTCAAAATATA | p.Ile953HisfsTer107 | p.I953Hfs*107 | protein_coding | TCGA-A2-A04Y-01 | Breast | breast invasive carcinoma | Female | <65 | I/II | Chemotherapy | cytoxan | SD | |||
| RBM10 | insertion | In_Frame_Ins | novel | c.1641_1642insATTGTGCCTGGCATTCTGTGCTGTTTGGTGGGGTTTTTATTG | p.Ala547_Ser548insIleValProGlyIleLeuCysCysLeuValGlyPheLeuLeu | p.A547_S548insIVPGILCCLVGFLL | protein_coding | TCGA-A8-A07R-01 | Breast | breast invasive carcinoma | Female | >=65 | III/IV | Ancillary | zoledronic | SD |
| Page: 1 2 3 4 5 6 7 8 9 10 11 12 |
Top |
Related drugs of malignant transformation related genes |
| Identification of chemicals and drugs interact with genes involved in malignant transfromation |
| (DGIdb 4.0) |
| Entrez ID | Symbol | Category | Interaction Types | Drug Claim Name | Drug Name | PMIDs |
| Page: 1 |

Copyright 2023-Present -The University of Texas Health Science Center at Houston |