
|
|||||
|
 | |
| |
| |
| |
| |
| |
|
Gene: RBL2 |
Gene summary for RBL2 |
| Gene information | Species | Human | Gene symbol | RBL2 | Gene ID | 5934 |
| Gene name | RB transcriptional corepressor like 2 | |
| Gene Alias | P130 | |
| Cytomap | 16q12.2 | |
| Gene Type | protein-coding | GO ID | GO:0000082 | UniProtAcc | Q08999 |
Top |
Malignant transformation analysis |
| Identification of the aberrant gene expression in precancerous and cancerous lesions by comparing the gene expression of stem-like cells in diseased tissues with normal stem cells |
| Entrez ID | Symbol | Replicates | Species | Organ | Tissue | Adj P-value | Log2FC | Malignancy |
| 5934 | RBL2 | LZE2D | Human | Esophagus | HGIN | 1.45e-02 | 2.06e-01 | 0.0642 |
| 5934 | RBL2 | LZE4T | Human | Esophagus | ESCC | 1.00e-10 | 3.82e-01 | 0.0811 |
| 5934 | RBL2 | LZE7T | Human | Esophagus | ESCC | 1.41e-06 | 3.63e-01 | 0.0667 |
| 5934 | RBL2 | LZE8T | Human | Esophagus | ESCC | 2.69e-08 | 2.33e-01 | 0.067 |
| 5934 | RBL2 | LZE20T | Human | Esophagus | ESCC | 1.86e-05 | 1.89e-01 | 0.0662 |
| 5934 | RBL2 | LZE24T | Human | Esophagus | ESCC | 1.40e-23 | 6.16e-01 | 0.0596 |
| 5934 | RBL2 | P1T-E | Human | Esophagus | ESCC | 2.44e-12 | 7.37e-01 | 0.0875 |
| 5934 | RBL2 | P2T-E | Human | Esophagus | ESCC | 5.47e-17 | 3.52e-01 | 0.1177 |
| 5934 | RBL2 | P4T-E | Human | Esophagus | ESCC | 6.00e-18 | 4.52e-01 | 0.1323 |
| 5934 | RBL2 | P5T-E | Human | Esophagus | ESCC | 7.14e-10 | 1.30e-01 | 0.1327 |
| 5934 | RBL2 | P8T-E | Human | Esophagus | ESCC | 3.07e-32 | 6.13e-01 | 0.0889 |
| 5934 | RBL2 | P9T-E | Human | Esophagus | ESCC | 1.76e-06 | 1.24e-01 | 0.1131 |
| 5934 | RBL2 | P10T-E | Human | Esophagus | ESCC | 1.13e-25 | 3.32e-01 | 0.116 |
| 5934 | RBL2 | P11T-E | Human | Esophagus | ESCC | 1.20e-07 | 4.35e-01 | 0.1426 |
| 5934 | RBL2 | P12T-E | Human | Esophagus | ESCC | 1.50e-17 | 2.91e-01 | 0.1122 |
| 5934 | RBL2 | P15T-E | Human | Esophagus | ESCC | 3.57e-12 | 3.76e-01 | 0.1149 |
| 5934 | RBL2 | P16T-E | Human | Esophagus | ESCC | 3.98e-11 | 2.39e-01 | 0.1153 |
| 5934 | RBL2 | P17T-E | Human | Esophagus | ESCC | 3.75e-06 | 2.70e-01 | 0.1278 |
| 5934 | RBL2 | P19T-E | Human | Esophagus | ESCC | 2.13e-05 | 5.49e-01 | 0.1662 |
| 5934 | RBL2 | P20T-E | Human | Esophagus | ESCC | 7.97e-22 | 6.25e-01 | 0.1124 |
| Page: 1 2 3 4 5 6 7 |
| Tissue | Expression Dynamics | Abbreviation |
| Esophagus | 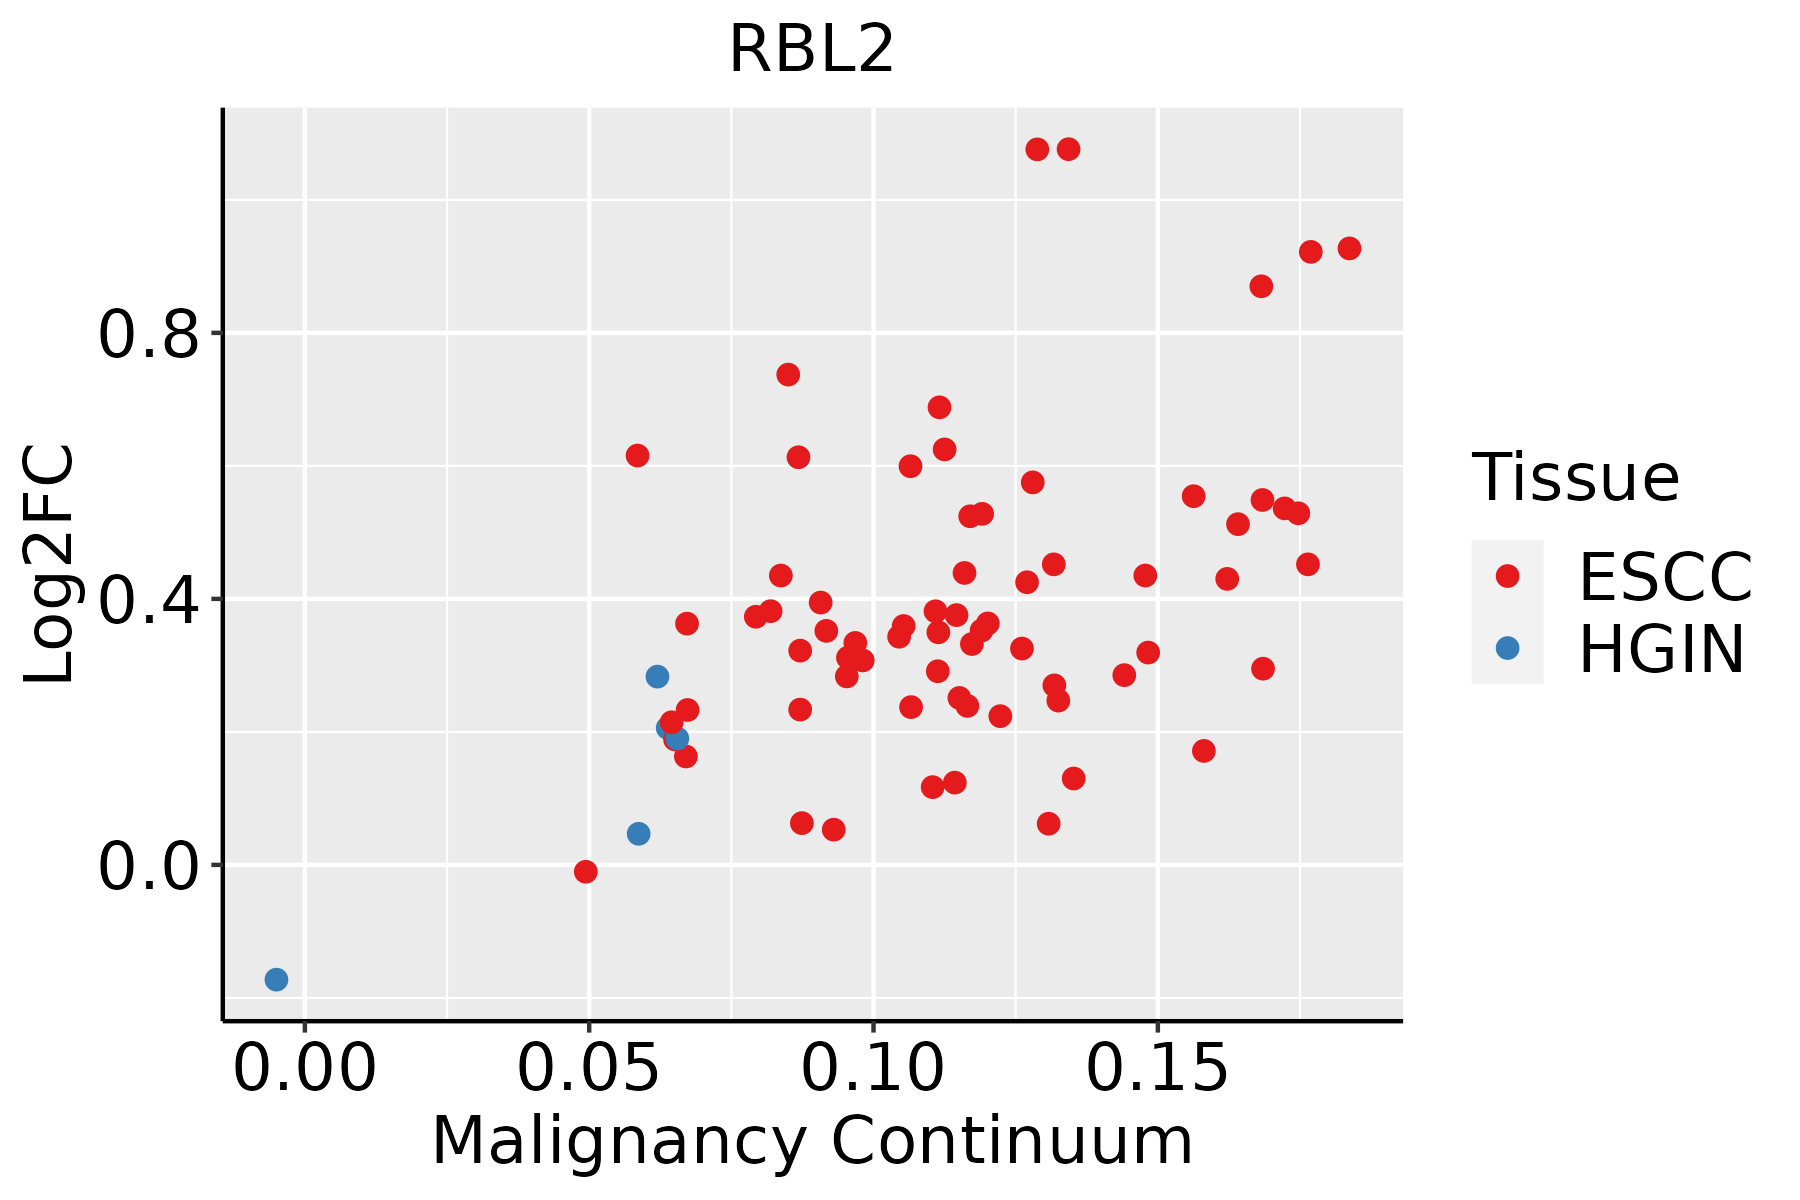 | ESCC: Esophageal squamous cell carcinoma |
| HGIN: High-grade intraepithelial neoplasias | ||
| LGIN: Low-grade intraepithelial neoplasias | ||
| Liver |  | HCC: Hepatocellular carcinoma |
| NAFLD: Non-alcoholic fatty liver disease | ||
| Oral Cavity | 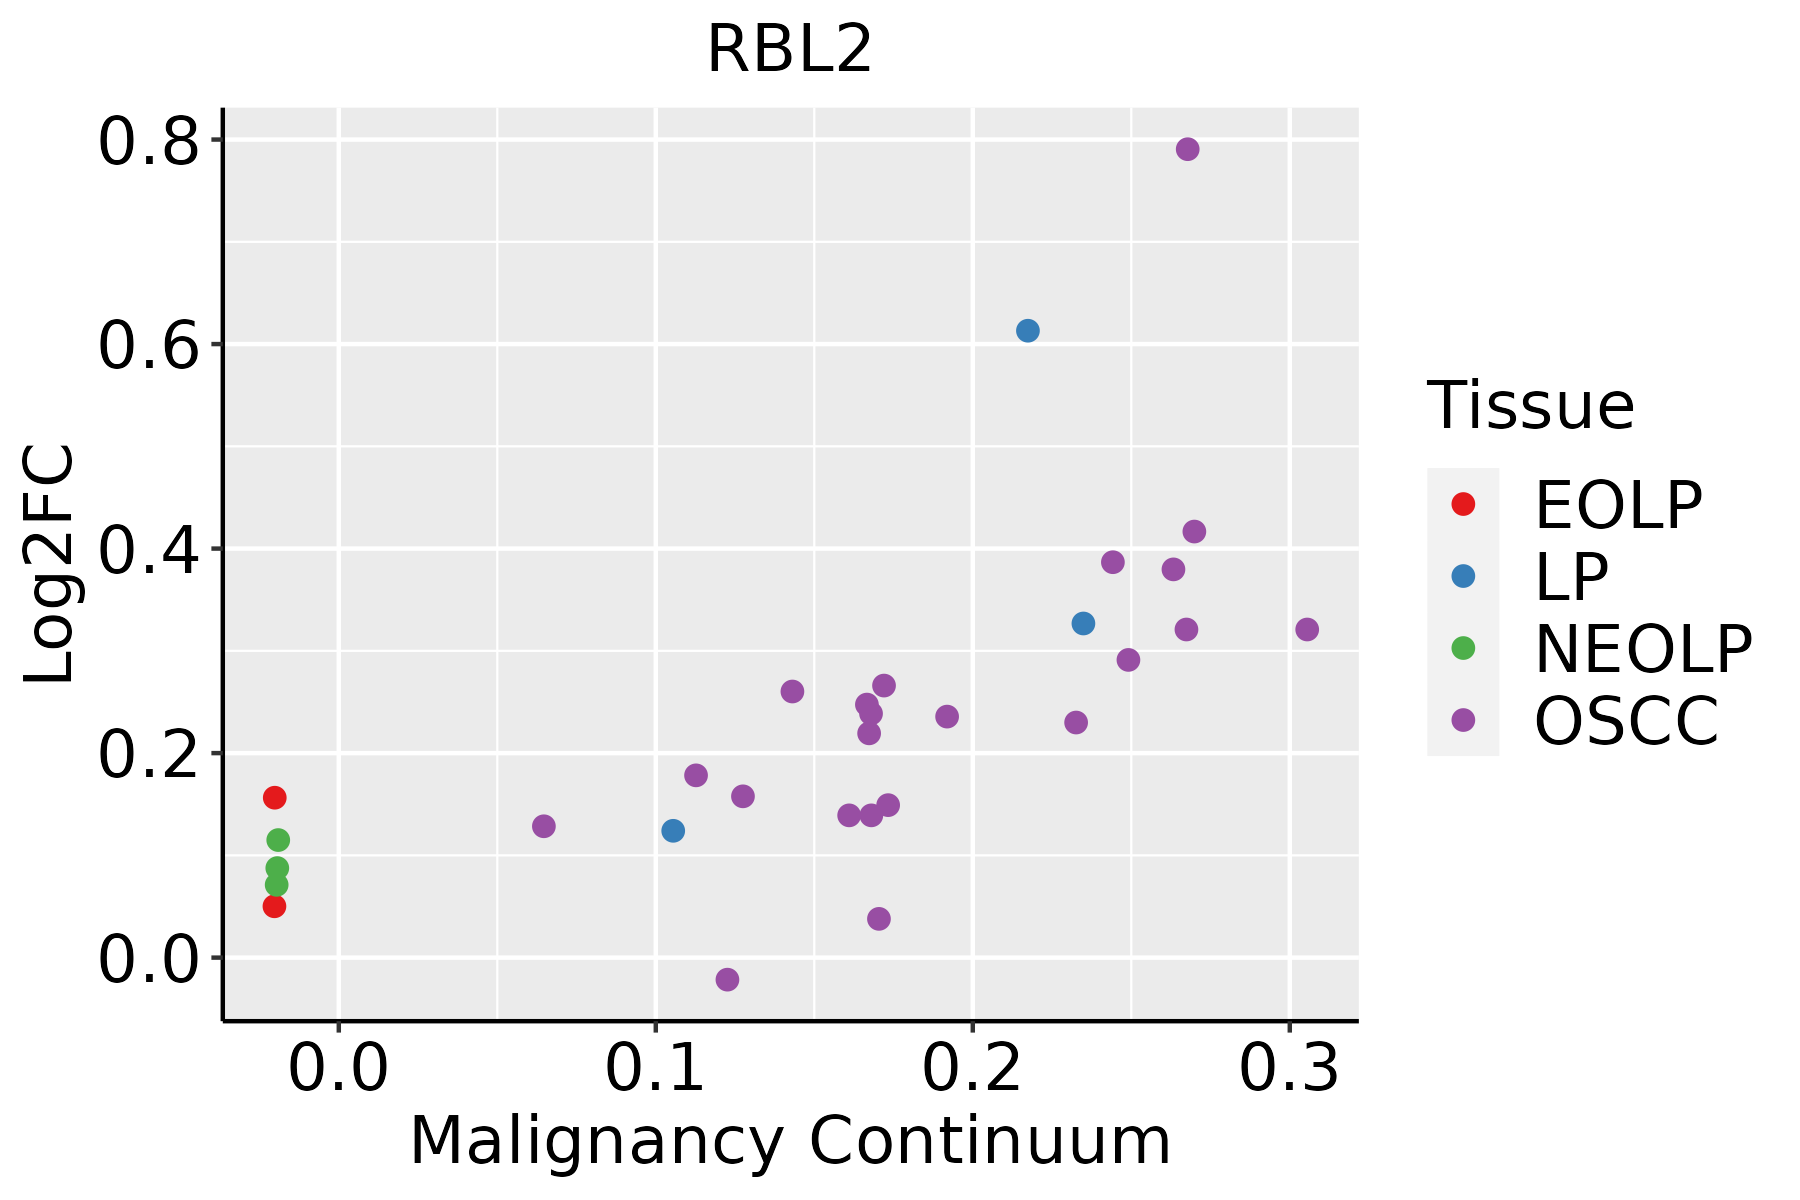 | EOLP: Erosive Oral lichen planus |
| LP: leukoplakia | ||
| NEOLP: Non-erosive oral lichen planus | ||
| OSCC: Oral squamous cell carcinoma | ||
| Prostate | 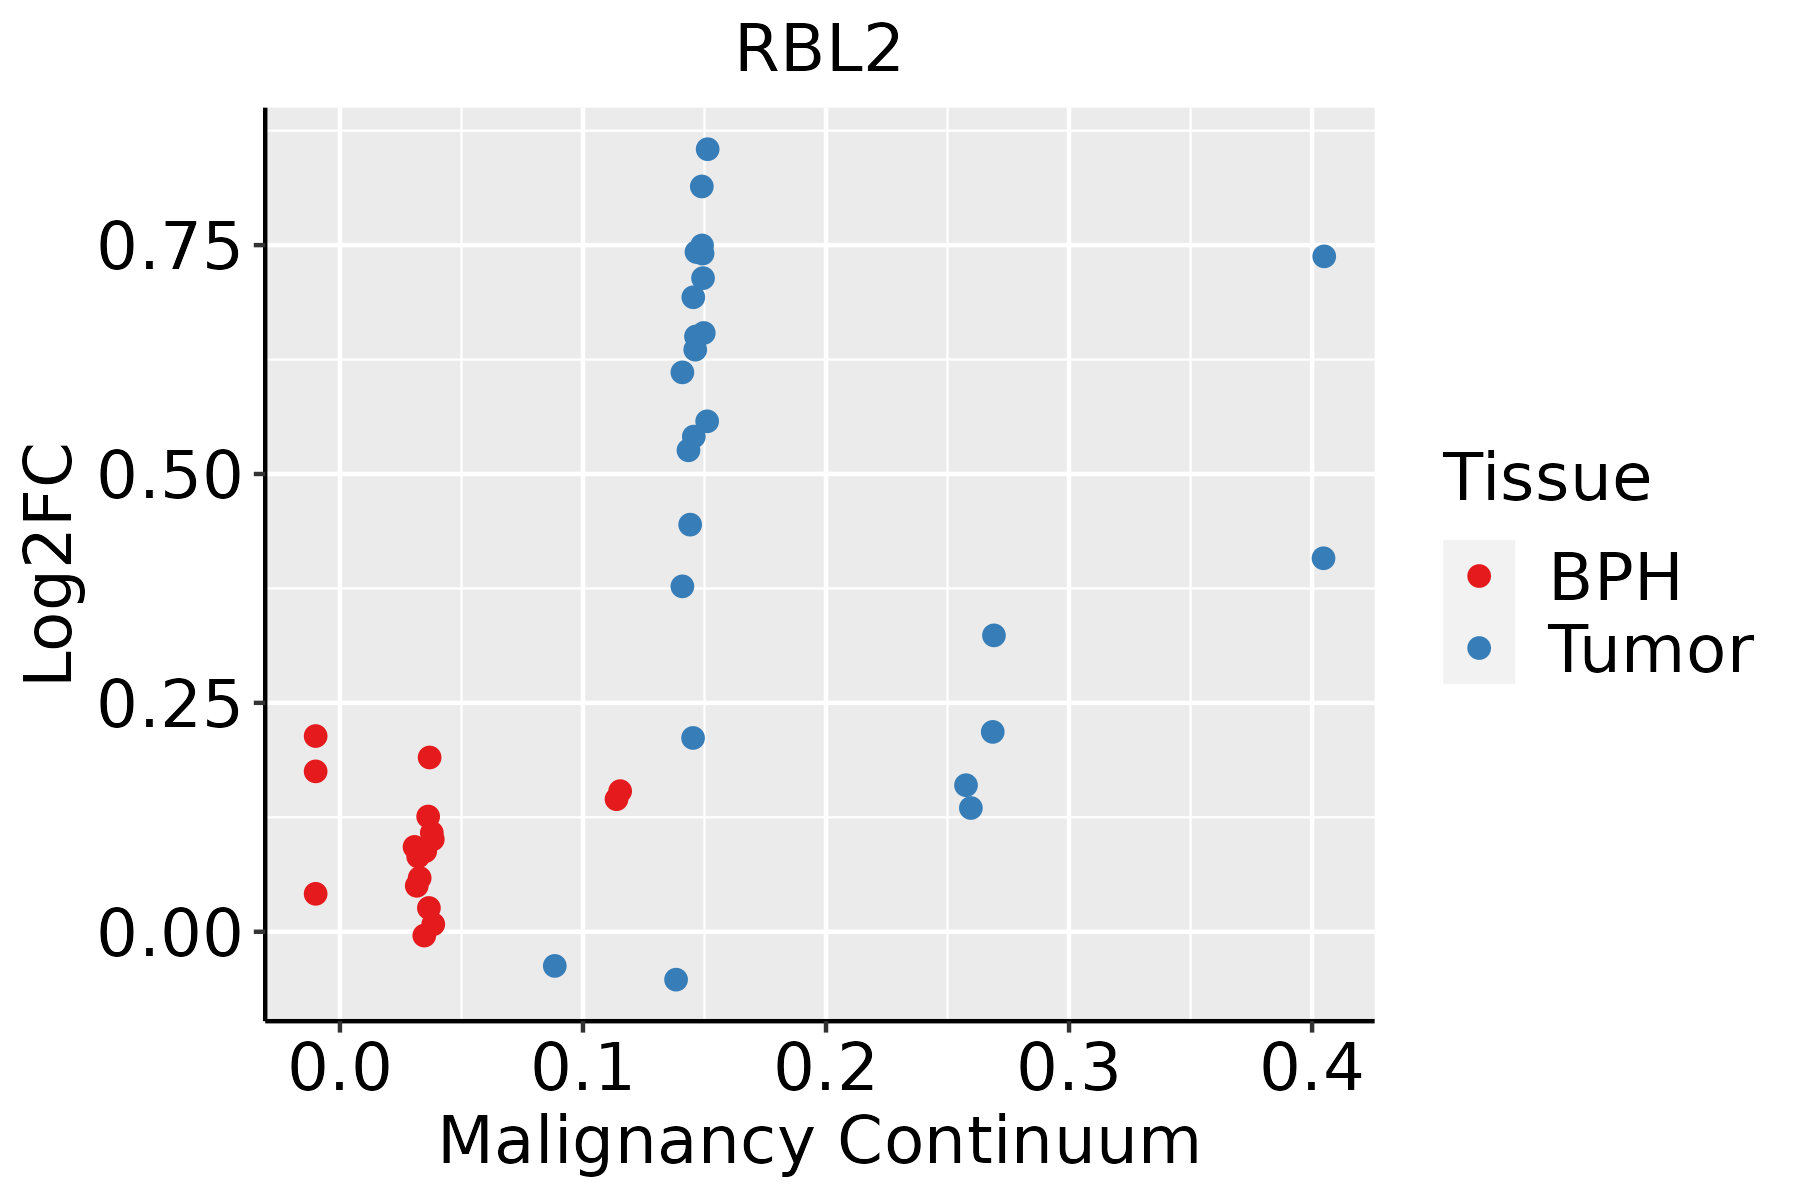 | BPH: Benign Prostatic Hyperplasia |
| Thyroid | 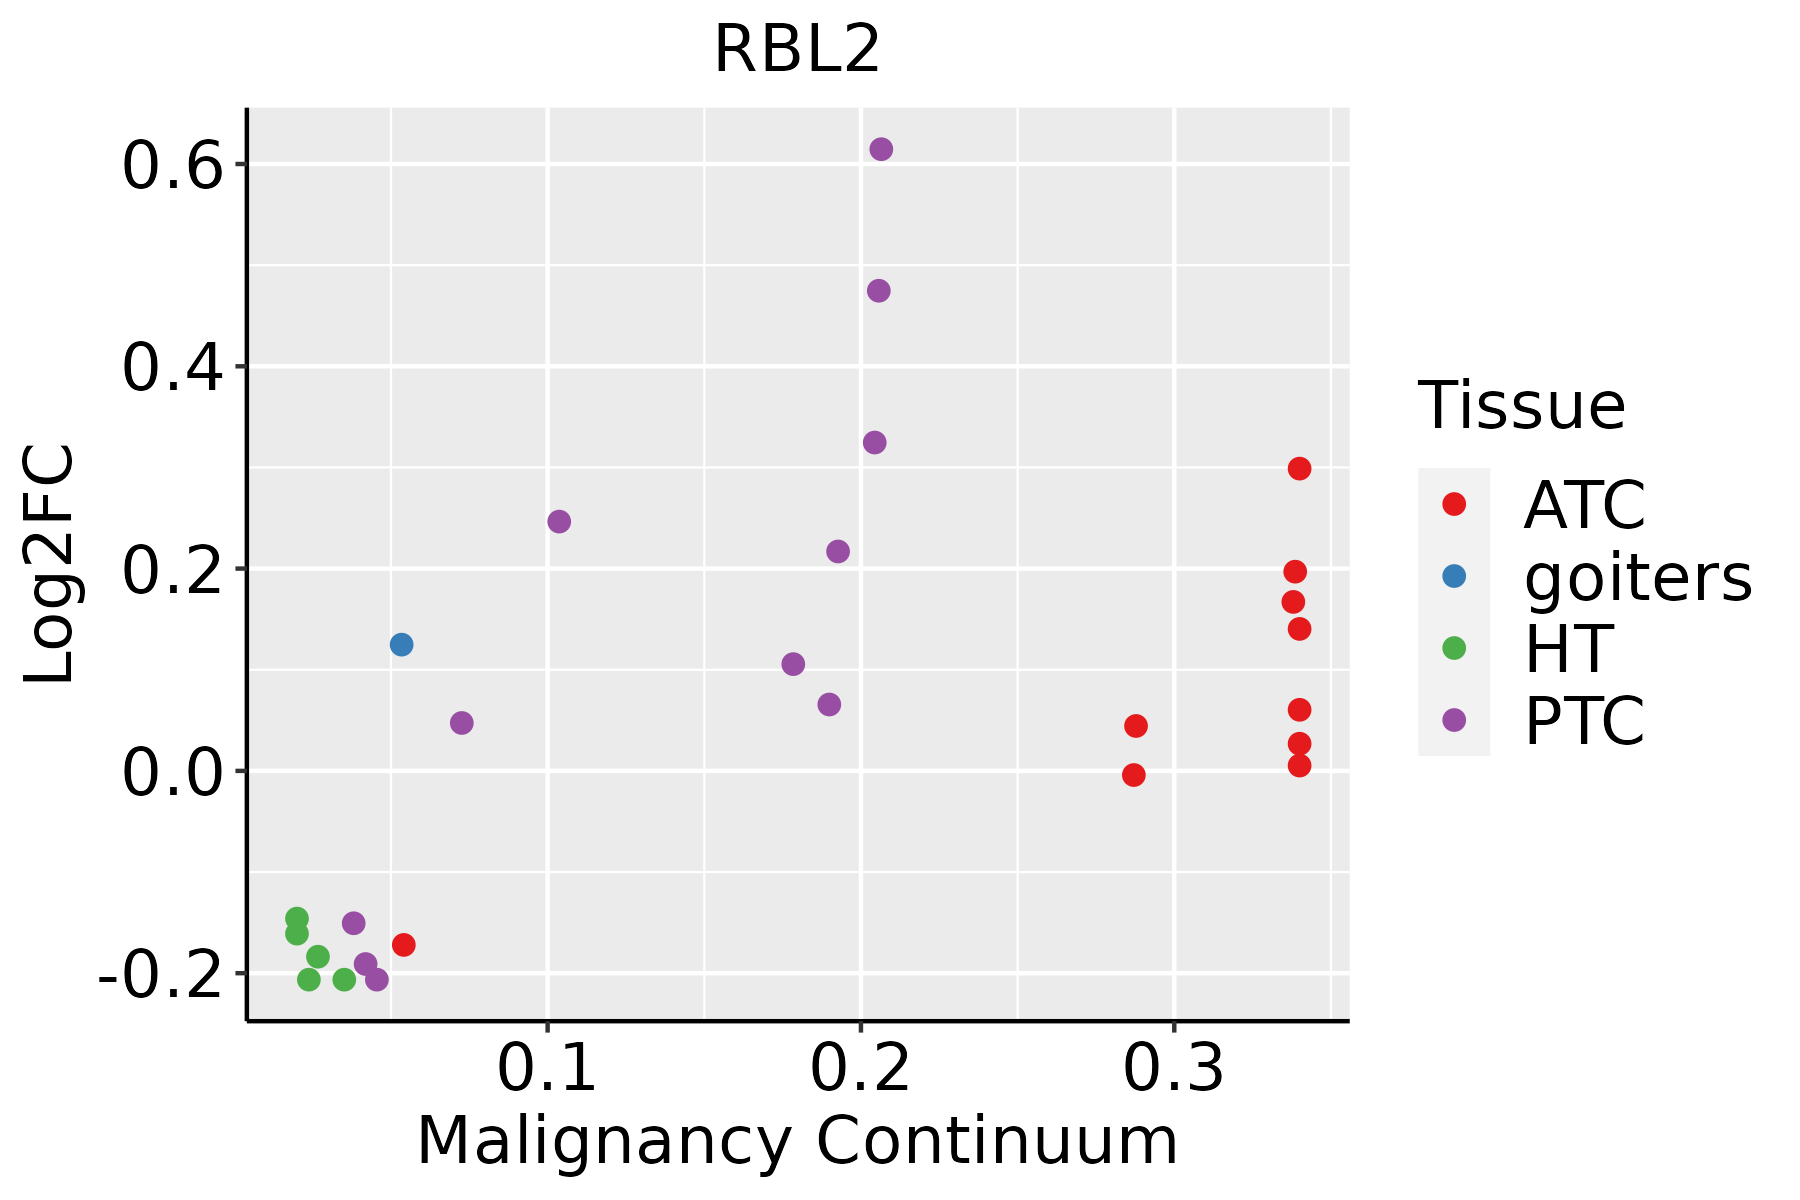 | ATC: Anaplastic thyroid cancer |
| HT: Hashimoto's thyroiditis | ||
| PTC: Papillary thyroid cancer |
| ∗log2FC in expression of this searched gene in stem-like cells from each diseased tissue sample relative to stem-like cells in normal samples in each tissue plotted against the malignancy continuum. Samples are colored based on if they are from different disease stage. |
Top |
Malignant transformation related pathway analysis |
| Find out the enriched GO biological processes and KEGG pathways involved in transition from healthy to precancer to cancer |
| Tissue | Disease Stage | Enriched GO biological Processes |
| Colorectum | AD |  |
| Colorectum | SER |  |
| Colorectum | MSS |  |
| Colorectum | MSI-H |  |
| Colorectum | FAP |  |
| ∗Top 15 enriched GO BP terms are showed in the bar plot of each disease state in each tissue. Each row represents a significant GO biological process which is colored according to the -log10(p.adjust). |
| Page: 1 2 3 4 5 6 7 8 9 |
| GO ID | Tissue | Disease Stage | Description | Gene Ratio | Bg Ratio | pvalue | p.adjust | Count |
| GO:000632516 | Esophagus | HGIN | chromatin organization | 92/2587 | 409/18723 | 1.05e-06 | 4.16e-05 | 92 |
| GO:000734610 | Esophagus | HGIN | regulation of mitotic cell cycle | 98/2587 | 457/18723 | 4.39e-06 | 1.42e-04 | 98 |
| GO:00447729 | Esophagus | HGIN | mitotic cell cycle phase transition | 89/2587 | 424/18723 | 2.80e-05 | 7.21e-04 | 89 |
| GO:19019906 | Esophagus | HGIN | regulation of mitotic cell cycle phase transition | 65/2587 | 299/18723 | 1.12e-04 | 2.36e-03 | 65 |
| GO:20000456 | Esophagus | HGIN | regulation of G1/S transition of mitotic cell cycle | 36/2587 | 142/18723 | 1.74e-04 | 3.35e-03 | 36 |
| GO:00000827 | Esophagus | HGIN | G1/S transition of mitotic cell cycle | 48/2587 | 214/18723 | 3.97e-04 | 6.07e-03 | 48 |
| GO:00448437 | Esophagus | HGIN | cell cycle G1/S phase transition | 52/2587 | 241/18723 | 6.19e-04 | 8.58e-03 | 52 |
| GO:19028065 | Esophagus | HGIN | regulation of cell cycle G1/S phase transition | 39/2587 | 168/18723 | 6.60e-04 | 9.03e-03 | 39 |
| GO:20001343 | Esophagus | HGIN | negative regulation of G1/S transition of mitotic cell cycle | 23/2587 | 84/18723 | 7.90e-04 | 1.03e-02 | 23 |
| GO:00459305 | Esophagus | HGIN | negative regulation of mitotic cell cycle | 49/2587 | 235/18723 | 1.88e-03 | 2.01e-02 | 49 |
| GO:19019915 | Esophagus | HGIN | negative regulation of mitotic cell cycle phase transition | 39/2587 | 179/18723 | 2.31e-03 | 2.36e-02 | 39 |
| GO:19028073 | Esophagus | HGIN | negative regulation of cell cycle G1/S phase transition | 23/2587 | 93/18723 | 3.39e-03 | 3.18e-02 | 23 |
| GO:19019876 | Esophagus | HGIN | regulation of cell cycle phase transition | 72/2587 | 390/18723 | 5.78e-03 | 4.70e-02 | 72 |
| GO:004477216 | Esophagus | ESCC | mitotic cell cycle phase transition | 281/8552 | 424/18723 | 4.63e-18 | 4.45e-16 | 281 |
| GO:000734615 | Esophagus | ESCC | regulation of mitotic cell cycle | 293/8552 | 457/18723 | 8.00e-16 | 5.64e-14 | 293 |
| GO:190198713 | Esophagus | ESCC | regulation of cell cycle phase transition | 242/8552 | 390/18723 | 3.86e-11 | 1.26e-09 | 242 |
| GO:190199013 | Esophagus | ESCC | regulation of mitotic cell cycle phase transition | 191/8552 | 299/18723 | 1.35e-10 | 3.94e-09 | 191 |
| GO:00457865 | Esophagus | ESCC | negative regulation of cell cycle | 236/8552 | 385/18723 | 3.62e-10 | 9.93e-09 | 236 |
| GO:000632517 | Esophagus | ESCC | chromatin organization | 240/8552 | 409/18723 | 6.52e-08 | 1.14e-06 | 240 |
| GO:00109484 | Esophagus | ESCC | negative regulation of cell cycle process | 177/8552 | 294/18723 | 3.26e-07 | 4.59e-06 | 177 |
| Page: 1 2 3 4 5 6 7 8 |
| Pathway ID | Tissue | Disease Stage | Description | Gene Ratio | Bg Ratio | pvalue | p.adjust | qvalue | Count |
| hsa052039 | Esophagus | HGIN | Viral carcinogenesis | 53/1383 | 204/8465 | 2.58e-04 | 2.71e-03 | 2.15e-03 | 53 |
| hsa0421828 | Esophagus | HGIN | Cellular senescence | 42/1383 | 156/8465 | 4.94e-04 | 5.03e-03 | 4.00e-03 | 42 |
| hsa041109 | Esophagus | HGIN | Cell cycle | 38/1383 | 157/8465 | 6.70e-03 | 4.37e-02 | 3.47e-02 | 38 |
| hsa0520315 | Esophagus | HGIN | Viral carcinogenesis | 53/1383 | 204/8465 | 2.58e-04 | 2.71e-03 | 2.15e-03 | 53 |
| hsa04218111 | Esophagus | HGIN | Cellular senescence | 42/1383 | 156/8465 | 4.94e-04 | 5.03e-03 | 4.00e-03 | 42 |
| hsa0411016 | Esophagus | HGIN | Cell cycle | 38/1383 | 157/8465 | 6.70e-03 | 4.37e-02 | 3.47e-02 | 38 |
| hsa0411023 | Esophagus | ESCC | Cell cycle | 126/4205 | 157/8465 | 1.34e-15 | 5.60e-14 | 2.87e-14 | 126 |
| hsa0421829 | Esophagus | ESCC | Cellular senescence | 119/4205 | 156/8465 | 5.89e-12 | 9.40e-11 | 4.81e-11 | 119 |
| hsa0516510 | Esophagus | ESCC | Human papillomavirus infection | 215/4205 | 331/8465 | 7.86e-09 | 7.12e-08 | 3.65e-08 | 215 |
| hsa0520325 | Esophagus | ESCC | Viral carcinogenesis | 137/4205 | 204/8465 | 2.47e-07 | 1.88e-06 | 9.62e-07 | 137 |
| hsa040689 | Esophagus | ESCC | FoxO signaling pathway | 89/4205 | 131/8465 | 1.56e-05 | 7.98e-05 | 4.09e-05 | 89 |
| hsa041517 | Esophagus | ESCC | PI3K-Akt signaling pathway | 197/4205 | 354/8465 | 1.24e-02 | 2.83e-02 | 1.45e-02 | 197 |
| hsa0411033 | Esophagus | ESCC | Cell cycle | 126/4205 | 157/8465 | 1.34e-15 | 5.60e-14 | 2.87e-14 | 126 |
| hsa0421838 | Esophagus | ESCC | Cellular senescence | 119/4205 | 156/8465 | 5.89e-12 | 9.40e-11 | 4.81e-11 | 119 |
| hsa0516515 | Esophagus | ESCC | Human papillomavirus infection | 215/4205 | 331/8465 | 7.86e-09 | 7.12e-08 | 3.65e-08 | 215 |
| hsa0520335 | Esophagus | ESCC | Viral carcinogenesis | 137/4205 | 204/8465 | 2.47e-07 | 1.88e-06 | 9.62e-07 | 137 |
| hsa0406814 | Esophagus | ESCC | FoxO signaling pathway | 89/4205 | 131/8465 | 1.56e-05 | 7.98e-05 | 4.09e-05 | 89 |
| hsa0415114 | Esophagus | ESCC | PI3K-Akt signaling pathway | 197/4205 | 354/8465 | 1.24e-02 | 2.83e-02 | 1.45e-02 | 197 |
| hsa04068 | Liver | NAFLD | FoxO signaling pathway | 30/1043 | 131/8465 | 4.91e-04 | 8.05e-03 | 6.49e-03 | 30 |
| hsa040681 | Liver | NAFLD | FoxO signaling pathway | 30/1043 | 131/8465 | 4.91e-04 | 8.05e-03 | 6.49e-03 | 30 |
| Page: 1 2 3 4 5 |
Top |
Cell-cell communication analysis |
| Identification of potential cell-cell interactions between two cell types and their ligand-receptor pairs for different disease states |
| Ligand | Receptor | LRpair | Pathway | Tissue | Disease Stage |
| Page: 1 |
Top |
Single-cell gene regulatory network inference analysis |
| Find out the significant the regulons (TFs) and the target genes of each regulon across cell types for different disease states |
| TF | Cell Type | Tissue | Disease Stage | Target Gene | RSS | Regulon Activity |
| ∗The dot plots of a searched regulon are shown for all cell subpopulations in each disease state of each tissue based on the regulon specific score inferred using pySCENIC and by calculating the average expression. |
| Page: 1 |
Top |
Somatic mutation of malignant transformation related genes |
| Annotation of somatic variants for genes involved in malignant transformation |
| Hugo Symbol | Variant Class | Variant Classification | dbSNP RS | HGVSc | HGVSp | HGVSp Short | SWISSPROT | BIOTYPE | SIFT | PolyPhen | Tumor Sample Barcode | Tissue | Histology | Sex | Age | Stage | Therapy Types | Drugs | Outcome |
| RBL2 | SNV | Missense_Mutation | novel | c.873G>T | p.Lys291Asn | p.K291N | Q08999 | protein_coding | deleterious(0) | probably_damaging(0.994) | TCGA-A7-A0DB-01 | Breast | breast invasive carcinoma | Female | <65 | I/II | Hormone Therapy | arimidex | SD |
| RBL2 | SNV | Missense_Mutation | rs376376448 | c.547N>T | p.Arg183Cys | p.R183C | Q08999 | protein_coding | deleterious(0.01) | benign(0.039) | TCGA-AN-A041-01 | Breast | breast invasive carcinoma | Female | <65 | I/II | Unknown | Unknown | SD |
| RBL2 | SNV | Missense_Mutation | novel | c.1504N>T | p.Val502Leu | p.V502L | Q08999 | protein_coding | tolerated(0.3) | benign(0.131) | TCGA-BH-A0HA-01 | Breast | breast invasive carcinoma | Female | <65 | I/II | Unknown | Unknown | SD |
| RBL2 | SNV | Missense_Mutation | novel | c.1594N>G | p.Leu532Val | p.L532V | Q08999 | protein_coding | deleterious(0) | probably_damaging(0.998) | TCGA-C5-A1MH-01 | Cervix | cervical & endocervical cancer | Female | >=65 | III/IV | Chemotherapy | cisplatin | PD |
| RBL2 | SNV | Missense_Mutation | c.2071N>A | p.Asp691Asn | p.D691N | Q08999 | protein_coding | tolerated(0.12) | benign(0.051) | TCGA-IR-A3LL-01 | Cervix | cervical & endocervical cancer | Female | <65 | I/II | Chemotherapy | cisplatin | CR | |
| RBL2 | SNV | Missense_Mutation | novel | c.3305G>C | p.Arg1102Thr | p.R1102T | Q08999 | protein_coding | deleterious(0.01) | probably_damaging(0.986) | TCGA-MA-AA42-01 | Cervix | cervical & endocervical cancer | Female | >=65 | I/II | Unknown | Unknown | SD |
| RBL2 | SNV | Missense_Mutation | novel | c.430N>G | p.His144Asp | p.H144D | Q08999 | protein_coding | tolerated(0.51) | benign(0) | TCGA-VS-A9UC-01 | Cervix | cervical & endocervical cancer | Female | <65 | I/II | Chemotherapy | cisplatin | SD |
| RBL2 | SNV | Missense_Mutation | rs371003080 | c.1111G>A | p.Ala371Thr | p.A371T | Q08999 | protein_coding | tolerated(0.6) | benign(0) | TCGA-A6-3809-01 | Colorectum | colon adenocarcinoma | Female | >=65 | I/II | Unknown | Unknown | SD |
| RBL2 | SNV | Missense_Mutation | c.1957N>G | p.Thr653Ala | p.T653A | Q08999 | protein_coding | tolerated(0.77) | benign(0) | TCGA-AA-3811-01 | Colorectum | colon adenocarcinoma | Female | >=65 | III/IV | Unknown | Unknown | PD | |
| RBL2 | SNV | Missense_Mutation | c.3276N>G | p.Ile1092Met | p.I1092M | Q08999 | protein_coding | tolerated(0.13) | possibly_damaging(0.708) | TCGA-AA-3864-01 | Colorectum | colon adenocarcinoma | Male | >=65 | I/II | Unknown | Unknown | SD |
| Page: 1 2 3 4 5 6 7 8 9 10 11 |
Top |
Related drugs of malignant transformation related genes |
| Identification of chemicals and drugs interact with genes involved in malignant transfromation |
| (DGIdb 4.0) |
| Entrez ID | Symbol | Category | Interaction Types | Drug Claim Name | Drug Name | PMIDs |
| 5934 | RBL2 | TRANSCRIPTION FACTOR COMPLEX, ENZYME | RAPAMYCIN | SIROLIMUS | 8895523 |
| Page: 1 |

Copyright 2023-Present -The University of Texas Health Science Center at Houston |