
|
|||||
|
 | |
| |
| |
| |
| |
| |
|
Gene: RBIS |
Gene summary for RBIS |
| Gene information | Species | Human | Gene symbol | RBIS | Gene ID | 401466 |
| Gene name | ribosomal biogenesis factor | |
| Gene Alias | C8orf59 | |
| Cytomap | 8q21.2 | |
| Gene Type | protein-coding | GO ID | GO:0008150 | UniProtAcc | A0A024R838 |
Top |
Malignant transformation analysis |
| Identification of the aberrant gene expression in precancerous and cancerous lesions by comparing the gene expression of stem-like cells in diseased tissues with normal stem cells |
| Entrez ID | Symbol | Replicates | Species | Organ | Tissue | Adj P-value | Log2FC | Malignancy |
| 401466 | RBIS | CA_HPV_1 | Human | Cervix | CC | 8.08e-09 | -2.53e-01 | 0.0264 |
| 401466 | RBIS | N_HPV_2 | Human | Cervix | N_HPV | 1.49e-02 | 1.73e-02 | -0.0131 |
| 401466 | RBIS | CCI_1 | Human | Cervix | CC | 1.58e-11 | -8.02e-01 | 0.528 |
| 401466 | RBIS | CCI_2 | Human | Cervix | CC | 6.52e-06 | -6.95e-01 | 0.5249 |
| 401466 | RBIS | CCI_3 | Human | Cervix | CC | 1.53e-11 | -7.45e-01 | 0.516 |
| 401466 | RBIS | CCII_1 | Human | Cervix | CC | 2.57e-25 | -8.22e-01 | 0.3249 |
| 401466 | RBIS | Tumor | Human | Cervix | CC | 1.06e-53 | -8.22e-01 | 0.1241 |
| 401466 | RBIS | sample1 | Human | Cervix | CC | 1.81e-02 | -4.69e-01 | 0.0959 |
| 401466 | RBIS | sample3 | Human | Cervix | CC | 1.25e-03 | -2.23e-01 | 0.1387 |
| 401466 | RBIS | H2 | Human | Cervix | HSIL_HPV | 1.99e-08 | -4.13e-01 | 0.0632 |
| 401466 | RBIS | L1 | Human | Cervix | CC | 2.16e-06 | -2.35e-01 | 0.0802 |
| 401466 | RBIS | T1 | Human | Cervix | CC | 1.30e-04 | -3.85e-01 | 0.0918 |
| 401466 | RBIS | T3 | Human | Cervix | CC | 3.03e-05 | -2.58e-01 | 0.1389 |
| 401466 | RBIS | AEH-subject1 | Human | Endometrium | AEH | 3.02e-19 | 3.64e-01 | -0.3059 |
| 401466 | RBIS | AEH-subject2 | Human | Endometrium | AEH | 1.47e-17 | 3.87e-01 | -0.2525 |
| 401466 | RBIS | AEH-subject3 | Human | Endometrium | AEH | 1.44e-25 | 4.73e-01 | -0.2576 |
| 401466 | RBIS | AEH-subject4 | Human | Endometrium | AEH | 1.18e-14 | 3.70e-01 | -0.2657 |
| 401466 | RBIS | AEH-subject5 | Human | Endometrium | AEH | 7.80e-30 | 4.57e-01 | -0.2953 |
| 401466 | RBIS | EEC-subject1 | Human | Endometrium | EEC | 2.24e-16 | 3.80e-01 | -0.2682 |
| 401466 | RBIS | EEC-subject2 | Human | Endometrium | EEC | 4.35e-17 | 3.04e-01 | -0.2607 |
| Page: 1 2 3 4 5 |
| Tissue | Expression Dynamics | Abbreviation |
| Cervix | 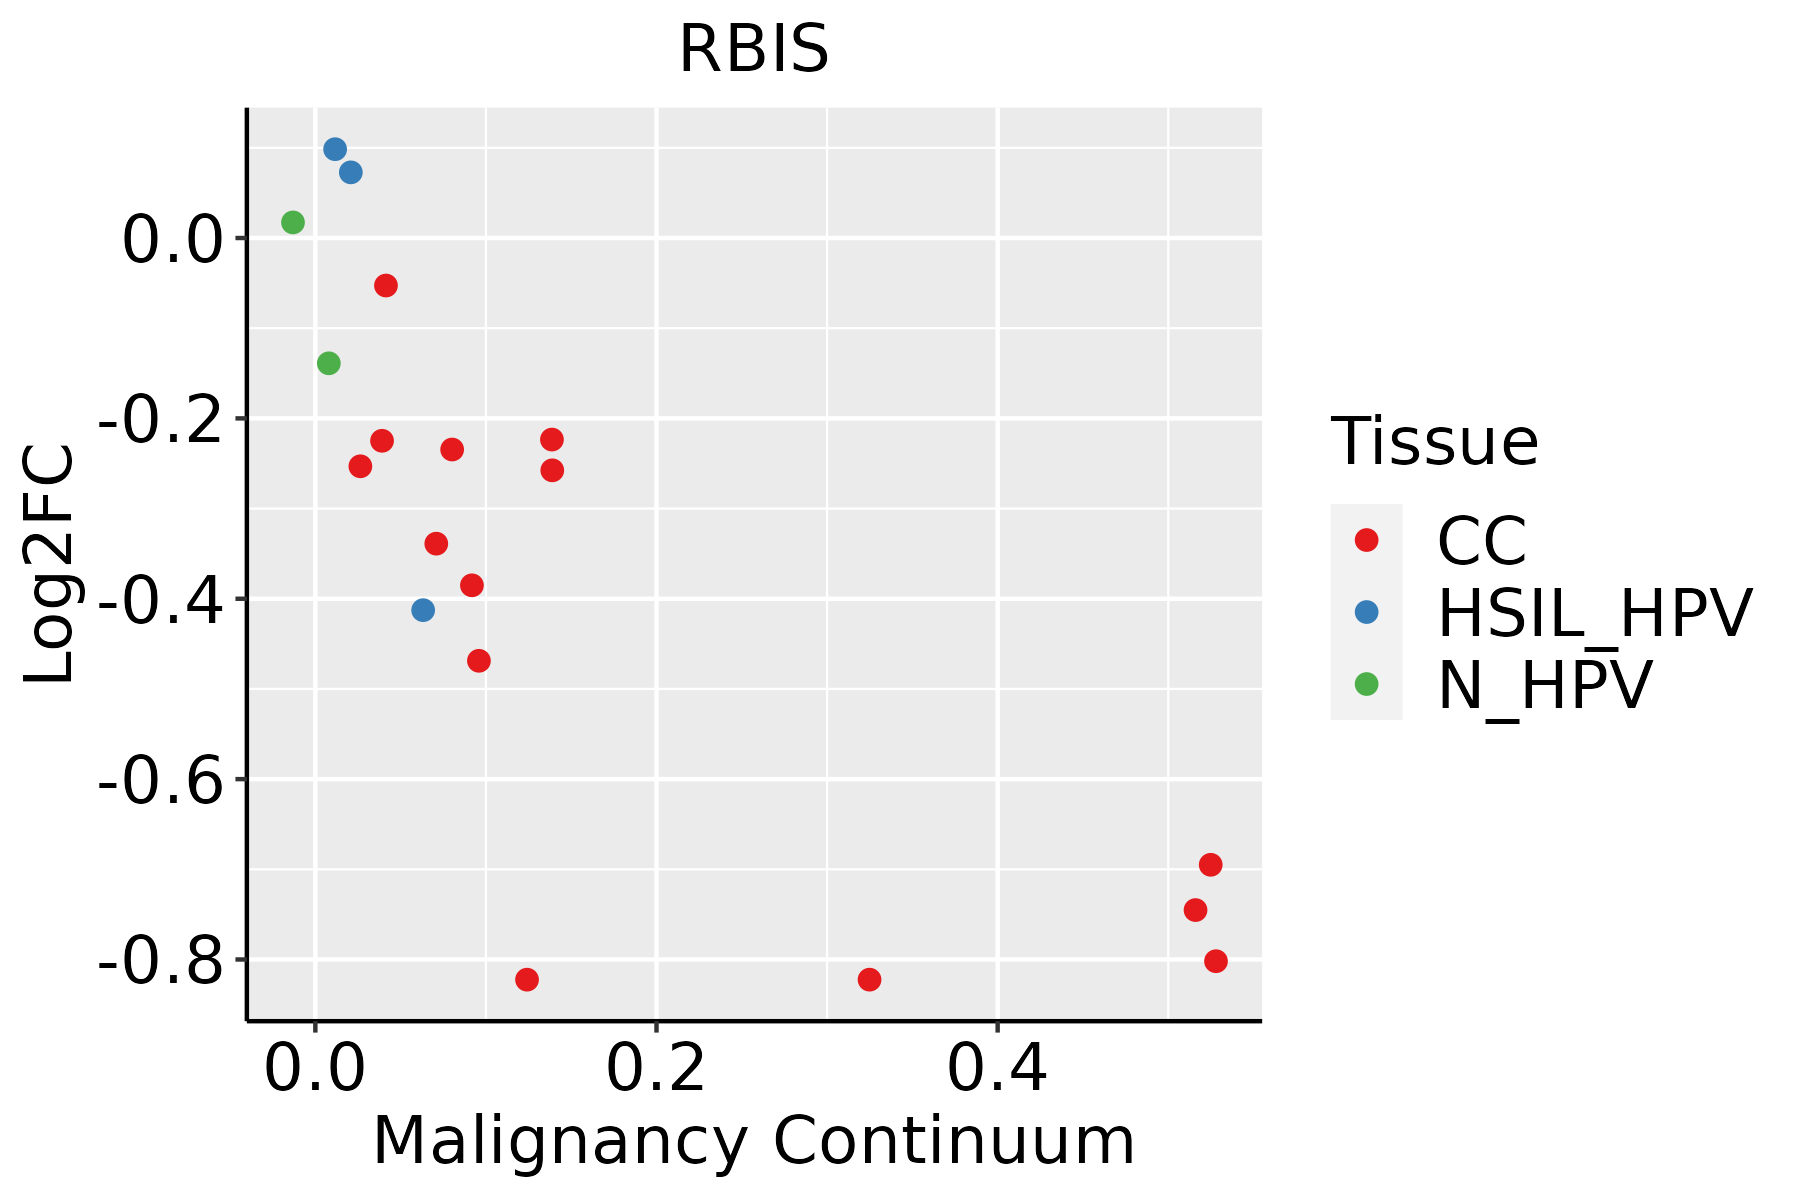 | CC: Cervix cancer |
| HSIL_HPV: HPV-infected high-grade squamous intraepithelial lesions | ||
| N_HPV: HPV-infected normal cervix | ||
| Endometrium |  | AEH: Atypical endometrial hyperplasia |
| EEC: Endometrioid Cancer | ||
| Esophagus | 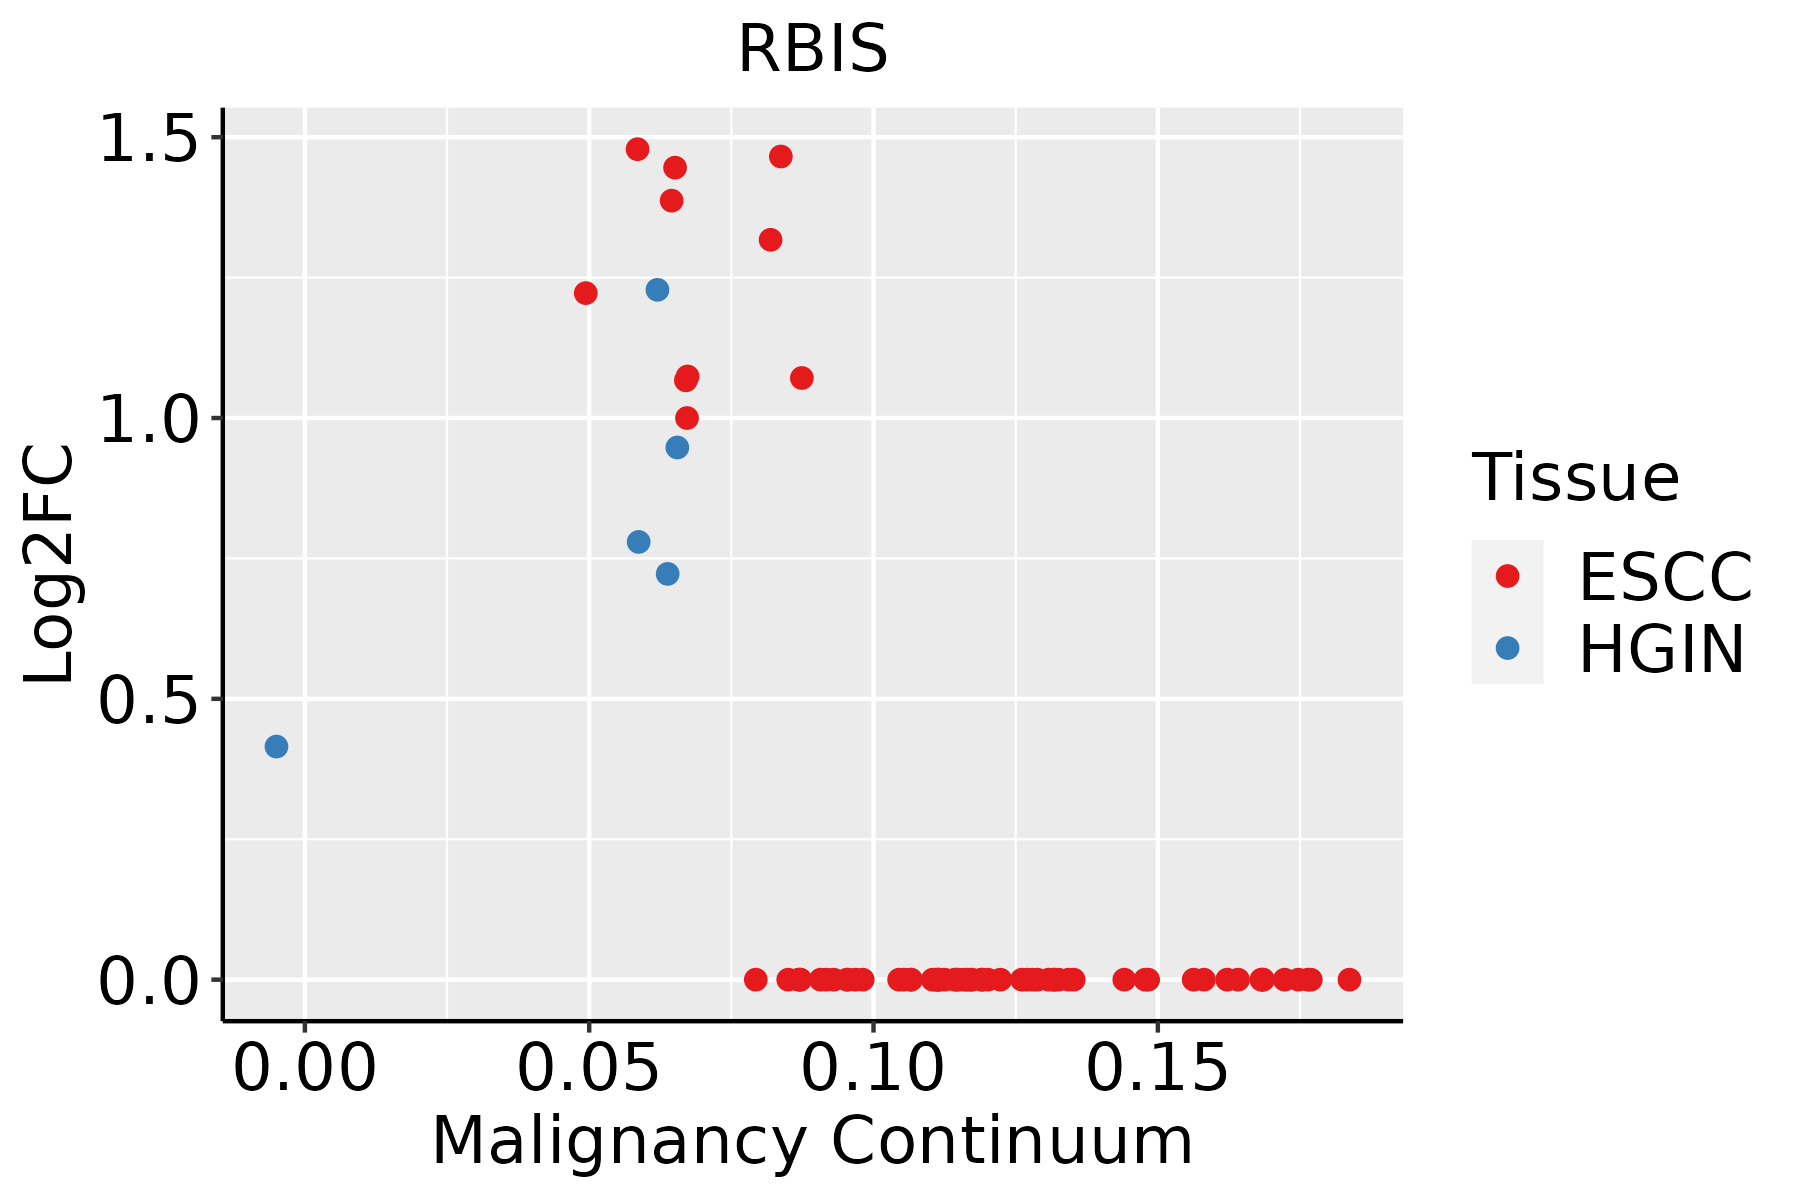 | ESCC: Esophageal squamous cell carcinoma |
| HGIN: High-grade intraepithelial neoplasias | ||
| LGIN: Low-grade intraepithelial neoplasias | ||
| GC |  | CAG: Chronic atrophic gastritis |
| CAG with IM: Chronic atrophic gastritis with intestinal metaplasia | ||
| CSG: Chronic superficial gastritis | ||
| GC: Gastric cancer | ||
| SIM: Severe intestinal metaplasia | ||
| WIM: Wild intestinal metaplasia | ||
| Lung | 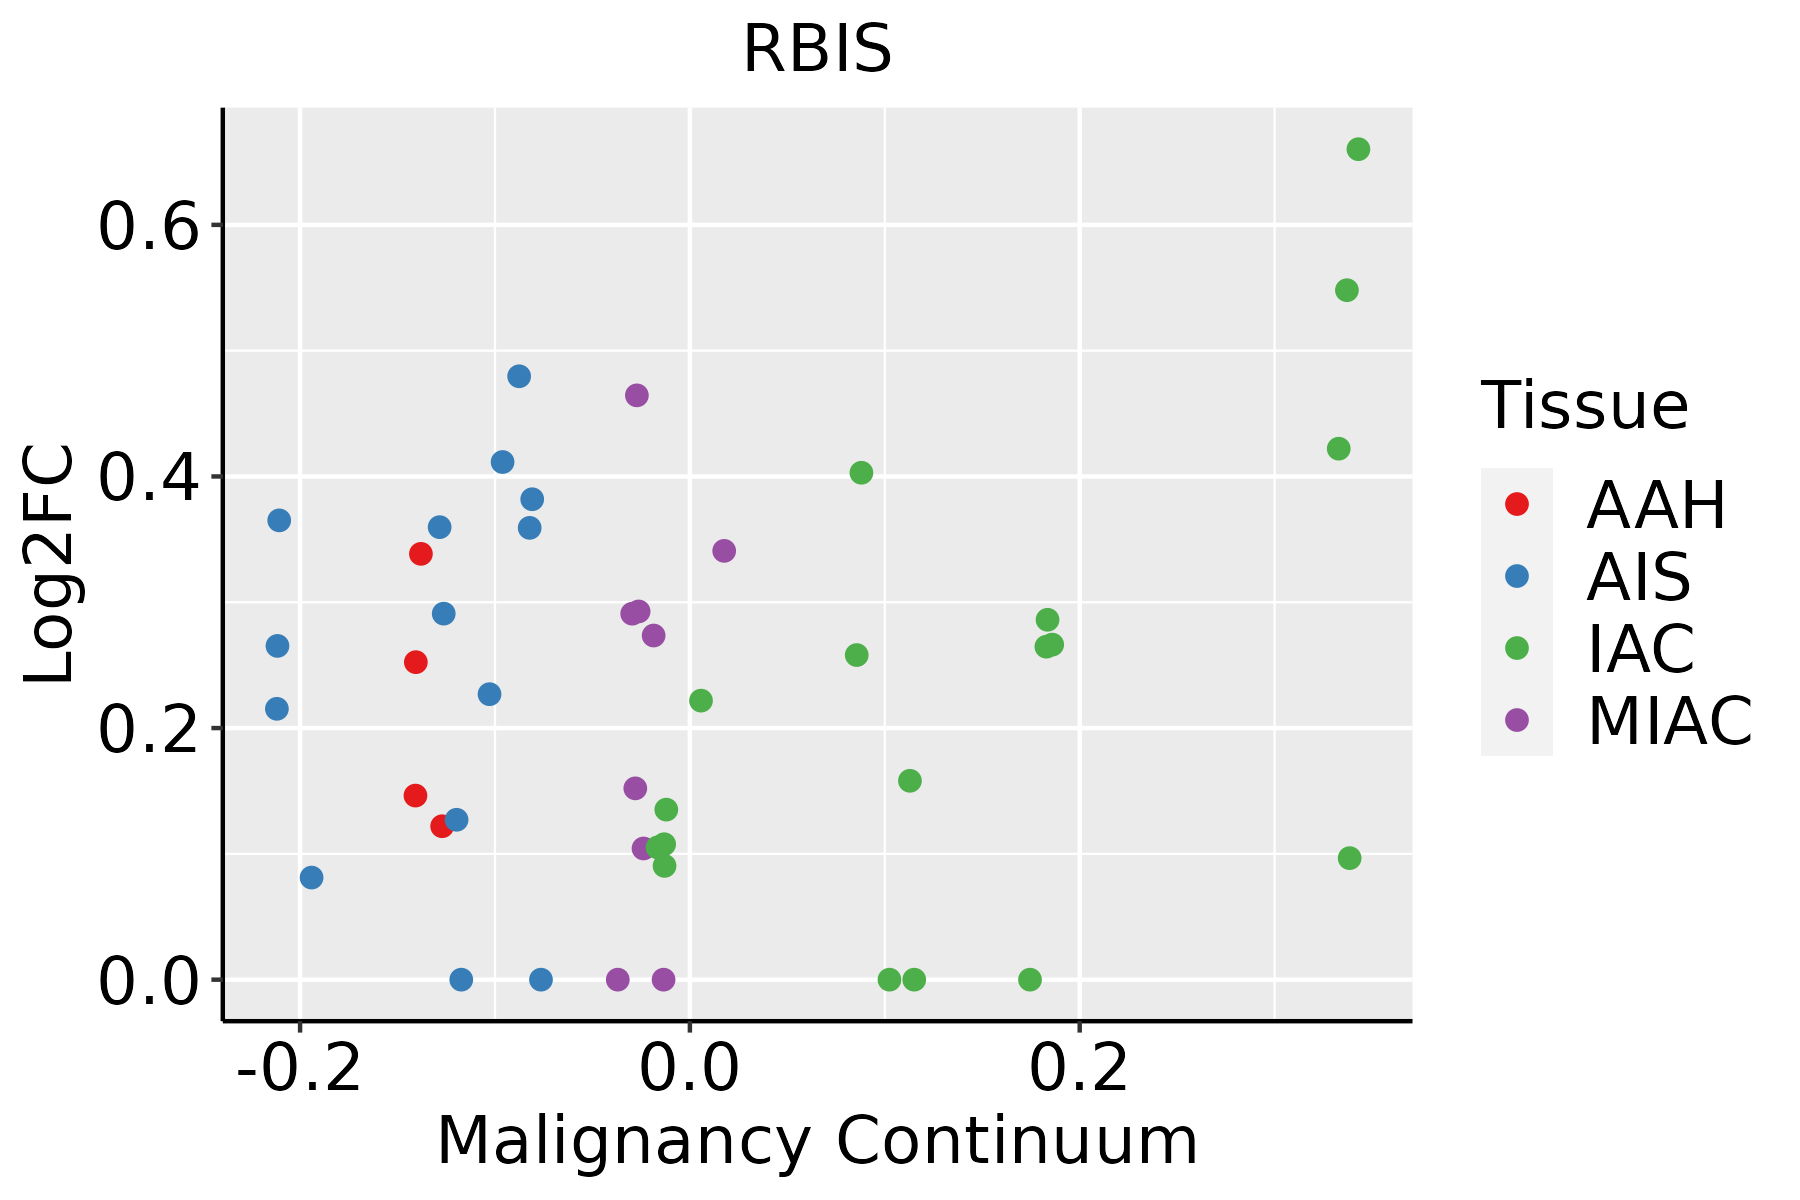 | AAH: Atypical adenomatous hyperplasia |
| AIS: Adenocarcinoma in situ | ||
| IAC: Invasive lung adenocarcinoma | ||
| MIA: Minimally invasive adenocarcinoma | ||
| Prostate |  | BPH: Benign Prostatic Hyperplasia |
| Skin | 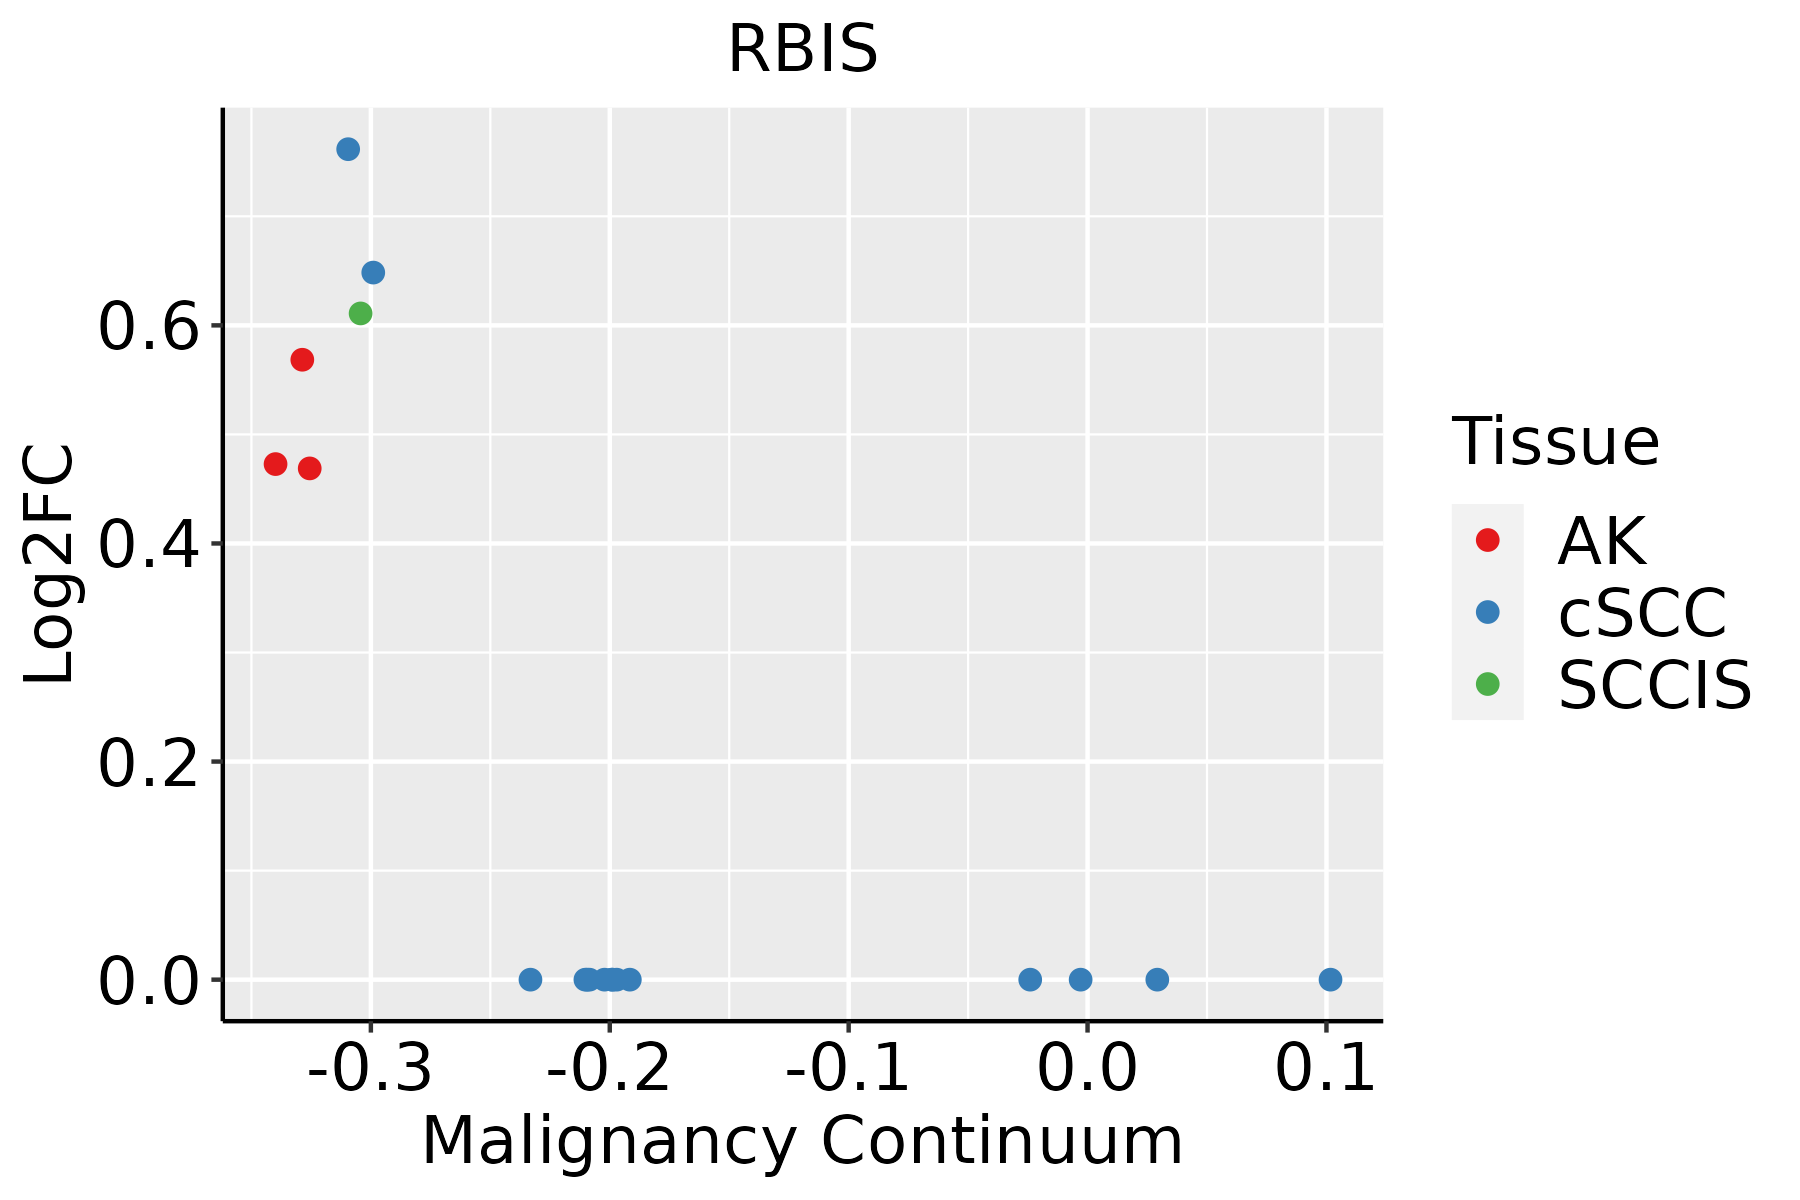 | AK: Actinic keratosis |
| cSCC: Cutaneous squamous cell carcinoma | ||
| SCCIS:squamous cell carcinoma in situ |
| ∗log2FC in expression of this searched gene in stem-like cells from each diseased tissue sample relative to stem-like cells in normal samples in each tissue plotted against the malignancy continuum. Samples are colored based on if they are from different disease stage. |
Top |
Malignant transformation related pathway analysis |
| Find out the enriched GO biological processes and KEGG pathways involved in transition from healthy to precancer to cancer |
| Tissue | Disease Stage | Enriched GO biological Processes |
| Colorectum | AD |  |
| Colorectum | SER |  |
| Colorectum | MSS |  |
| Colorectum | MSI-H |  |
| Colorectum | FAP |  |
| ∗Top 15 enriched GO BP terms are showed in the bar plot of each disease state in each tissue. Each row represents a significant GO biological process which is colored according to the -log10(p.adjust). |
| Page: 1 2 3 4 5 6 7 8 9 |
| GO ID | Tissue | Disease Stage | Description | Gene Ratio | Bg Ratio | pvalue | p.adjust | Count |
| GO:002261310 | Cervix | CC | ribonucleoprotein complex biogenesis | 88/2311 | 463/18723 | 2.11e-05 | 3.82e-04 | 88 |
| GO:004225410 | Cervix | CC | ribosome biogenesis | 62/2311 | 299/18723 | 2.48e-05 | 4.27e-04 | 62 |
| GO:002261315 | Cervix | HSIL_HPV | ribonucleoprotein complex biogenesis | 52/737 | 463/18723 | 9.85e-12 | 6.81e-09 | 52 |
| GO:004225415 | Cervix | HSIL_HPV | ribosome biogenesis | 40/737 | 299/18723 | 1.25e-11 | 6.81e-09 | 40 |
| GO:002261325 | Cervix | N_HPV | ribonucleoprotein complex biogenesis | 30/534 | 463/18723 | 2.78e-05 | 7.49e-04 | 30 |
| GO:004225424 | Cervix | N_HPV | ribosome biogenesis | 21/534 | 299/18723 | 1.46e-04 | 2.68e-03 | 21 |
| GO:002261316 | Endometrium | AEH | ribonucleoprotein complex biogenesis | 107/2100 | 463/18723 | 1.43e-13 | 4.08e-11 | 107 |
| GO:004225416 | Endometrium | AEH | ribosome biogenesis | 67/2100 | 299/18723 | 1.95e-08 | 1.18e-06 | 67 |
| GO:002261317 | Endometrium | EEC | ribonucleoprotein complex biogenesis | 108/2168 | 463/18723 | 4.60e-13 | 9.86e-11 | 108 |
| GO:004225417 | Endometrium | EEC | ribosome biogenesis | 68/2168 | 299/18723 | 2.90e-08 | 1.68e-06 | 68 |
| GO:002261327 | Esophagus | HGIN | ribonucleoprotein complex biogenesis | 158/2587 | 463/18723 | 2.61e-29 | 5.23e-26 | 158 |
| GO:004225426 | Esophagus | HGIN | ribosome biogenesis | 101/2587 | 299/18723 | 8.74e-19 | 4.03e-16 | 101 |
| GO:0022613111 | Esophagus | ESCC | ribonucleoprotein complex biogenesis | 365/8552 | 463/18723 | 1.74e-49 | 1.11e-45 | 365 |
| GO:0042254111 | Esophagus | ESCC | ribosome biogenesis | 252/8552 | 299/18723 | 3.27e-44 | 1.04e-40 | 252 |
| GO:00226138 | Lung | AIS | ribonucleoprotein complex biogenesis | 63/1849 | 463/18723 | 5.49e-03 | 4.68e-02 | 63 |
| GO:002261318 | Prostate | BPH | ribonucleoprotein complex biogenesis | 150/3107 | 463/18723 | 2.18e-17 | 5.62e-15 | 150 |
| GO:004225418 | Prostate | BPH | ribosome biogenesis | 90/3107 | 299/18723 | 3.82e-09 | 1.44e-07 | 90 |
| GO:002261319 | Prostate | Tumor | ribonucleoprotein complex biogenesis | 159/3246 | 463/18723 | 3.17e-19 | 1.52e-16 | 159 |
| GO:004225419 | Prostate | Tumor | ribosome biogenesis | 96/3246 | 299/18723 | 2.76e-10 | 1.51e-08 | 96 |
| GO:002261328 | Skin | AK | ribonucleoprotein complex biogenesis | 108/1910 | 463/18723 | 8.48e-17 | 6.27e-14 | 108 |
| Page: 1 2 |
| Pathway ID | Tissue | Disease Stage | Description | Gene Ratio | Bg Ratio | pvalue | p.adjust | qvalue | Count |
| Page: 1 |
Top |
Cell-cell communication analysis |
| Identification of potential cell-cell interactions between two cell types and their ligand-receptor pairs for different disease states |
| Ligand | Receptor | LRpair | Pathway | Tissue | Disease Stage |
| Page: 1 |
Top |
Single-cell gene regulatory network inference analysis |
| Find out the significant the regulons (TFs) and the target genes of each regulon across cell types for different disease states |
| TF | Cell Type | Tissue | Disease Stage | Target Gene | RSS | Regulon Activity |
| ∗The dot plots of a searched regulon are shown for all cell subpopulations in each disease state of each tissue based on the regulon specific score inferred using pySCENIC and by calculating the average expression. |
| Page: 1 |
Top |
Somatic mutation of malignant transformation related genes |
| Annotation of somatic variants for genes involved in malignant transformation |
| Hugo Symbol | Variant Class | Variant Classification | dbSNP RS | HGVSc | HGVSp | HGVSp Short | SWISSPROT | BIOTYPE | SIFT | PolyPhen | Tumor Sample Barcode | Tissue | Histology | Sex | Age | Stage | Therapy Types | Drugs | Outcome |
| Page: 1 |
Top |
Related drugs of malignant transformation related genes |
| Identification of chemicals and drugs interact with genes involved in malignant transfromation |
| (DGIdb 4.0) |
| Entrez ID | Symbol | Category | Interaction Types | Drug Claim Name | Drug Name | PMIDs |
| Page: 1 |

Copyright 2023-Present -The University of Texas Health Science Center at Houston |