
|
|||||
|
 | |
| |
| |
| |
| |
| |
|
Gene: RBCK1 |
Gene summary for RBCK1 |
| Gene information | Species | Human | Gene symbol | RBCK1 | Gene ID | 10616 |
| Gene name | RANBP2-type and C3HC4-type zinc finger containing 1 | |
| Gene Alias | C20orf18 | |
| Cytomap | 20p13 | |
| Gene Type | protein-coding | GO ID | GO:0000209 | UniProtAcc | A6PVK0 |
Top |
Malignant transformation analysis |
| Identification of the aberrant gene expression in precancerous and cancerous lesions by comparing the gene expression of stem-like cells in diseased tissues with normal stem cells |
| Entrez ID | Symbol | Replicates | Species | Organ | Tissue | Adj P-value | Log2FC | Malignancy |
| 10616 | RBCK1 | GSM4909286 | Human | Breast | IDC | 4.22e-02 | -2.05e-01 | 0.1081 |
| 10616 | RBCK1 | GSM4909293 | Human | Breast | IDC | 1.34e-20 | 4.92e-01 | 0.1581 |
| 10616 | RBCK1 | GSM4909297 | Human | Breast | IDC | 1.16e-03 | -1.17e-01 | 0.1517 |
| 10616 | RBCK1 | GSM4909311 | Human | Breast | IDC | 1.14e-18 | -4.55e-02 | 0.1534 |
| 10616 | RBCK1 | GSM4909312 | Human | Breast | IDC | 1.42e-05 | -1.55e-02 | 0.1552 |
| 10616 | RBCK1 | GSM4909317 | Human | Breast | IDC | 4.12e-15 | 5.58e-01 | 0.1355 |
| 10616 | RBCK1 | GSM4909318 | Human | Breast | IDC | 1.45e-07 | 5.93e-01 | 0.2031 |
| 10616 | RBCK1 | GSM4909319 | Human | Breast | IDC | 1.59e-22 | -1.20e-01 | 0.1563 |
| 10616 | RBCK1 | GSM4909320 | Human | Breast | IDC | 2.73e-04 | -1.08e-01 | 0.1575 |
| 10616 | RBCK1 | GSM4909321 | Human | Breast | IDC | 2.06e-09 | -3.43e-02 | 0.1559 |
| 10616 | RBCK1 | brca10 | Human | Breast | Precancer | 2.13e-13 | 5.39e-01 | -0.0029 |
| 10616 | RBCK1 | NCCBC14 | Human | Breast | DCIS | 2.30e-06 | -1.32e-01 | 0.2021 |
| 10616 | RBCK1 | NCCBC5 | Human | Breast | DCIS | 3.72e-08 | 3.89e-03 | 0.2046 |
| 10616 | RBCK1 | P1 | Human | Breast | IDC | 1.87e-12 | -2.14e-02 | 0.1527 |
| 10616 | RBCK1 | DCIS2 | Human | Breast | DCIS | 1.08e-49 | -7.79e-04 | 0.0085 |
| 10616 | RBCK1 | HTA11_3410_2000001011 | Human | Colorectum | AD | 1.88e-09 | 1.41e-01 | 0.0155 |
| 10616 | RBCK1 | HTA11_2487_2000001011 | Human | Colorectum | SER | 4.02e-02 | 3.22e-01 | -0.1808 |
| 10616 | RBCK1 | HTA11_1938_2000001011 | Human | Colorectum | AD | 1.50e-05 | 3.93e-01 | -0.0811 |
| 10616 | RBCK1 | HTA11_78_2000001011 | Human | Colorectum | AD | 8.28e-05 | 1.99e-01 | -0.1088 |
| 10616 | RBCK1 | HTA11_347_2000001011 | Human | Colorectum | AD | 9.54e-16 | 4.82e-01 | -0.1954 |
| Page: 1 2 3 4 5 6 7 8 9 |
| Tissue | Expression Dynamics | Abbreviation |
| Breast | 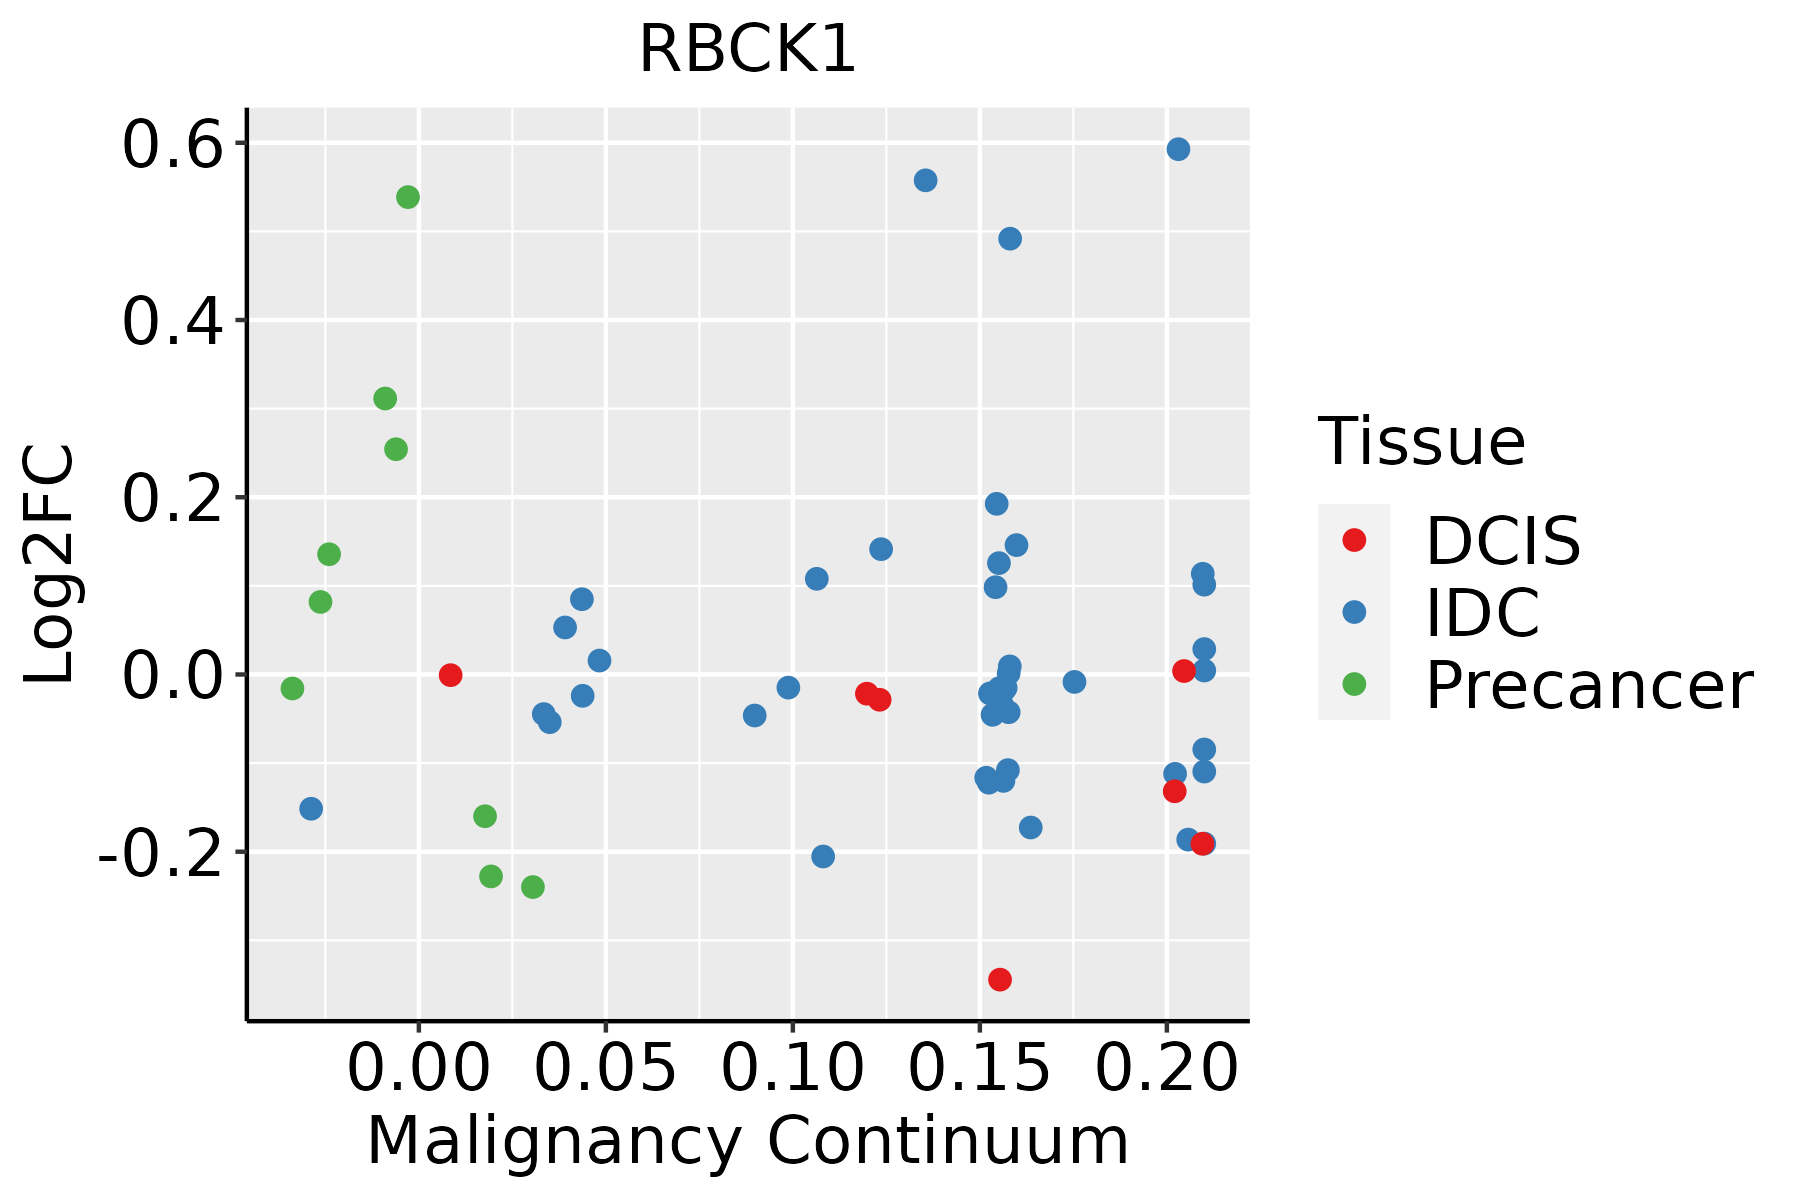 | IDC: Invasive ductal carcinoma |
| DCIS: Ductal carcinoma in situ | ||
| Precancer(BRCA1-mut): Precancerous lesion from BRCA1 mutation carriers | ||
| Colorectum (GSE201348) | 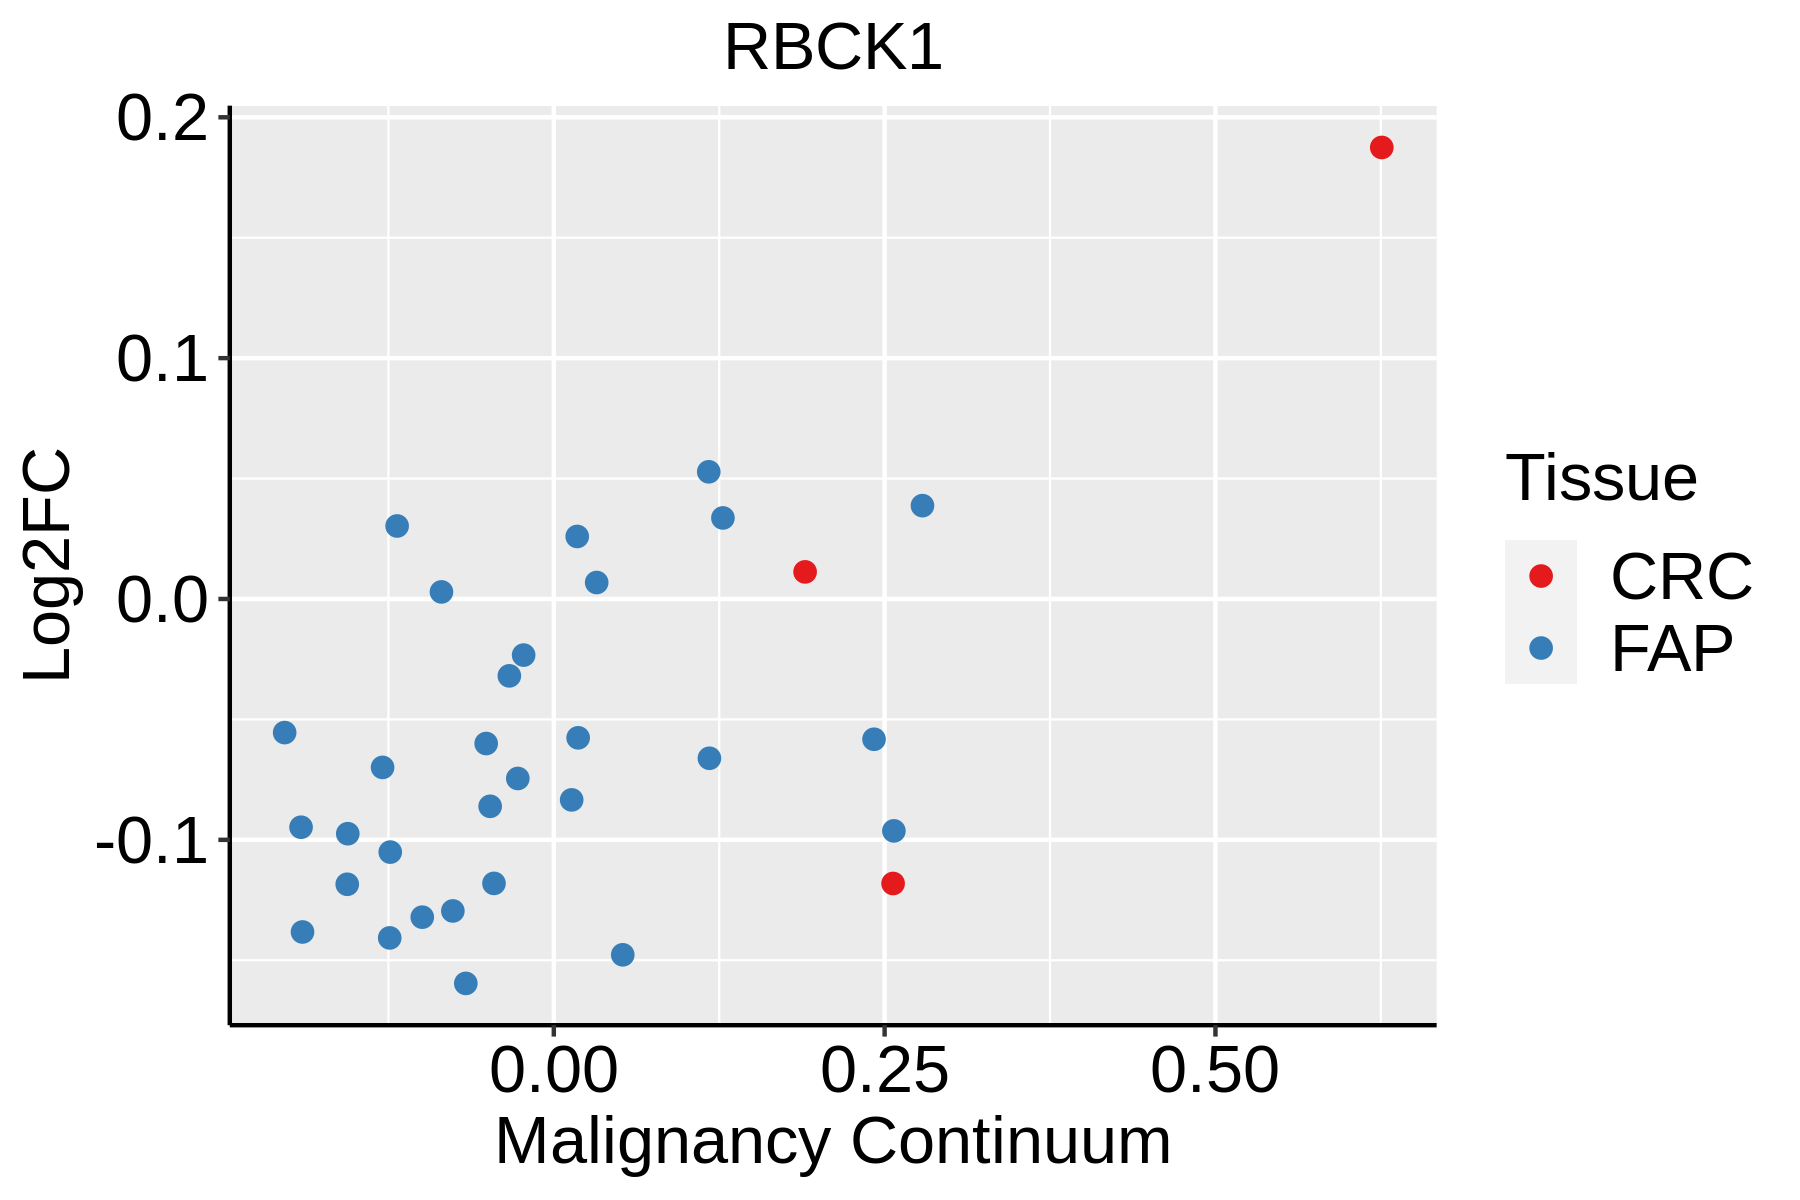 | FAP: Familial adenomatous polyposis |
| CRC: Colorectal cancer | ||
| Colorectum (HTA11) |  | AD: Adenomas |
| SER: Sessile serrated lesions | ||
| MSI-H: Microsatellite-high colorectal cancer | ||
| MSS: Microsatellite stable colorectal cancer | ||
| Esophagus | 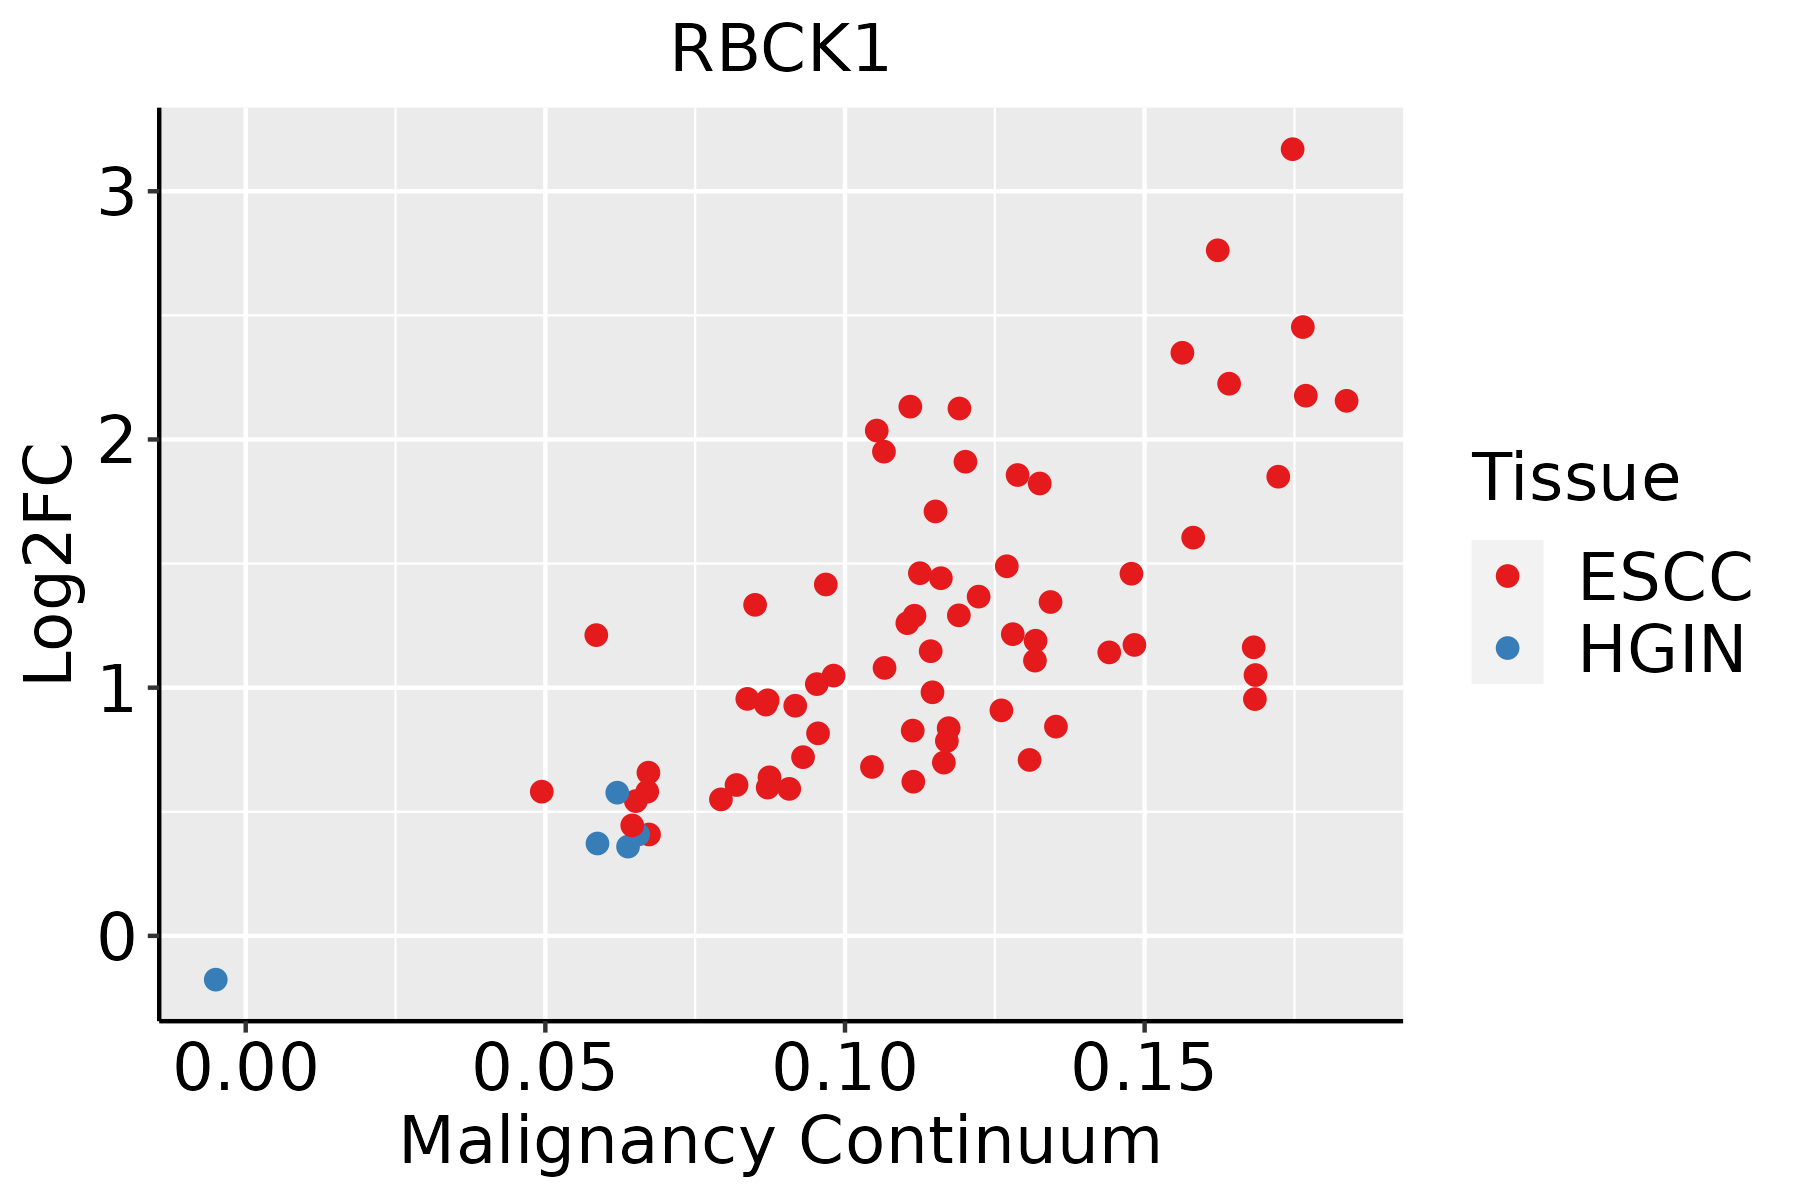 | ESCC: Esophageal squamous cell carcinoma |
| HGIN: High-grade intraepithelial neoplasias | ||
| LGIN: Low-grade intraepithelial neoplasias | ||
| Liver | 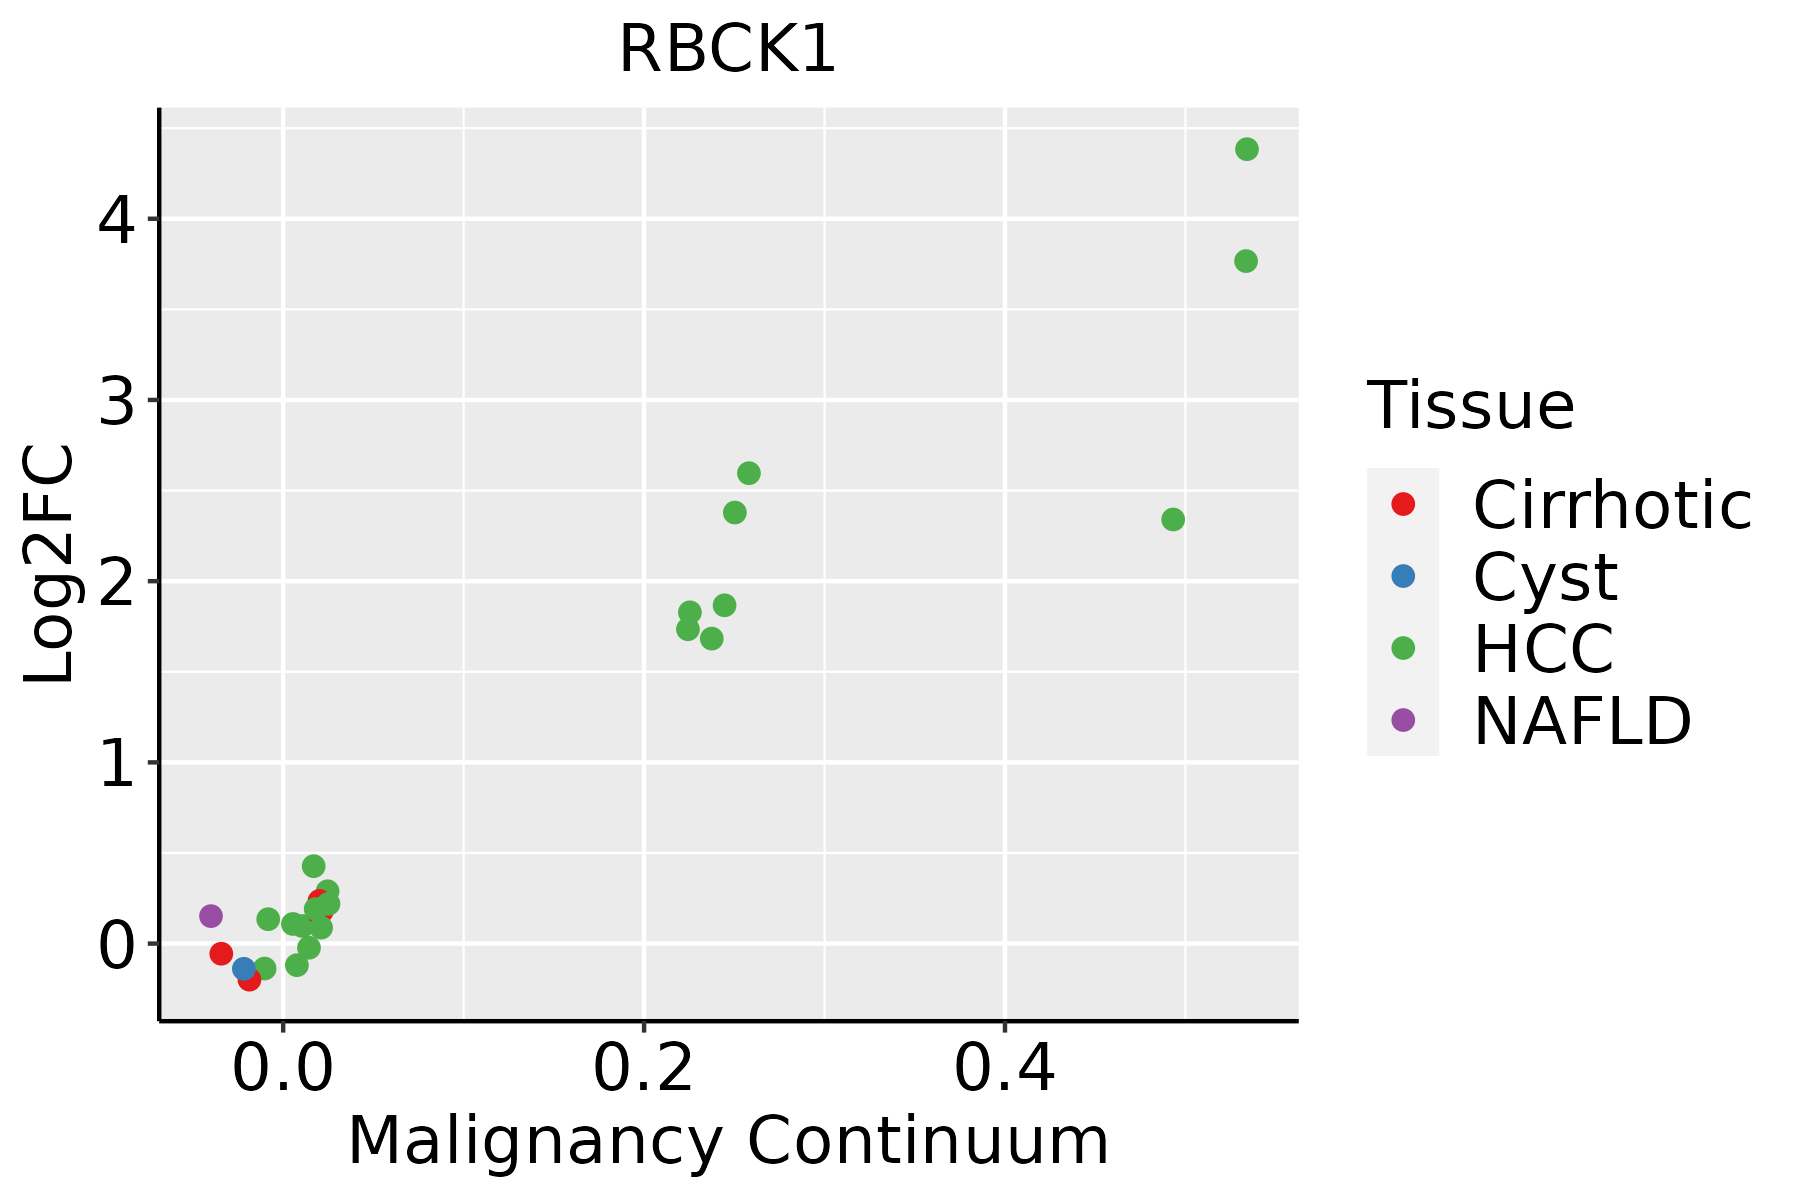 | HCC: Hepatocellular carcinoma |
| NAFLD: Non-alcoholic fatty liver disease | ||
| Oral Cavity | 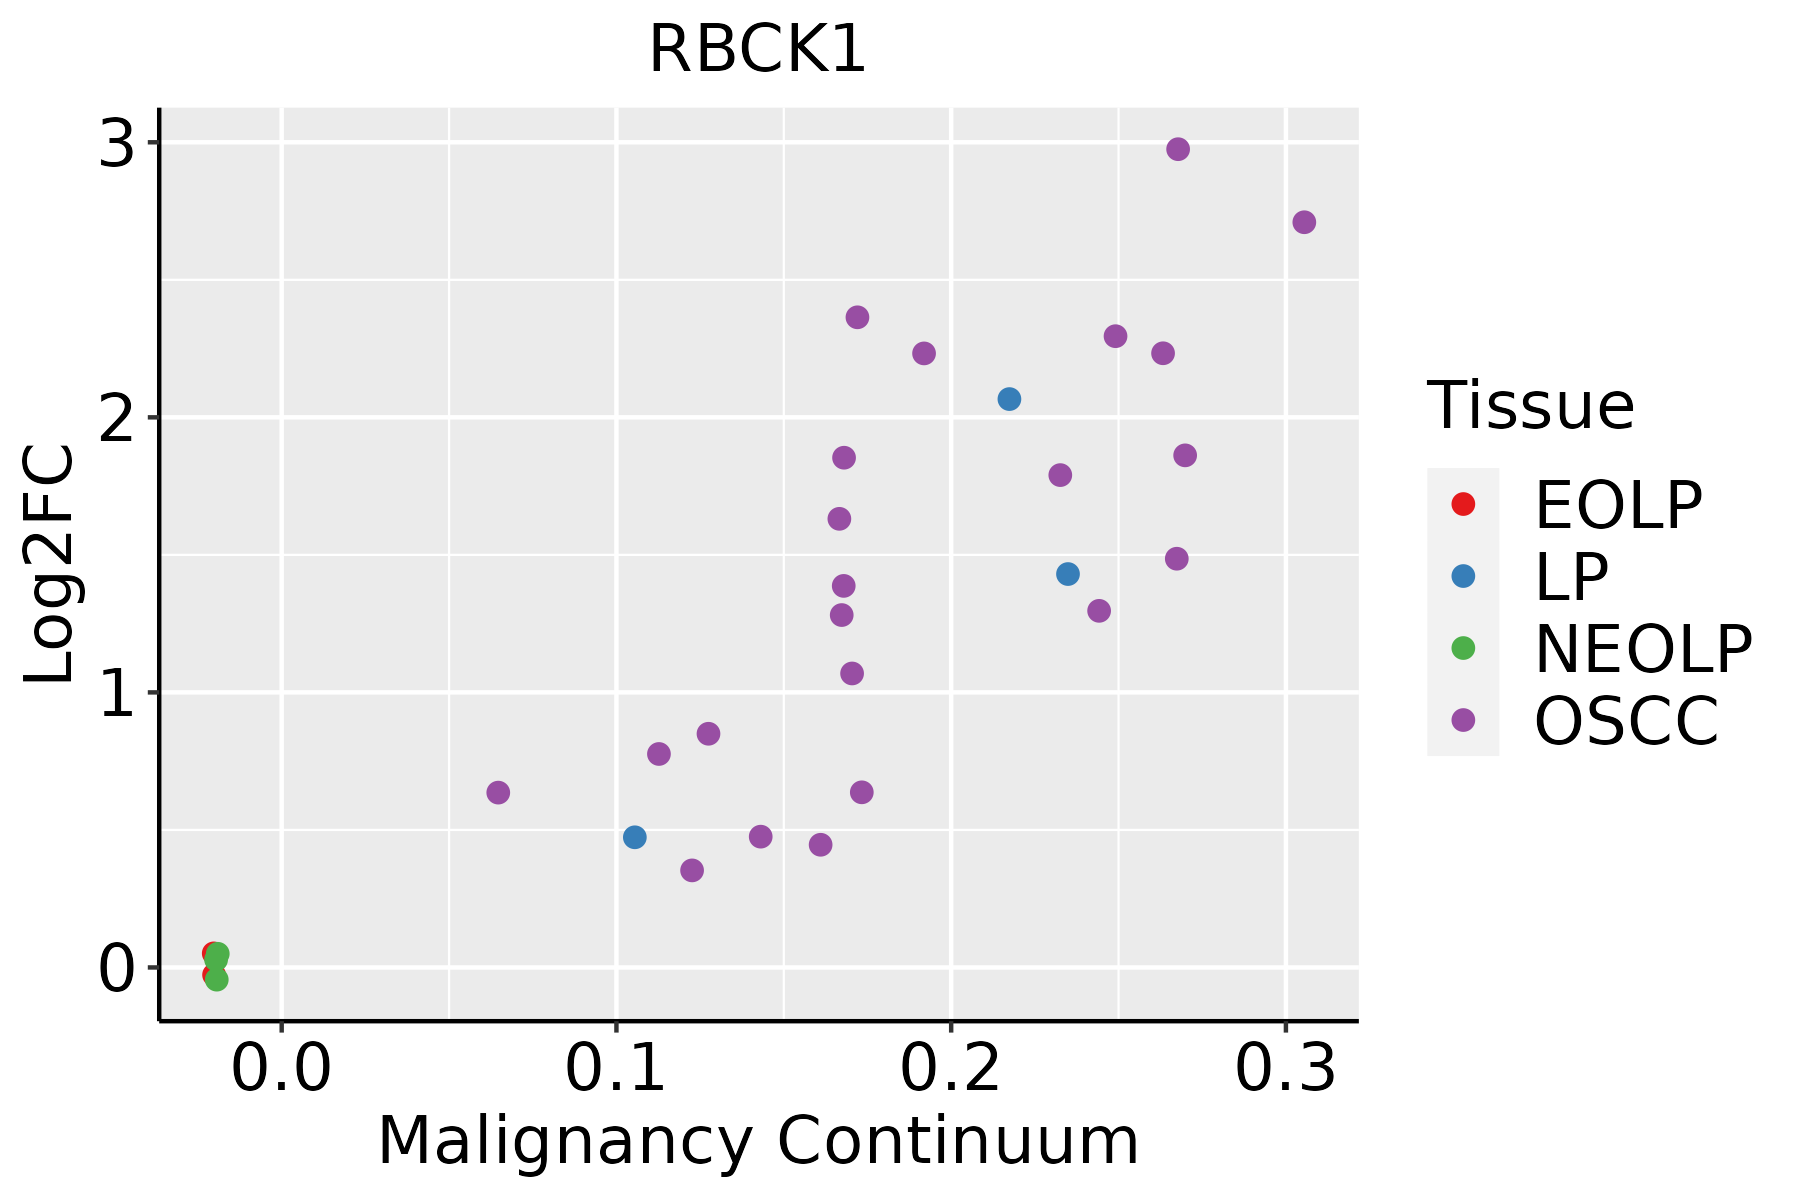 | EOLP: Erosive Oral lichen planus |
| LP: leukoplakia | ||
| NEOLP: Non-erosive oral lichen planus | ||
| OSCC: Oral squamous cell carcinoma | ||
| Prostate | 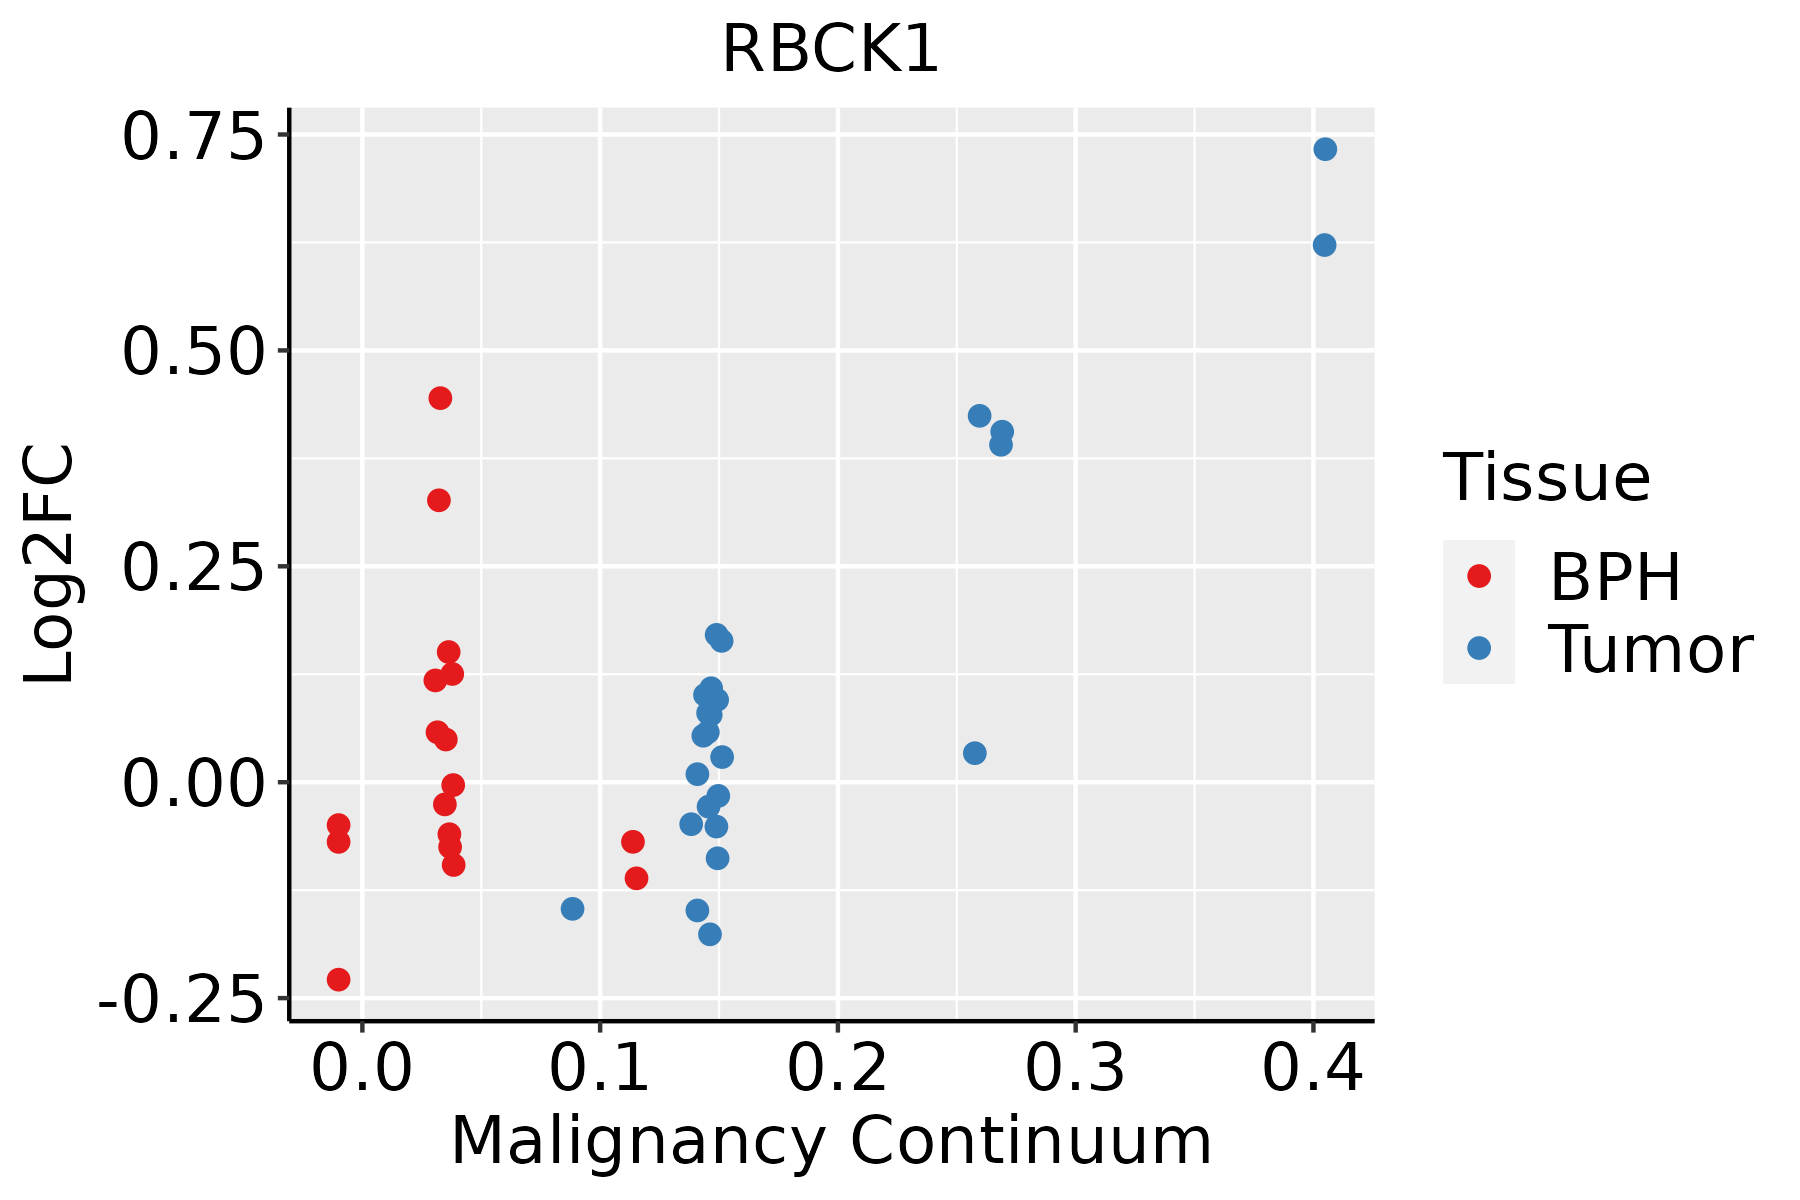 | BPH: Benign Prostatic Hyperplasia |
| Skin | 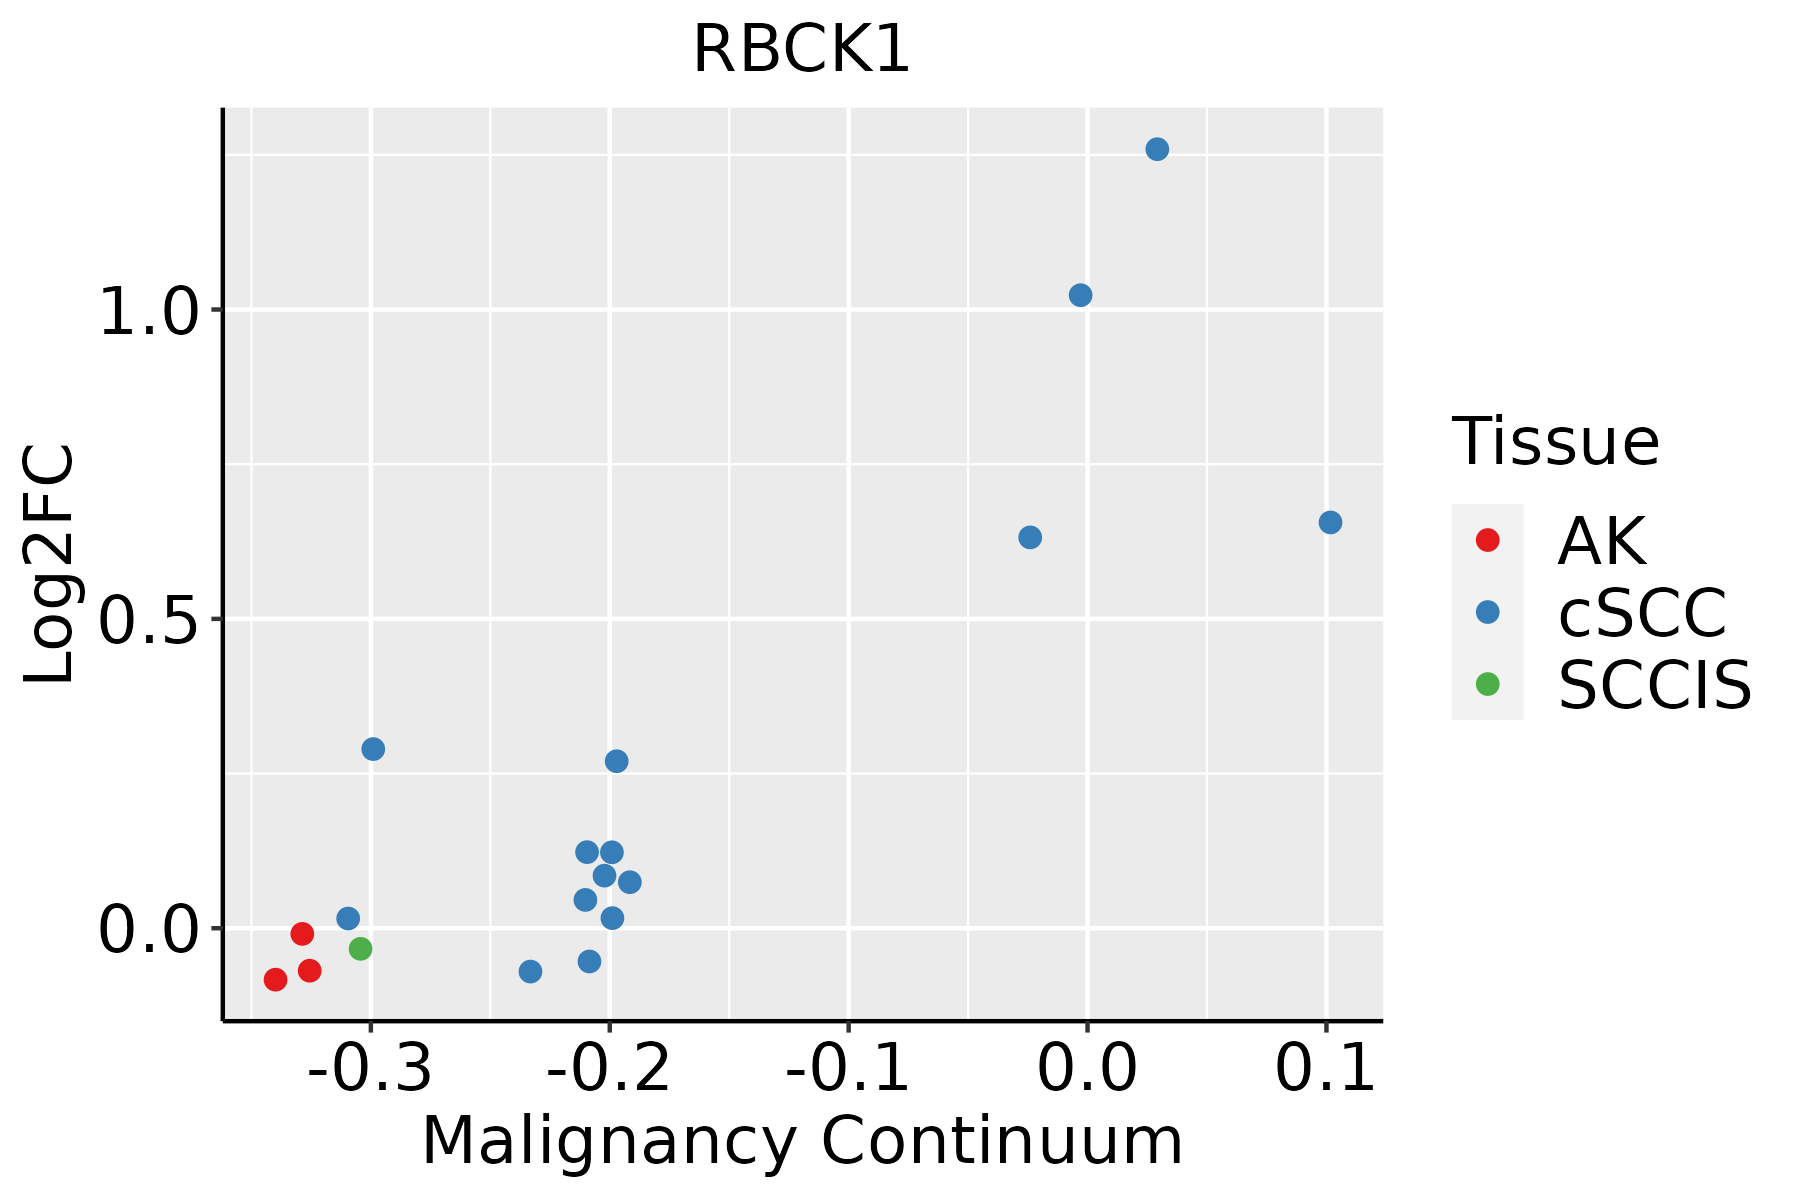 | AK: Actinic keratosis |
| cSCC: Cutaneous squamous cell carcinoma | ||
| SCCIS:squamous cell carcinoma in situ | ||
| Thyroid | 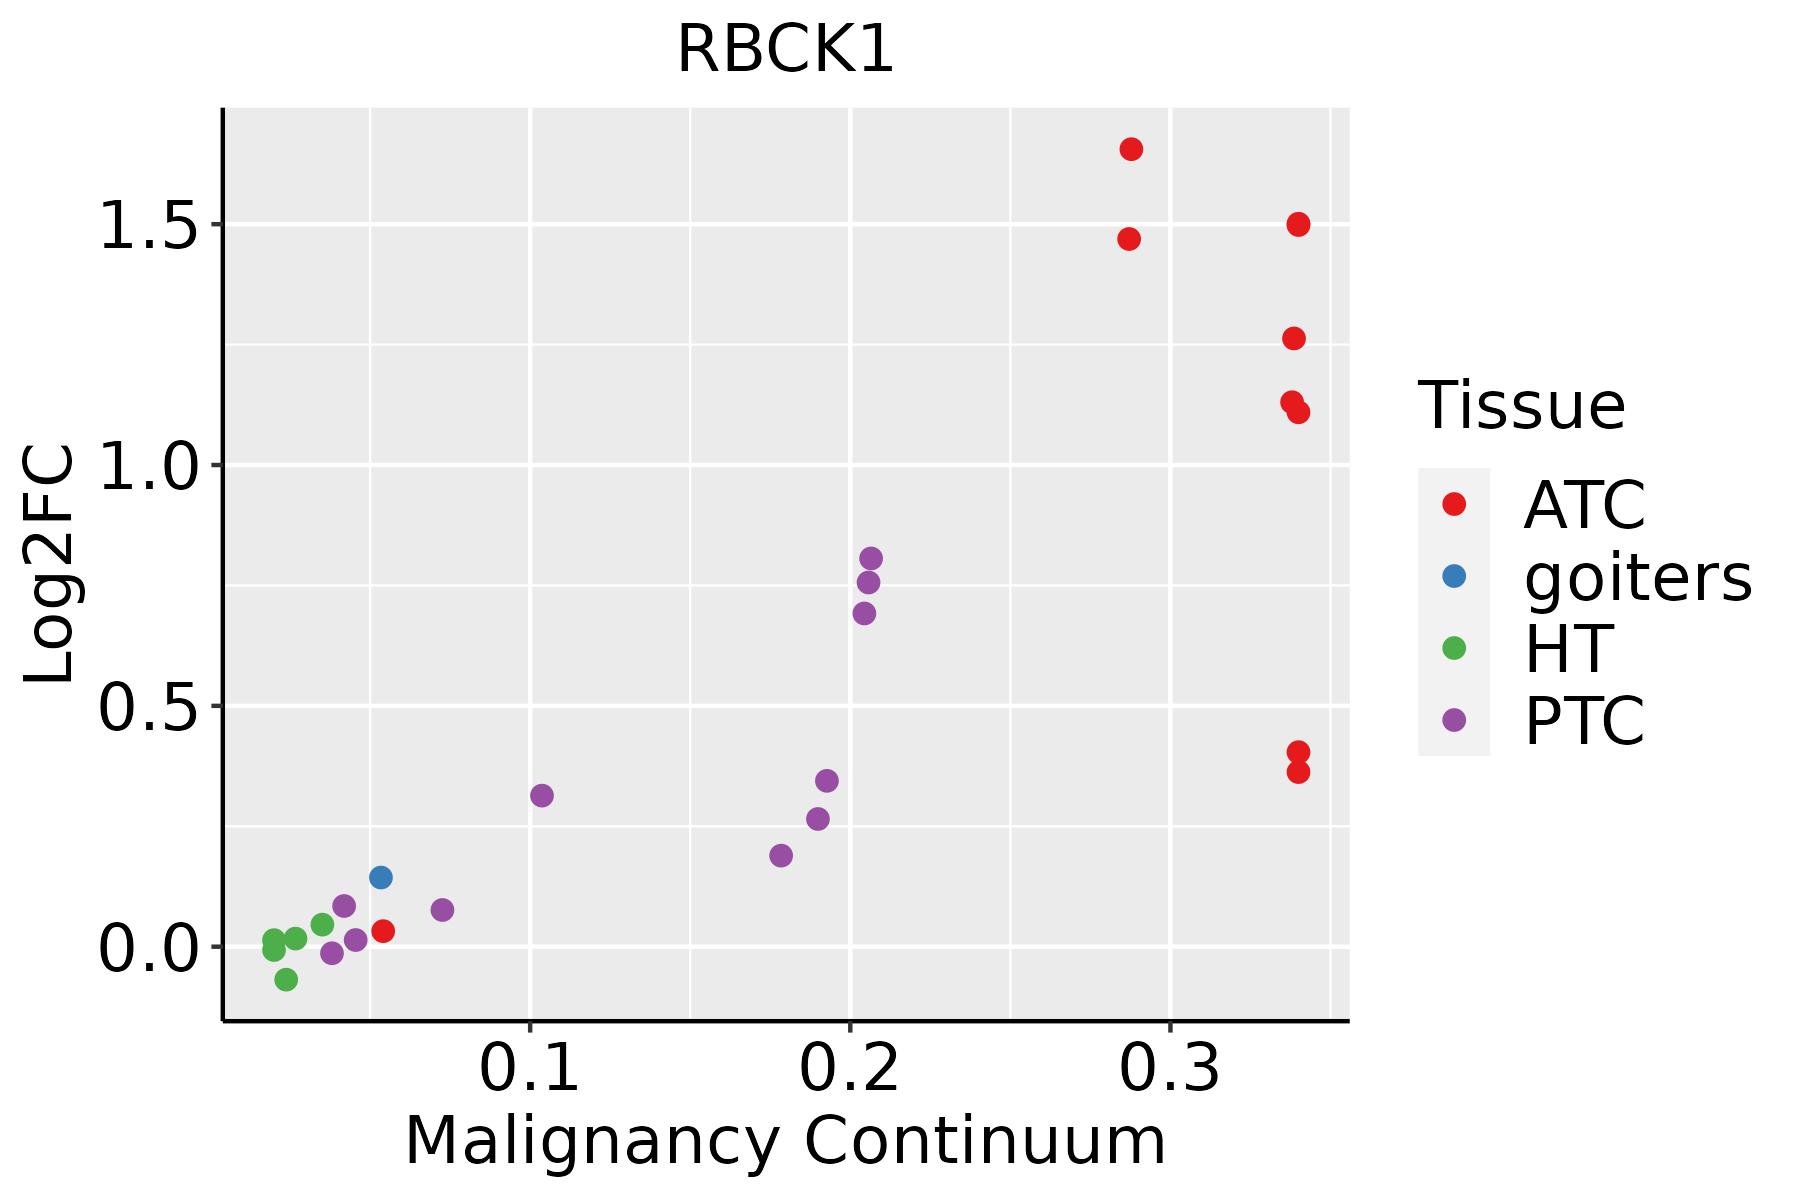 | ATC: Anaplastic thyroid cancer |
| HT: Hashimoto's thyroiditis | ||
| PTC: Papillary thyroid cancer |
| ∗log2FC in expression of this searched gene in stem-like cells from each diseased tissue sample relative to stem-like cells in normal samples in each tissue plotted against the malignancy continuum. Samples are colored based on if they are from different disease stage. |
Top |
Malignant transformation related pathway analysis |
| Find out the enriched GO biological processes and KEGG pathways involved in transition from healthy to precancer to cancer |
| Tissue | Disease Stage | Enriched GO biological Processes |
| Colorectum | AD |  |
| Colorectum | SER |  |
| Colorectum | MSS |  |
| Colorectum | MSI-H |  |
| Colorectum | FAP |  |
| ∗Top 15 enriched GO BP terms are showed in the bar plot of each disease state in each tissue. Each row represents a significant GO biological process which is colored according to the -log10(p.adjust). |
| Page: 1 2 3 4 5 6 7 8 9 |
| GO ID | Tissue | Disease Stage | Description | Gene Ratio | Bg Ratio | pvalue | p.adjust | Count |
| GO:20012339 | Breast | Precancer | regulation of apoptotic signaling pathway | 65/1080 | 356/18723 | 7.70e-17 | 3.17e-14 | 65 |
| GO:00104989 | Breast | Precancer | proteasomal protein catabolic process | 58/1080 | 490/18723 | 1.54e-07 | 8.05e-06 | 58 |
| GO:20012356 | Breast | Precancer | positive regulation of apoptotic signaling pathway | 24/1080 | 126/18723 | 1.98e-07 | 1.01e-05 | 24 |
| GO:20012369 | Breast | Precancer | regulation of extrinsic apoptotic signaling pathway | 24/1080 | 151/18723 | 5.78e-06 | 1.70e-04 | 24 |
| GO:00971919 | Breast | Precancer | extrinsic apoptotic signaling pathway | 30/1080 | 219/18723 | 9.42e-06 | 2.50e-04 | 30 |
| GO:00431619 | Breast | Precancer | proteasome-mediated ubiquitin-dependent protein catabolic process | 42/1080 | 412/18723 | 2.49e-04 | 3.72e-03 | 42 |
| GO:0010939 | Breast | Precancer | regulation of necrotic cell death | 9/1080 | 42/18723 | 5.42e-04 | 6.97e-03 | 9 |
| GO:0070265 | Breast | Precancer | necrotic cell death | 11/1080 | 62/18723 | 7.54e-04 | 9.01e-03 | 11 |
| GO:00508523 | Breast | Precancer | T cell receptor signaling pathway | 15/1080 | 123/18723 | 4.80e-03 | 3.64e-02 | 15 |
| GO:00072496 | Breast | Precancer | I-kappaB kinase/NF-kappaB signaling | 27/1080 | 281/18723 | 6.58e-03 | 4.53e-02 | 27 |
| GO:200123314 | Breast | IDC | regulation of apoptotic signaling pathway | 82/1434 | 356/18723 | 6.27e-20 | 5.93e-17 | 82 |
| GO:200123514 | Breast | IDC | positive regulation of apoptotic signaling pathway | 31/1434 | 126/18723 | 4.13e-09 | 3.35e-07 | 31 |
| GO:001049814 | Breast | IDC | proteasomal protein catabolic process | 75/1434 | 490/18723 | 5.59e-09 | 4.41e-07 | 75 |
| GO:009719114 | Breast | IDC | extrinsic apoptotic signaling pathway | 42/1434 | 219/18723 | 2.56e-08 | 1.73e-06 | 42 |
| GO:200123614 | Breast | IDC | regulation of extrinsic apoptotic signaling pathway | 32/1434 | 151/18723 | 1.07e-07 | 6.26e-06 | 32 |
| GO:004316114 | Breast | IDC | proteasome-mediated ubiquitin-dependent protein catabolic process | 57/1434 | 412/18723 | 9.55e-06 | 2.68e-04 | 57 |
| GO:20012385 | Breast | IDC | positive regulation of extrinsic apoptotic signaling pathway | 12/1434 | 48/18723 | 2.03e-04 | 3.32e-03 | 12 |
| GO:00431227 | Breast | IDC | regulation of I-kappaB kinase/NF-kappaB signaling | 34/1434 | 249/18723 | 7.18e-04 | 8.77e-03 | 34 |
| GO:000724914 | Breast | IDC | I-kappaB kinase/NF-kappaB signaling | 37/1434 | 281/18723 | 8.58e-04 | 9.98e-03 | 37 |
| GO:00508521 | Breast | IDC | T cell receptor signaling pathway | 20/1434 | 123/18723 | 1.05e-03 | 1.16e-02 | 20 |
| Page: 1 2 3 4 5 6 7 8 9 10 11 12 13 14 |
| Pathway ID | Tissue | Disease Stage | Description | Gene Ratio | Bg Ratio | pvalue | p.adjust | qvalue | Count |
| hsa0513124 | Breast | IDC | Shigellosis | 47/867 | 247/8465 | 1.78e-05 | 2.00e-04 | 1.49e-04 | 47 |
| hsa0513134 | Breast | IDC | Shigellosis | 47/867 | 247/8465 | 1.78e-05 | 2.00e-04 | 1.49e-04 | 47 |
| hsa0513144 | Breast | DCIS | Shigellosis | 46/846 | 247/8465 | 2.06e-05 | 2.38e-04 | 1.75e-04 | 46 |
| hsa0513154 | Breast | DCIS | Shigellosis | 46/846 | 247/8465 | 2.06e-05 | 2.38e-04 | 1.75e-04 | 46 |
| hsa05131 | Colorectum | AD | Shigellosis | 109/2092 | 247/8465 | 1.09e-11 | 2.44e-10 | 1.55e-10 | 109 |
| hsa051311 | Colorectum | AD | Shigellosis | 109/2092 | 247/8465 | 1.09e-11 | 2.44e-10 | 1.55e-10 | 109 |
| hsa051312 | Colorectum | SER | Shigellosis | 87/1580 | 247/8465 | 3.07e-10 | 7.27e-09 | 5.28e-09 | 87 |
| hsa04217 | Colorectum | SER | Necroptosis | 47/1580 | 159/8465 | 5.21e-04 | 4.44e-03 | 3.22e-03 | 47 |
| hsa051313 | Colorectum | SER | Shigellosis | 87/1580 | 247/8465 | 3.07e-10 | 7.27e-09 | 5.28e-09 | 87 |
| hsa042171 | Colorectum | SER | Necroptosis | 47/1580 | 159/8465 | 5.21e-04 | 4.44e-03 | 3.22e-03 | 47 |
| hsa051314 | Colorectum | MSS | Shigellosis | 94/1875 | 247/8465 | 6.82e-09 | 1.34e-07 | 8.23e-08 | 94 |
| hsa051315 | Colorectum | MSS | Shigellosis | 94/1875 | 247/8465 | 6.82e-09 | 1.34e-07 | 8.23e-08 | 94 |
| hsa051318 | Colorectum | FAP | Shigellosis | 76/1404 | 247/8465 | 1.57e-08 | 5.84e-07 | 3.55e-07 | 76 |
| hsa051319 | Colorectum | FAP | Shigellosis | 76/1404 | 247/8465 | 1.57e-08 | 5.84e-07 | 3.55e-07 | 76 |
| hsa0513139 | Esophagus | HGIN | Shigellosis | 71/1383 | 247/8465 | 4.89e-07 | 7.98e-06 | 6.34e-06 | 71 |
| hsa046219 | Esophagus | HGIN | NOD-like receptor signaling pathway | 45/1383 | 186/8465 | 3.40e-03 | 2.54e-02 | 2.02e-02 | 45 |
| hsa05131114 | Esophagus | HGIN | Shigellosis | 71/1383 | 247/8465 | 4.89e-07 | 7.98e-06 | 6.34e-06 | 71 |
| hsa0462114 | Esophagus | HGIN | NOD-like receptor signaling pathway | 45/1383 | 186/8465 | 3.40e-03 | 2.54e-02 | 2.02e-02 | 45 |
| hsa05131211 | Esophagus | ESCC | Shigellosis | 176/4205 | 247/8465 | 2.27e-12 | 4.01e-11 | 2.05e-11 | 176 |
| hsa0462122 | Esophagus | ESCC | NOD-like receptor signaling pathway | 116/4205 | 186/8465 | 2.90e-04 | 1.03e-03 | 5.30e-04 | 116 |
| Page: 1 2 3 |
Top |
Cell-cell communication analysis |
| Identification of potential cell-cell interactions between two cell types and their ligand-receptor pairs for different disease states |
| Ligand | Receptor | LRpair | Pathway | Tissue | Disease Stage |
| Page: 1 |
Top |
Single-cell gene regulatory network inference analysis |
| Find out the significant the regulons (TFs) and the target genes of each regulon across cell types for different disease states |
| TF | Cell Type | Tissue | Disease Stage | Target Gene | RSS | Regulon Activity |
| ∗The dot plots of a searched regulon are shown for all cell subpopulations in each disease state of each tissue based on the regulon specific score inferred using pySCENIC and by calculating the average expression. |
| Page: 1 |
Top |
Somatic mutation of malignant transformation related genes |
| Annotation of somatic variants for genes involved in malignant transformation |
| Hugo Symbol | Variant Class | Variant Classification | dbSNP RS | HGVSc | HGVSp | HGVSp Short | SWISSPROT | BIOTYPE | SIFT | PolyPhen | Tumor Sample Barcode | Tissue | Histology | Sex | Age | Stage | Therapy Types | Drugs | Outcome |
| RBCK1 | SNV | Missense_Mutation | novel | c.1515C>G | p.Ser505Arg | p.S505R | Q9BYM8 | protein_coding | tolerated(0.61) | benign(0.022) | TCGA-C5-A1M6-01 | Cervix | cervical & endocervical cancer | Female | <65 | I/II | Chemotherapy | cisplatin | PD |
| RBCK1 | SNV | Missense_Mutation | novel | c.538G>A | p.Glu180Lys | p.E180K | Q9BYM8 | protein_coding | tolerated(0.68) | benign(0.007) | TCGA-C5-A2LZ-01 | Cervix | cervical & endocervical cancer | Female | >=65 | III/IV | Unknown | Unknown | PD |
| RBCK1 | SNV | Missense_Mutation | rs752153553 | c.317G>A | p.Arg106Gln | p.R106Q | Q9BYM8 | protein_coding | tolerated(0.34) | benign(0.321) | TCGA-A6-6782-01 | Colorectum | colon adenocarcinoma | Male | >=65 | I/II | Unknown | Unknown | SD |
| RBCK1 | SNV | Missense_Mutation | novel | c.1481G>A | p.Arg494His | p.R494H | Q9BYM8 | protein_coding | deleterious(0) | possibly_damaging(0.644) | TCGA-AA-A010-01 | Colorectum | colon adenocarcinoma | Female | <65 | I/II | Chemotherapy | folinic | CR |
| RBCK1 | SNV | Missense_Mutation | c.386N>G | p.Tyr129Cys | p.Y129C | Q9BYM8 | protein_coding | deleterious(0) | possibly_damaging(0.87) | TCGA-CK-4951-01 | Colorectum | colon adenocarcinoma | Female | >=65 | I/II | Unknown | Unknown | PD | |
| RBCK1 | SNV | Missense_Mutation | rs139191851 | c.401N>A | p.Arg134His | p.R134H | Q9BYM8 | protein_coding | tolerated(0.62) | benign(0) | TCGA-CM-4746-01 | Colorectum | colon adenocarcinoma | Male | <65 | I/II | Unknown | Unknown | SD |
| RBCK1 | SNV | Missense_Mutation | c.769C>G | p.Gln257Glu | p.Q257E | Q9BYM8 | protein_coding | tolerated(1) | benign(0) | TCGA-CM-6172-01 | Colorectum | colon adenocarcinoma | Female | >=65 | III/IV | Ancillary | leucovorin | SD | |
| RBCK1 | SNV | Missense_Mutation | c.544N>A | p.Gly182Arg | p.G182R | Q9BYM8 | protein_coding | tolerated(0.51) | benign(0.046) | TCGA-DM-A28C-01 | Colorectum | colon adenocarcinoma | Male | >=65 | I/II | Unknown | Unknown | PD | |
| RBCK1 | SNV | Missense_Mutation | novel | c.374N>A | p.Ser125Asn | p.S125N | Q9BYM8 | protein_coding | tolerated(0.21) | benign(0.015) | TCGA-A5-A0G2-01 | Endometrium | uterine corpus endometrioid carcinoma | Female | <65 | III/IV | Unknown | Unknown | SD |
| RBCK1 | SNV | Missense_Mutation | rs760689114 | c.1292C>T | p.Thr431Met | p.T431M | Q9BYM8 | protein_coding | deleterious(0) | probably_damaging(0.999) | TCGA-A5-A0VP-01 | Endometrium | uterine corpus endometrioid carcinoma | Female | >=65 | I/II | Unknown | Unknown | SD |
| Page: 1 2 3 4 |
Top |
Related drugs of malignant transformation related genes |
| Identification of chemicals and drugs interact with genes involved in malignant transfromation |
| (DGIdb 4.0) |
| Entrez ID | Symbol | Category | Interaction Types | Drug Claim Name | Drug Name | PMIDs |
| Page: 1 |

Copyright 2023-Present -The University of Texas Health Science Center at Houston |