
|
|||||
|
 | |
| |
| |
| |
| |
| |
|
Gene: RBBP7 |
Gene summary for RBBP7 |
| Gene information | Species | Human | Gene symbol | RBBP7 | Gene ID | 5931 |
| Gene name | RB binding protein 7, chromatin remodeling factor | |
| Gene Alias | RbAp46 | |
| Cytomap | Xp22.2 | |
| Gene Type | protein-coding | GO ID | GO:0000122 | UniProtAcc | Q16576 |
Top |
Malignant transformation analysis |
| Identification of the aberrant gene expression in precancerous and cancerous lesions by comparing the gene expression of stem-like cells in diseased tissues with normal stem cells |
| Entrez ID | Symbol | Replicates | Species | Organ | Tissue | Adj P-value | Log2FC | Malignancy |
| 5931 | RBBP7 | GSM4909281 | Human | Breast | IDC | 7.40e-17 | 5.21e-01 | 0.21 |
| 5931 | RBBP7 | GSM4909282 | Human | Breast | IDC | 3.33e-12 | 4.31e-01 | -0.0288 |
| 5931 | RBBP7 | GSM4909285 | Human | Breast | IDC | 4.81e-15 | 4.22e-01 | 0.21 |
| 5931 | RBBP7 | GSM4909293 | Human | Breast | IDC | 7.42e-14 | 3.59e-01 | 0.1581 |
| 5931 | RBBP7 | GSM4909296 | Human | Breast | IDC | 4.81e-02 | -1.27e-01 | 0.1524 |
| 5931 | RBBP7 | GSM4909305 | Human | Breast | IDC | 8.01e-04 | 2.11e-01 | 0.0436 |
| 5931 | RBBP7 | GSM4909311 | Human | Breast | IDC | 8.96e-14 | -1.73e-01 | 0.1534 |
| 5931 | RBBP7 | GSM4909312 | Human | Breast | IDC | 1.86e-03 | 7.67e-03 | 0.1552 |
| 5931 | RBBP7 | GSM4909317 | Human | Breast | IDC | 2.75e-02 | 5.44e-02 | 0.1355 |
| 5931 | RBBP7 | GSM4909319 | Human | Breast | IDC | 8.05e-16 | -1.31e-01 | 0.1563 |
| 5931 | RBBP7 | GSM4909321 | Human | Breast | IDC | 4.54e-05 | -5.14e-04 | 0.1559 |
| 5931 | RBBP7 | brca2 | Human | Breast | Precancer | 1.37e-03 | 1.57e-01 | -0.024 |
| 5931 | RBBP7 | M1 | Human | Breast | IDC | 4.81e-10 | 3.81e-01 | 0.1577 |
| 5931 | RBBP7 | M5 | Human | Breast | IDC | 3.27e-12 | 8.66e-01 | 0.1598 |
| 5931 | RBBP7 | NCCBC5 | Human | Breast | DCIS | 3.94e-03 | 1.43e-01 | 0.2046 |
| 5931 | RBBP7 | P1 | Human | Breast | IDC | 2.04e-06 | 1.33e-01 | 0.1527 |
| 5931 | RBBP7 | P2 | Human | Breast | IDC | 1.39e-08 | 4.55e-01 | 0.21 |
| 5931 | RBBP7 | DCIS2 | Human | Breast | DCIS | 2.07e-56 | 1.43e-01 | 0.0085 |
| 5931 | RBBP7 | AEH-subject1 | Human | Endometrium | AEH | 1.86e-07 | -1.85e-01 | -0.3059 |
| 5931 | RBBP7 | AEH-subject2 | Human | Endometrium | AEH | 7.52e-07 | -3.06e-01 | -0.2525 |
| Page: 1 2 3 4 5 6 7 8 9 |
| Tissue | Expression Dynamics | Abbreviation |
| Breast |  | IDC: Invasive ductal carcinoma |
| DCIS: Ductal carcinoma in situ | ||
| Precancer(BRCA1-mut): Precancerous lesion from BRCA1 mutation carriers | ||
| Endometrium | 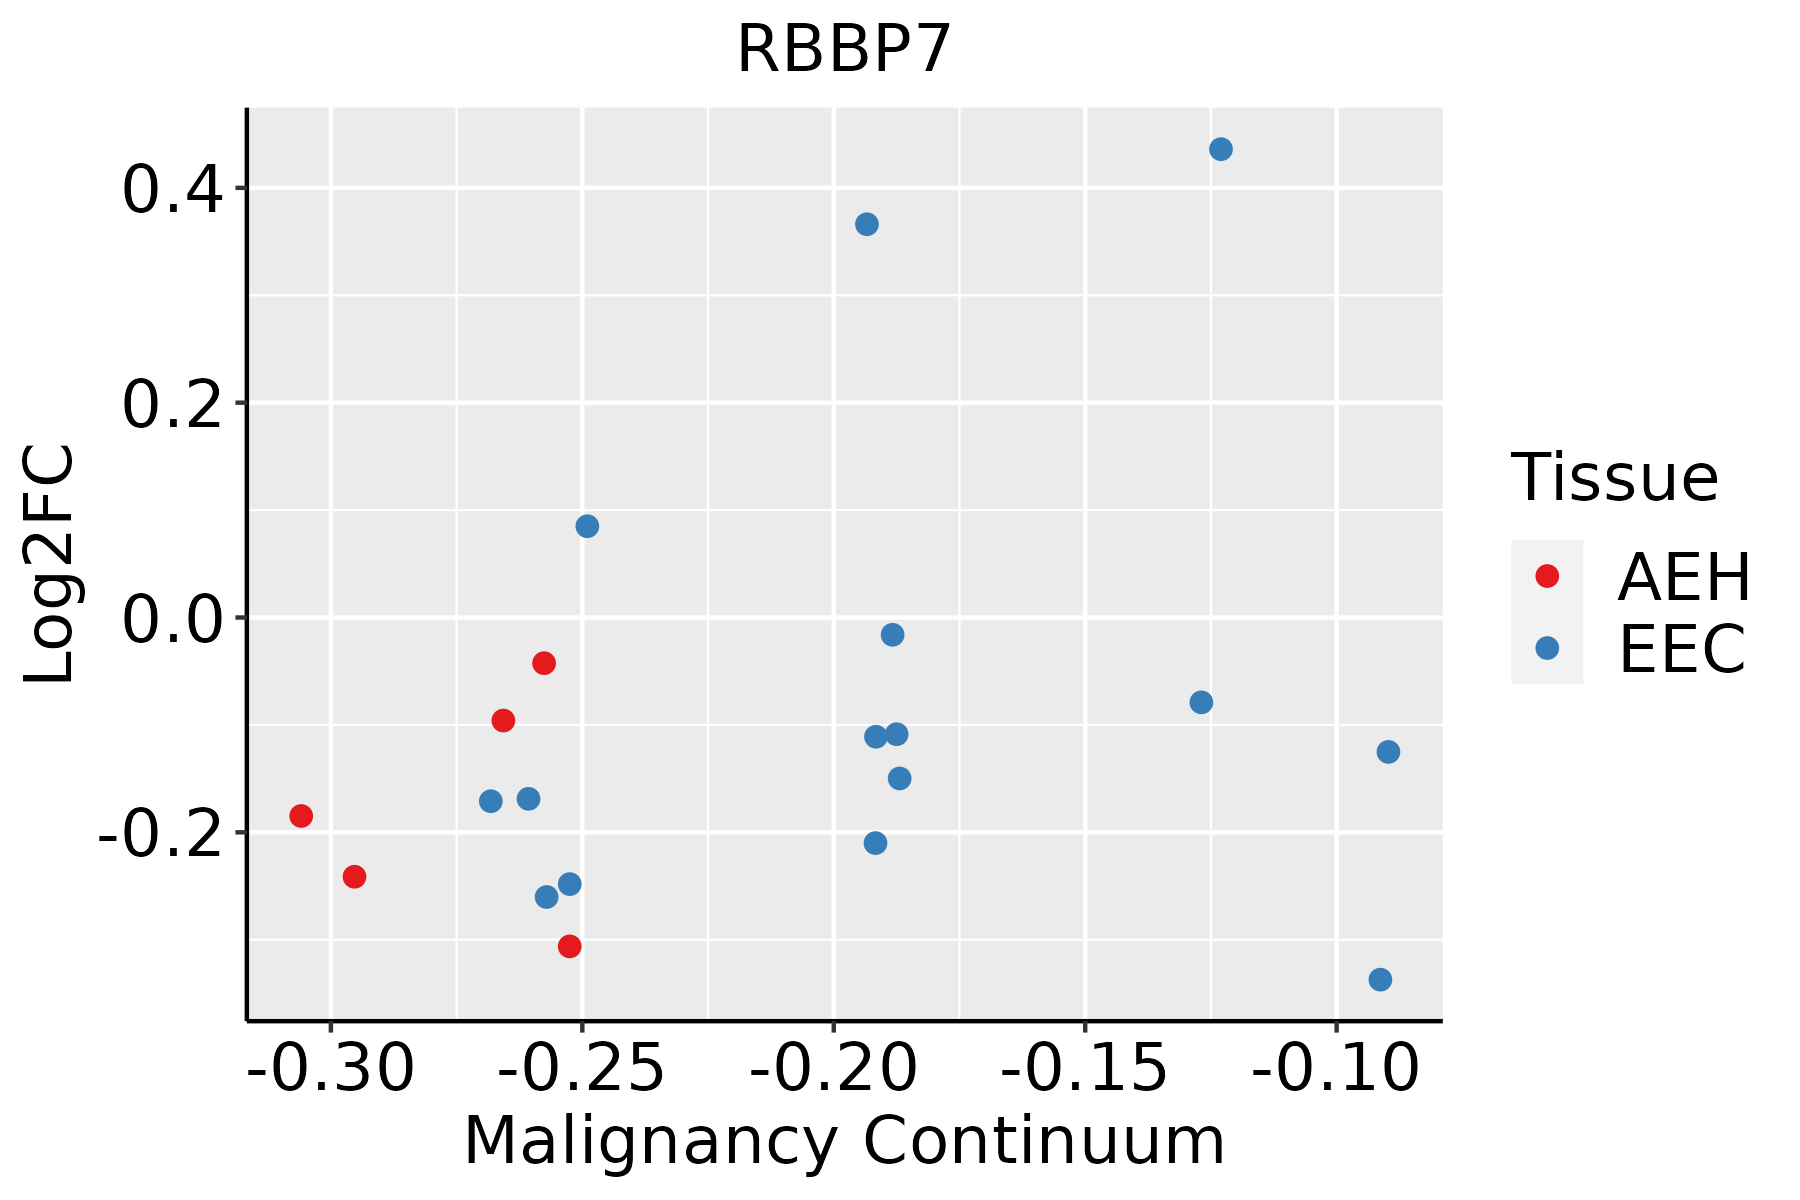 | AEH: Atypical endometrial hyperplasia |
| EEC: Endometrioid Cancer | ||
| Esophagus |  | ESCC: Esophageal squamous cell carcinoma |
| HGIN: High-grade intraepithelial neoplasias | ||
| LGIN: Low-grade intraepithelial neoplasias | ||
| Liver | 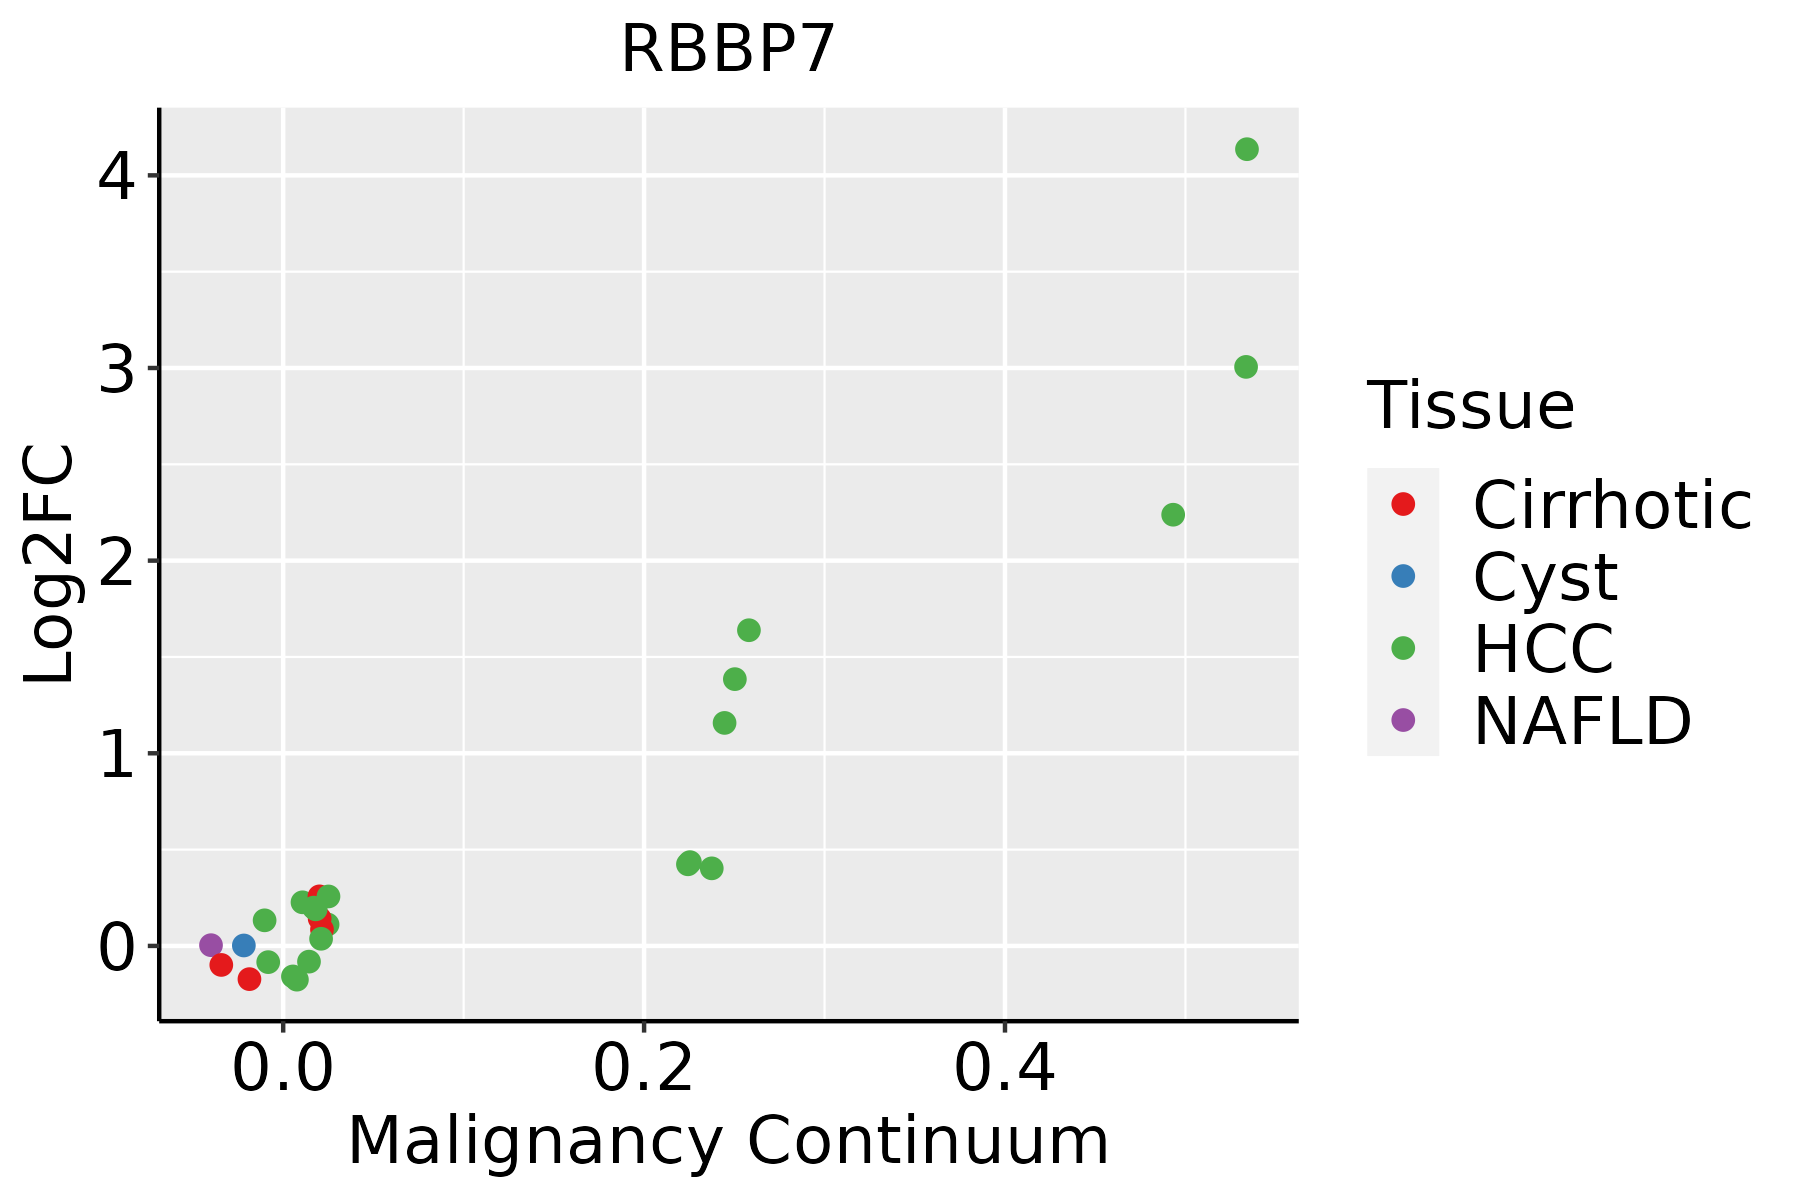 | HCC: Hepatocellular carcinoma |
| NAFLD: Non-alcoholic fatty liver disease | ||
| Oral Cavity |  | EOLP: Erosive Oral lichen planus |
| LP: leukoplakia | ||
| NEOLP: Non-erosive oral lichen planus | ||
| OSCC: Oral squamous cell carcinoma | ||
| Skin |  | AK: Actinic keratosis |
| cSCC: Cutaneous squamous cell carcinoma | ||
| SCCIS:squamous cell carcinoma in situ | ||
| Thyroid |  | ATC: Anaplastic thyroid cancer |
| HT: Hashimoto's thyroiditis | ||
| PTC: Papillary thyroid cancer |
| ∗log2FC in expression of this searched gene in stem-like cells from each diseased tissue sample relative to stem-like cells in normal samples in each tissue plotted against the malignancy continuum. Samples are colored based on if they are from different disease stage. |
Top |
Malignant transformation related pathway analysis |
| Find out the enriched GO biological processes and KEGG pathways involved in transition from healthy to precancer to cancer |
| Tissue | Disease Stage | Enriched GO biological Processes |
| Colorectum | AD |  |
| Colorectum | SER |  |
| Colorectum | MSS |  |
| Colorectum | MSI-H |  |
| Colorectum | FAP |  |
| ∗Top 15 enriched GO BP terms are showed in the bar plot of each disease state in each tissue. Each row represents a significant GO biological process which is colored according to the -log10(p.adjust). |
| Page: 1 2 3 4 5 6 7 8 9 |
| GO ID | Tissue | Disease Stage | Description | Gene Ratio | Bg Ratio | pvalue | p.adjust | Count |
| GO:00485459 | Breast | Precancer | response to steroid hormone | 53/1080 | 339/18723 | 3.07e-11 | 3.66e-09 | 53 |
| GO:00092667 | Breast | Precancer | response to temperature stimulus | 27/1080 | 178/18723 | 3.85e-06 | 1.21e-04 | 27 |
| GO:00346059 | Breast | Precancer | cellular response to heat | 15/1080 | 69/18723 | 7.08e-06 | 1.95e-04 | 15 |
| GO:00094088 | Breast | Precancer | response to heat | 18/1080 | 110/18723 | 5.57e-05 | 1.15e-03 | 18 |
| GO:00160497 | Breast | Precancer | cell growth | 46/1080 | 482/18723 | 5.63e-04 | 7.16e-03 | 46 |
| GO:00015587 | Breast | Precancer | regulation of cell growth | 39/1080 | 414/18723 | 1.81e-03 | 1.78e-02 | 39 |
| GO:004854514 | Breast | IDC | response to steroid hormone | 70/1434 | 339/18723 | 1.34e-14 | 4.23e-12 | 70 |
| GO:000926612 | Breast | IDC | response to temperature stimulus | 34/1434 | 178/18723 | 5.88e-07 | 2.83e-05 | 34 |
| GO:003460513 | Breast | IDC | cellular response to heat | 17/1434 | 69/18723 | 1.26e-05 | 3.29e-04 | 17 |
| GO:000940812 | Breast | IDC | response to heat | 21/1434 | 110/18723 | 8.12e-05 | 1.60e-03 | 21 |
| GO:001604913 | Breast | IDC | cell growth | 56/1434 | 482/18723 | 1.16e-03 | 1.26e-02 | 56 |
| GO:000155813 | Breast | IDC | regulation of cell growth | 49/1434 | 414/18723 | 1.55e-03 | 1.55e-02 | 49 |
| GO:004854524 | Breast | DCIS | response to steroid hormone | 67/1390 | 339/18723 | 1.02e-13 | 2.76e-11 | 67 |
| GO:000926621 | Breast | DCIS | response to temperature stimulus | 30/1390 | 178/18723 | 1.91e-05 | 4.56e-04 | 30 |
| GO:003460522 | Breast | DCIS | cellular response to heat | 16/1390 | 69/18723 | 3.46e-05 | 7.53e-04 | 16 |
| GO:000940821 | Breast | DCIS | response to heat | 19/1390 | 110/18723 | 4.46e-04 | 5.96e-03 | 19 |
| GO:001604923 | Breast | DCIS | cell growth | 54/1390 | 482/18723 | 1.60e-03 | 1.59e-02 | 54 |
| GO:000155822 | Breast | DCIS | regulation of cell growth | 47/1390 | 414/18723 | 2.39e-03 | 2.16e-02 | 47 |
| GO:004854516 | Endometrium | AEH | response to steroid hormone | 76/2100 | 339/18723 | 2.15e-09 | 1.77e-07 | 76 |
| GO:00160499 | Endometrium | AEH | cell growth | 93/2100 | 482/18723 | 1.00e-07 | 4.99e-06 | 93 |
| Page: 1 2 3 4 5 6 7 |
| Pathway ID | Tissue | Disease Stage | Description | Gene Ratio | Bg Ratio | pvalue | p.adjust | qvalue | Count |
| Page: 1 |
Top |
Cell-cell communication analysis |
| Identification of potential cell-cell interactions between two cell types and their ligand-receptor pairs for different disease states |
| Ligand | Receptor | LRpair | Pathway | Tissue | Disease Stage |
| Page: 1 |
Top |
Single-cell gene regulatory network inference analysis |
| Find out the significant the regulons (TFs) and the target genes of each regulon across cell types for different disease states |
| TF | Cell Type | Tissue | Disease Stage | Target Gene | RSS | Regulon Activity |
| ∗The dot plots of a searched regulon are shown for all cell subpopulations in each disease state of each tissue based on the regulon specific score inferred using pySCENIC and by calculating the average expression. |
| Page: 1 |
Top |
Somatic mutation of malignant transformation related genes |
| Annotation of somatic variants for genes involved in malignant transformation |
| Hugo Symbol | Variant Class | Variant Classification | dbSNP RS | HGVSc | HGVSp | HGVSp Short | SWISSPROT | BIOTYPE | SIFT | PolyPhen | Tumor Sample Barcode | Tissue | Histology | Sex | Age | Stage | Therapy Types | Drugs | Outcome |
| RBBP7 | SNV | Missense_Mutation | novel | c.1387G>A | p.Glu463Lys | p.E463K | Q16576 | protein_coding | deleterious(0.02) | benign(0.085) | TCGA-AN-A046-01 | Breast | breast invasive carcinoma | Female | >=65 | I/II | Unknown | Unknown | SD |
| RBBP7 | SNV | Missense_Mutation | novel | c.220C>A | p.Leu74Ile | p.L74I | Q16576 | protein_coding | deleterious(0.01) | possibly_damaging(0.891) | TCGA-AN-A046-01 | Breast | breast invasive carcinoma | Female | >=65 | I/II | Unknown | Unknown | SD |
| RBBP7 | SNV | Missense_Mutation | novel | c.847N>C | p.Glu283Gln | p.E283Q | Q16576 | protein_coding | tolerated(0.12) | benign(0.23) | TCGA-AO-A1KS-01 | Breast | breast invasive carcinoma | Female | >=65 | I/II | Hormone Therapy | arimidex | SD |
| RBBP7 | SNV | Missense_Mutation | novel | c.656N>G | p.His219Arg | p.H219R | Q16576 | protein_coding | deleterious(0) | probably_damaging(0.98) | TCGA-2W-A8YY-01 | Cervix | cervical & endocervical cancer | Female | <65 | I/II | Chemotherapy | cisplatin | CR |
| RBBP7 | SNV | Missense_Mutation | c.1081N>A | p.Asp361Asn | p.D361N | Q16576 | protein_coding | deleterious(0.03) | benign(0.02) | TCGA-IR-A3LA-01 | Cervix | cervical & endocervical cancer | Female | <65 | I/II | Chemotherapy | cisplatin | CR | |
| RBBP7 | SNV | Missense_Mutation | c.514N>T | p.Arg172Cys | p.R172C | Q16576 | protein_coding | deleterious(0.01) | possibly_damaging(0.631) | TCGA-AA-3864-01 | Colorectum | colon adenocarcinoma | Male | >=65 | I/II | Unknown | Unknown | SD | |
| RBBP7 | SNV | Missense_Mutation | rs200756039 | c.1379C>T | p.Thr460Met | p.T460M | Q16576 | protein_coding | tolerated(0.05) | possibly_damaging(0.513) | TCGA-AA-3941-01 | Colorectum | colon adenocarcinoma | Female | >=65 | I/II | Unknown | Unknown | SD |
| RBBP7 | SNV | Missense_Mutation | c.952N>A | p.Glu318Lys | p.E318K | Q16576 | protein_coding | deleterious(0.02) | benign(0.288) | TCGA-AA-A00N-01 | Colorectum | colon adenocarcinoma | Male | >=65 | I/II | Unknown | Unknown | PD | |
| RBBP7 | SNV | Missense_Mutation | c.1069N>A | p.Glu357Lys | p.E357K | Q16576 | protein_coding | deleterious(0.04) | benign(0.023) | TCGA-AA-A010-01 | Colorectum | colon adenocarcinoma | Female | <65 | I/II | Chemotherapy | folinic | CR | |
| RBBP7 | SNV | Missense_Mutation | c.952N>A | p.Glu318Lys | p.E318K | Q16576 | protein_coding | deleterious(0.02) | benign(0.288) | TCGA-AA-A010-01 | Colorectum | colon adenocarcinoma | Female | <65 | I/II | Chemotherapy | folinic | CR |
| Page: 1 2 3 4 5 6 |
Top |
Related drugs of malignant transformation related genes |
| Identification of chemicals and drugs interact with genes involved in malignant transfromation |
| (DGIdb 4.0) |
| Entrez ID | Symbol | Category | Interaction Types | Drug Claim Name | Drug Name | PMIDs |
| Page: 1 |

Copyright 2023-Present -The University of Texas Health Science Center at Houston |