Schematic overview of the cellular and molecular mechanisms involved in the cancer progression, including the proposed cellular and molecular mechanisms in cancer cells trajectory. AT1: alveolar type 1 cells; AT2: alveolar type 2 cells; AAH: atypical adenomatous hyperplasia; AIS: adenocarcinoma in situ; MIA: minimally invasive adenocarcinoma; IA: invasive adenocarcinoma; EMT: epithelial-mesenchymal transition

Home

Download

Statistics

Help

Contact

Center for Computational Systems Medicine
leaf

Gene summary

leaf

Malignant transformation analysis

leaf

Malignant transformation related pathway analysis

leaf

Cell-cell communication analysis

leaf

Single-cell gene regulatory network inference analysis

leaf

Somatic mutation of malignant transformation related genes

leaf

Related drugs of malignant transformation related genes

Gene: RBBP6

Gene summary for RBBP6

check button Gene summary.

Gene informationSpeciesHuman
Gene symbol

RBBP6

Gene ID

5930

Gene nameRB binding protein 6, ubiquitin ligase
Gene AliasMY038
Cytomap16p12.1
Gene Typeprotein-coding
GO ID

GO:0001701

UniProtAcc

Q7Z6E9


Top

Malignant transformation analysis

check button Identification of the aberrant gene expression in precancerous and cancerous lesions by comparing the gene expression of stem-like cells in diseased tissues with normal stem cells
check button Malignant transformation involving gene list.
Entrez IDSymbolReplicatesSpeciesOrganTissueAdj P-valueLog2FCMalignancy
5930RBBP6LZE2THumanEsophagusESCC1.72e-029.83e-010.082
5930RBBP6LZE4THumanEsophagusESCC1.13e-116.71e-010.0811
5930RBBP6LZE7THumanEsophagusESCC3.40e-115.89e-010.0667
5930RBBP6LZE8THumanEsophagusESCC3.85e-081.54e-010.067
5930RBBP6LZE20THumanEsophagusESCC3.66e-077.22e-010.0662
5930RBBP6LZE22THumanEsophagusESCC2.20e-045.50e-010.068
5930RBBP6LZE24THumanEsophagusESCC9.71e-205.76e-010.0596
5930RBBP6LZE21THumanEsophagusESCC1.13e-057.14e-010.0655
5930RBBP6P1T-EHumanEsophagusESCC8.30e-291.85e+000.0875
5930RBBP6P2T-EHumanEsophagusESCC6.54e-831.54e+000.1177
5930RBBP6P4T-EHumanEsophagusESCC1.07e-651.97e+000.1323
5930RBBP6P5T-EHumanEsophagusESCC3.46e-319.42e-010.1327
5930RBBP6P8T-EHumanEsophagusESCC1.46e-501.15e+000.0889
5930RBBP6P9T-EHumanEsophagusESCC1.14e-246.86e-010.1131
5930RBBP6P10T-EHumanEsophagusESCC6.77e-509.78e-010.116
5930RBBP6P11T-EHumanEsophagusESCC1.61e-141.05e+000.1426
5930RBBP6P12T-EHumanEsophagusESCC4.50e-561.38e+000.1122
5930RBBP6P15T-EHumanEsophagusESCC5.77e-328.34e-010.1149
5930RBBP6P16T-EHumanEsophagusESCC1.51e-316.74e-010.1153
5930RBBP6P19T-EHumanEsophagusESCC3.12e-072.44e-010.1662
Page: 1 2 3 4 5 6 7 8 9 

check button Transcriptomic changes along malignancy continuum.
TissueExpression DynamicsAbbreviation
EsophagusThe image shows the transcriptomic changes along malignancy continuum.log2FC in expression of this searched gene in stem-like cells from each diseased tissue sample relative to stem-like cells in normal samples in each tissue plotted against the malignancy continuum. Samples are colored based on if they are from different disease stage.
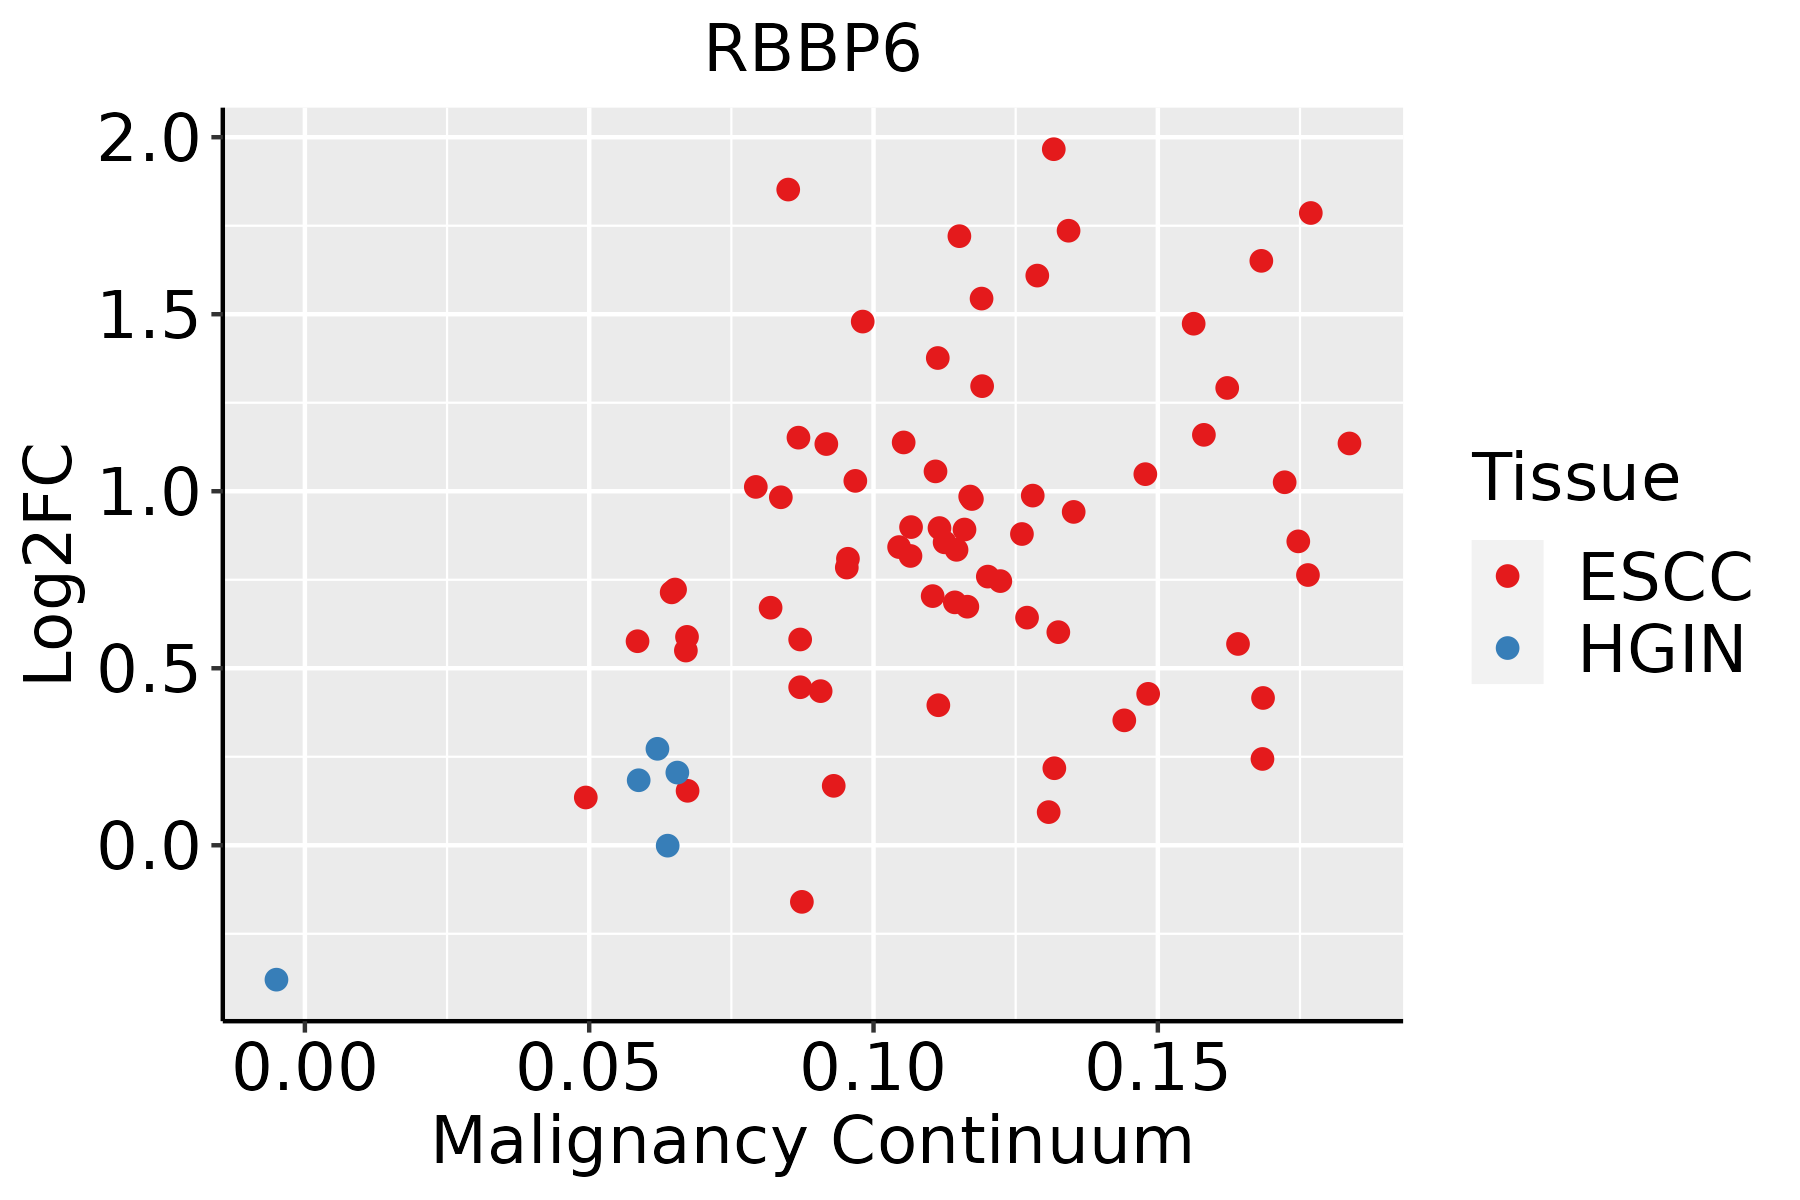
ESCC: Esophageal squamous cell carcinoma
HGIN: High-grade intraepithelial neoplasias
LGIN: Low-grade intraepithelial neoplasias
LiverThe image shows the transcriptomic changes along malignancy continuum.log2FC in expression of this searched gene in stem-like cells from each diseased tissue sample relative to stem-like cells in normal samples in each tissue plotted against the malignancy continuum. Samples are colored based on if they are from different disease stage.HCC: Hepatocellular carcinoma
NAFLD: Non-alcoholic fatty liver disease
LungThe image shows the transcriptomic changes along malignancy continuum.log2FC in expression of this searched gene in stem-like cells from each diseased tissue sample relative to stem-like cells in normal samples in each tissue plotted against the malignancy continuum. Samples are colored based on if they are from different disease stage.
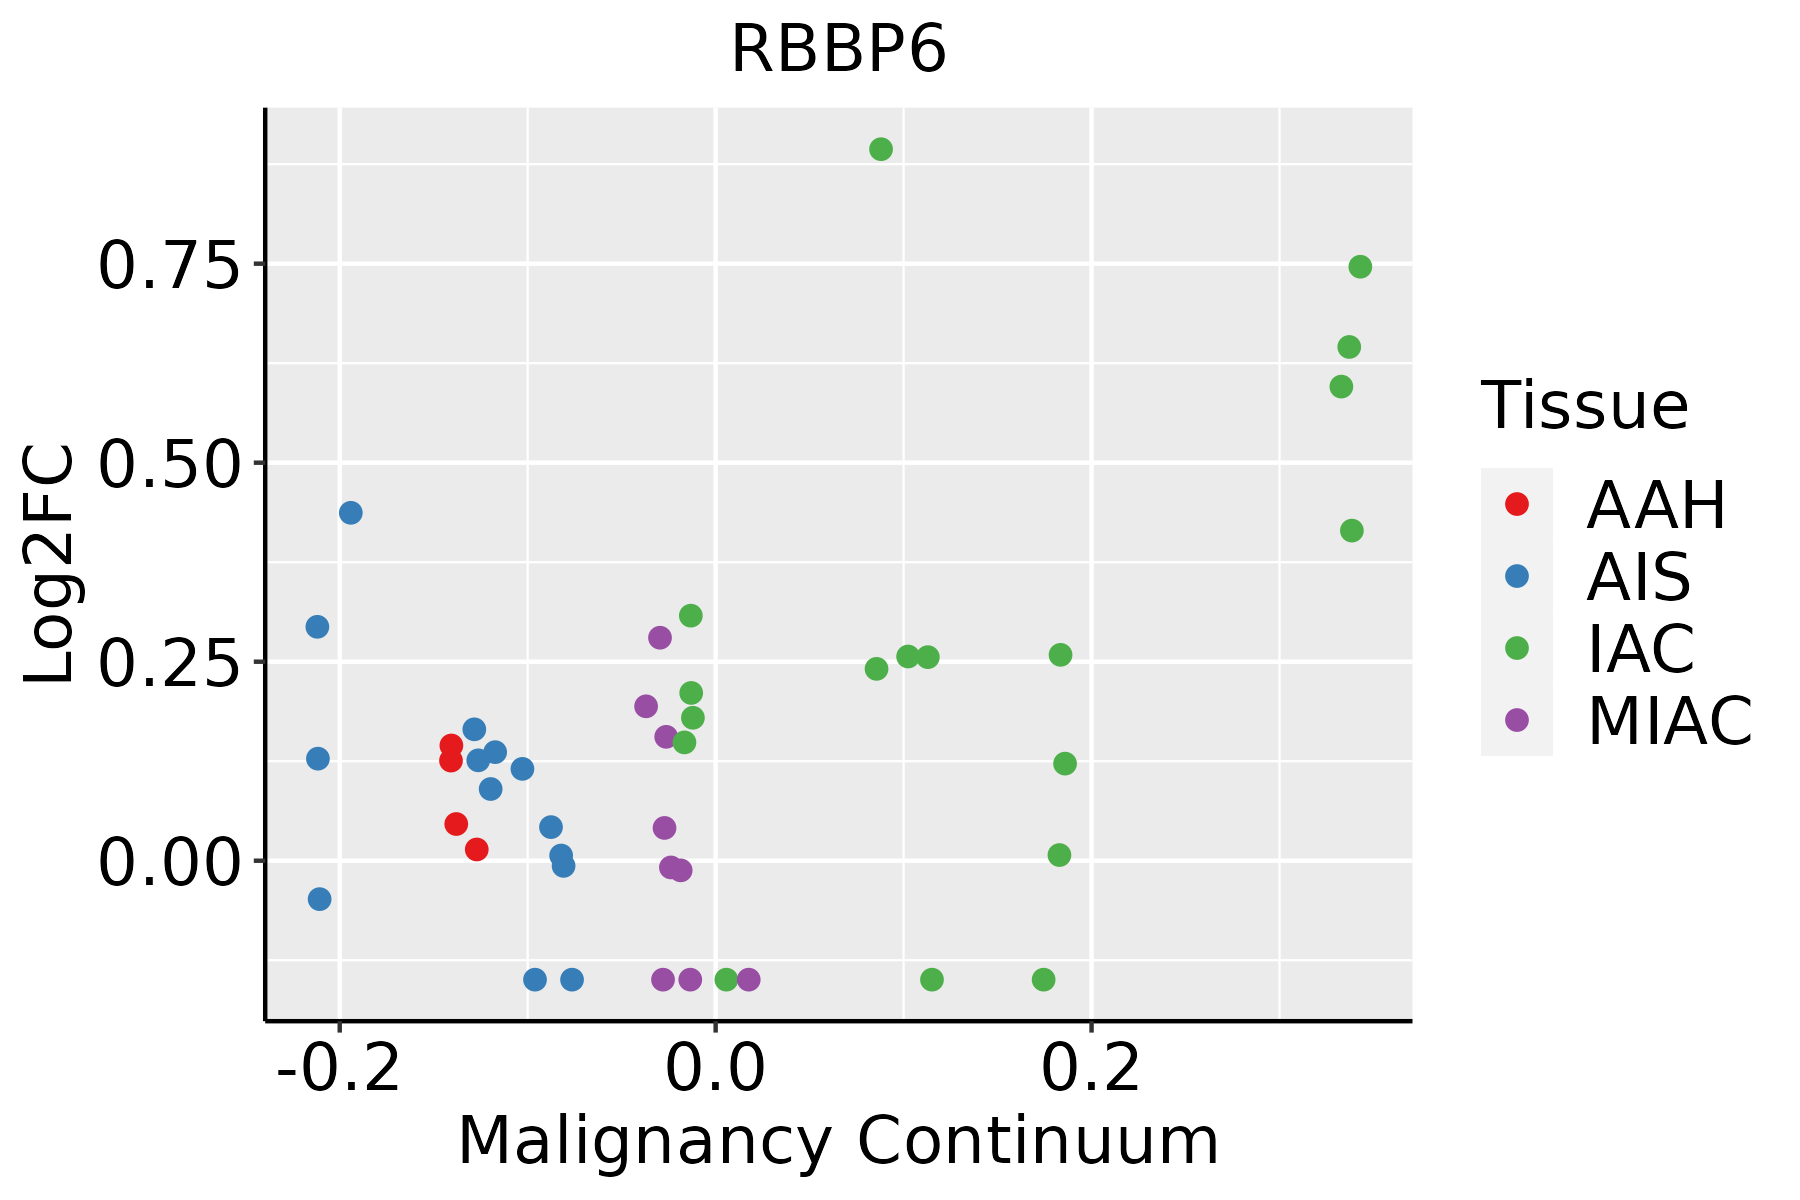
AAH: Atypical adenomatous hyperplasia
AIS: Adenocarcinoma in situ
IAC: Invasive lung adenocarcinoma
MIA: Minimally invasive adenocarcinoma
Oral CavityThe image shows the transcriptomic changes along malignancy continuum.log2FC in expression of this searched gene in stem-like cells from each diseased tissue sample relative to stem-like cells in normal samples in each tissue plotted against the malignancy continuum. Samples are colored based on if they are from different disease stage.
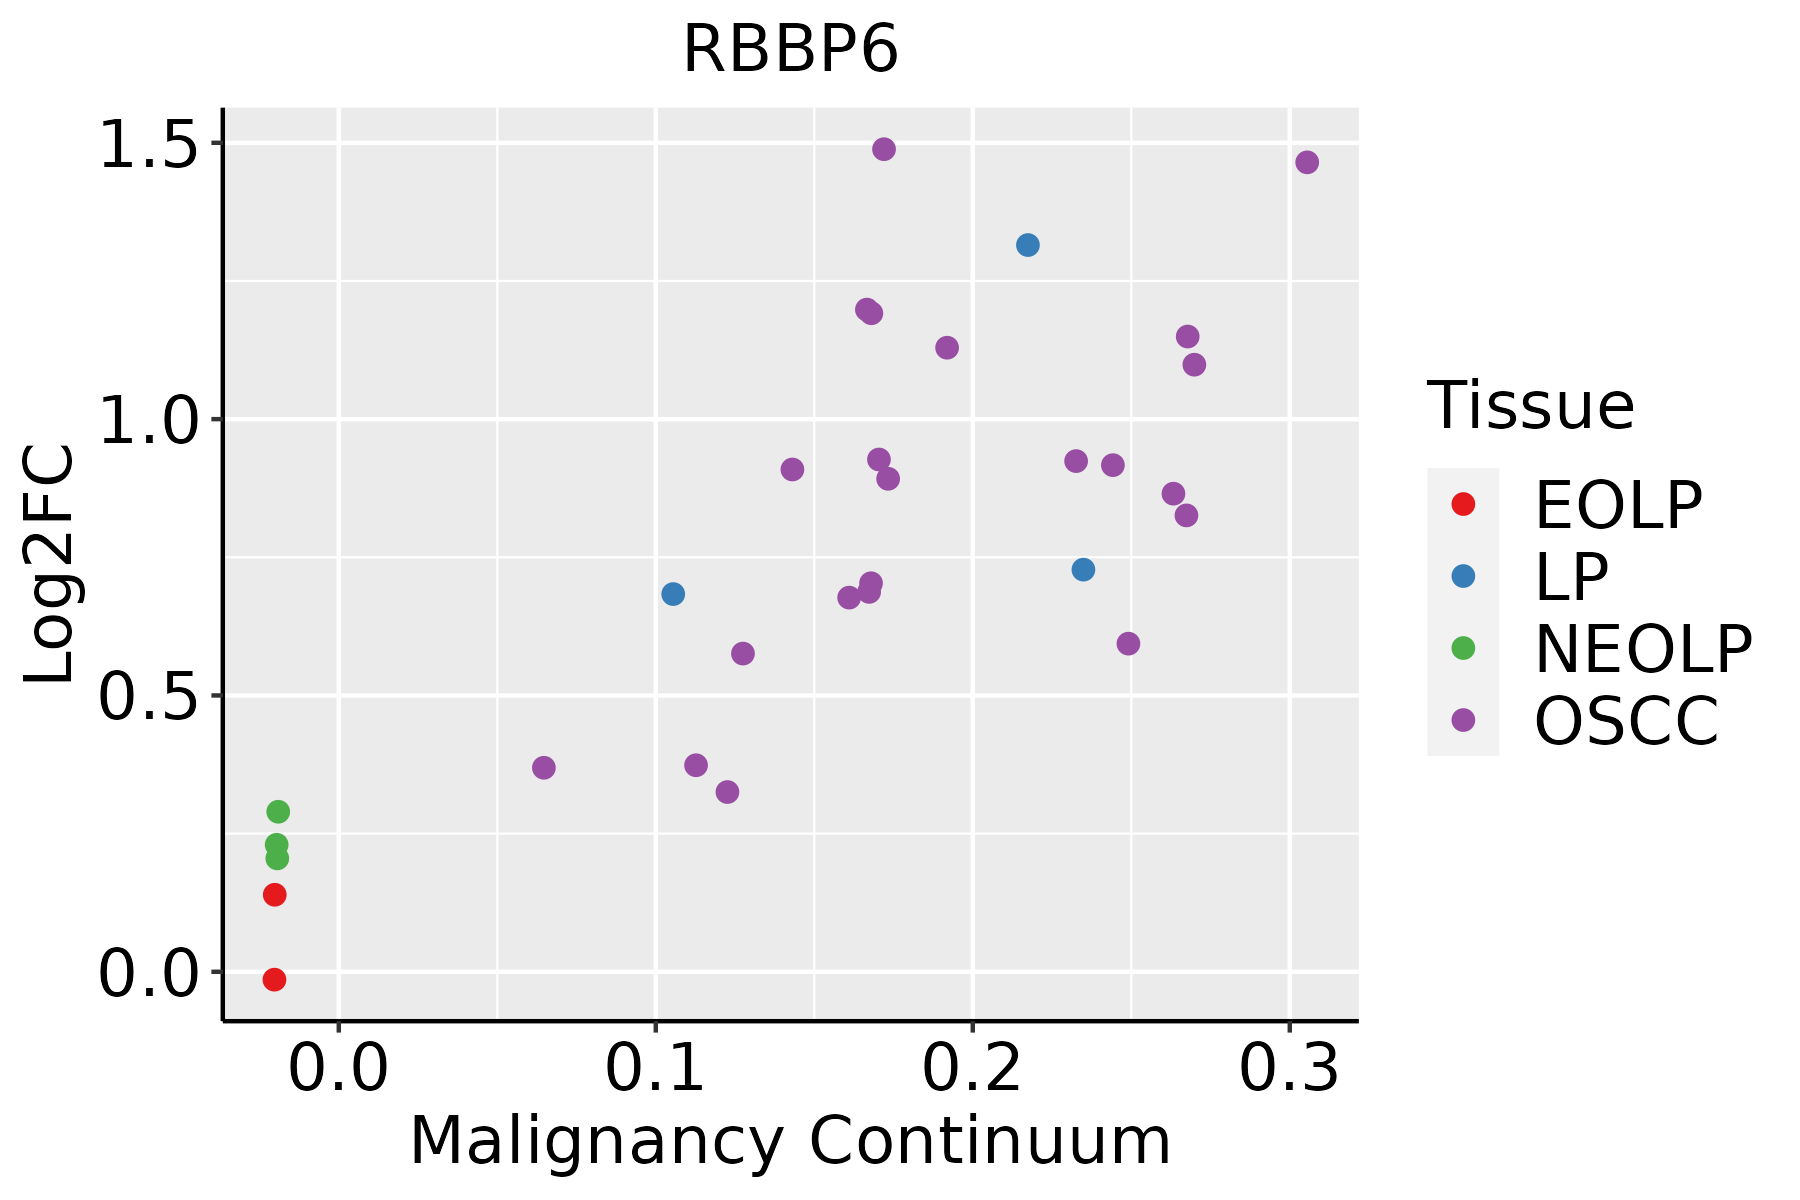
EOLP: Erosive Oral lichen planus
LP: leukoplakia
NEOLP: Non-erosive oral lichen planus
OSCC: Oral squamous cell carcinoma
ProstateThe image shows the transcriptomic changes along malignancy continuum.log2FC in expression of this searched gene in stem-like cells from each diseased tissue sample relative to stem-like cells in normal samples in each tissue plotted against the malignancy continuum. Samples are colored based on if they are from different disease stage.
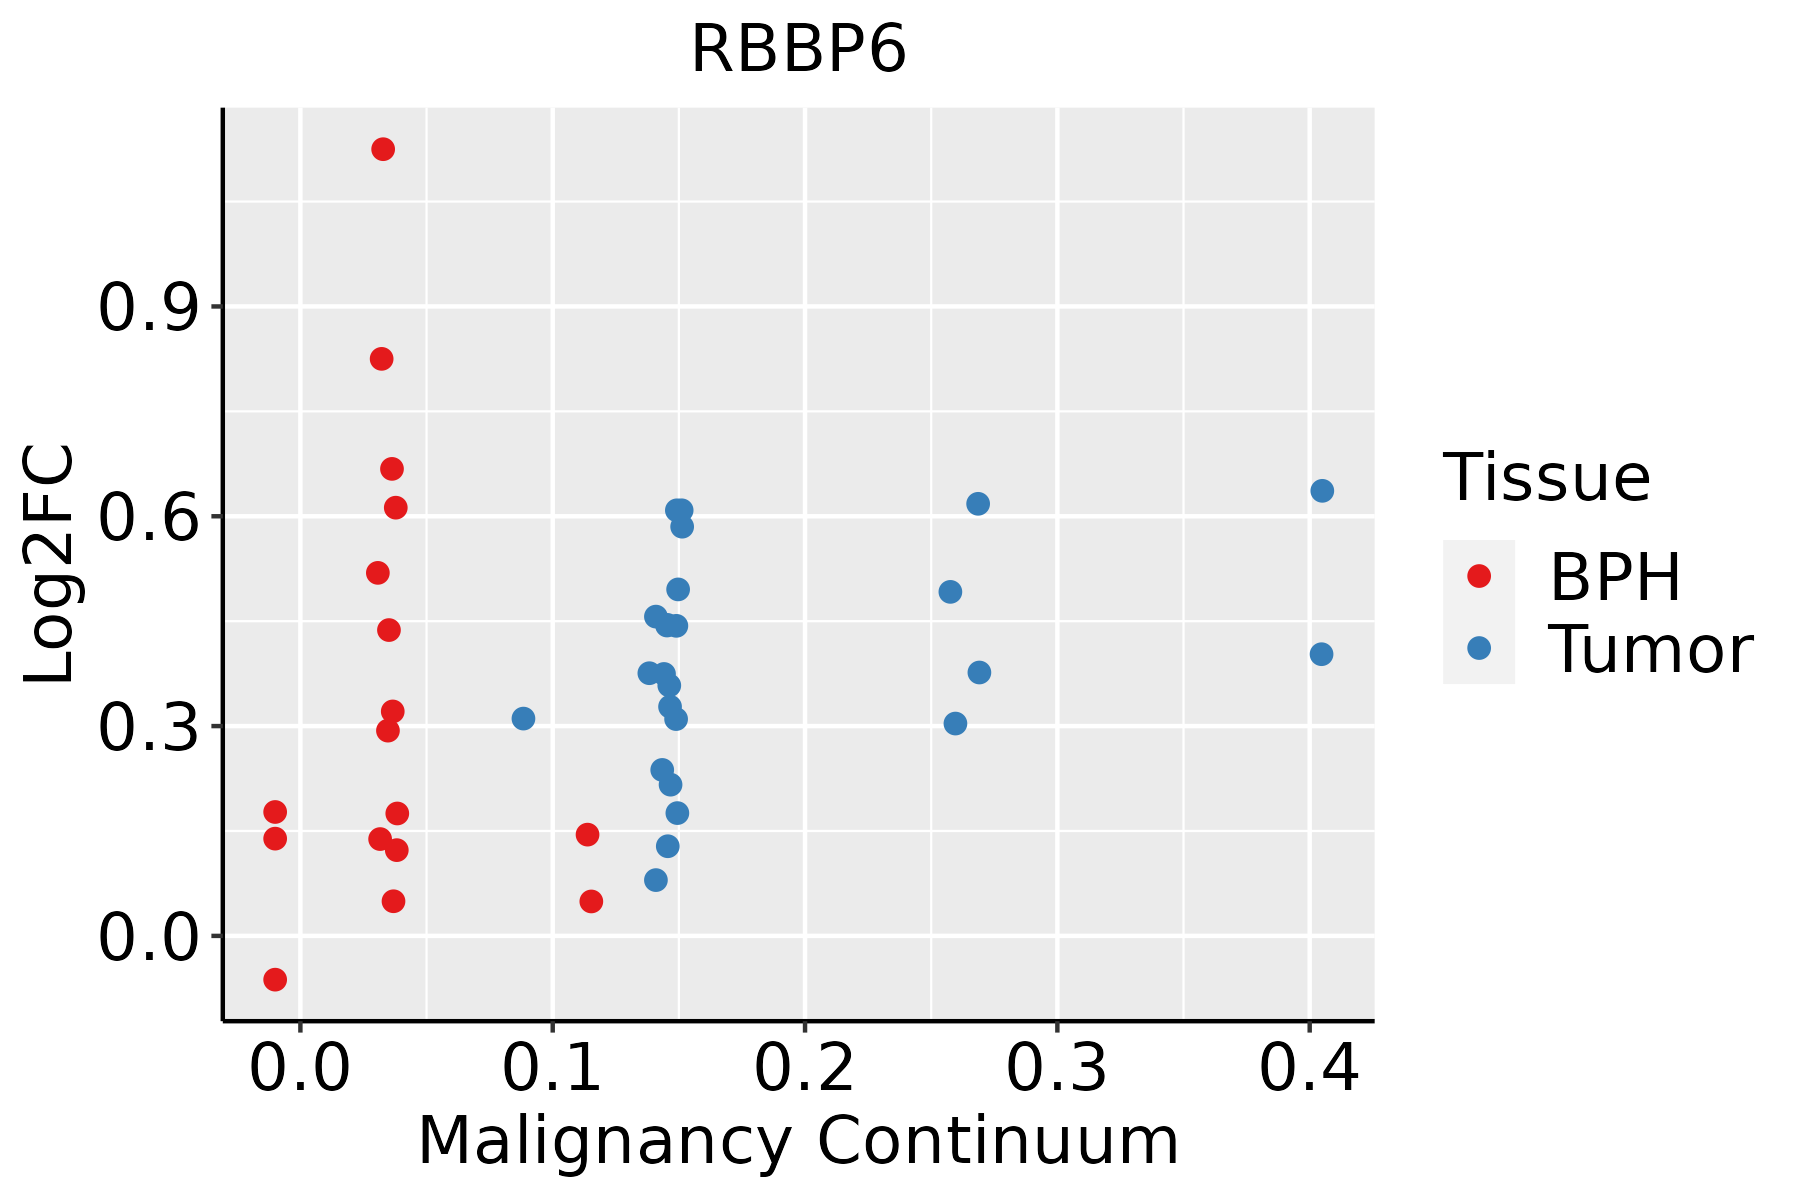
BPH: Benign Prostatic Hyperplasia
SkinThe image shows the transcriptomic changes along malignancy continuum.log2FC in expression of this searched gene in stem-like cells from each diseased tissue sample relative to stem-like cells in normal samples in each tissue plotted against the malignancy continuum. Samples are colored based on if they are from different disease stage.AK: Actinic keratosis
cSCC: Cutaneous squamous cell carcinoma
SCCIS:squamous cell carcinoma in situ
ThyroidThe image shows the transcriptomic changes along malignancy continuum.log2FC in expression of this searched gene in stem-like cells from each diseased tissue sample relative to stem-like cells in normal samples in each tissue plotted against the malignancy continuum. Samples are colored based on if they are from different disease stage.ATC: Anaplastic thyroid cancer
HT: Hashimoto's thyroiditis
PTC: Papillary thyroid cancer
∗log2FC in expression of this searched gene in stem-like cells from each diseased tissue sample relative to stem-like cells in normal samples in each tissue plotted against the malignancy continuum. Samples are colored based on if they are from different disease stage.

Top

Malignant transformation related pathway analysis

check buttonFind out the enriched GO biological processes and KEGG pathways involved in transition from healthy to precancer to cancer
check button Figure of enriched GO biological processes.
TissueDisease StageEnriched GO biological Processes
ColorectumADGO analysis - Figure of enriched GO biological processes: Top 15 enriched GO BP terms are showed in the bar plot of each disease state in each tissue. Each row represents a significant GO biological process which is colored according to the -log10(p.adjust).
ColorectumSERGO analysis - Figure of enriched GO biological processes: Top 15 enriched GO BP terms are showed in the bar plot of each disease state in each tissue. Each row represents a significant GO biological process which is colored according to the -log10(p.adjust).
ColorectumMSSGO analysis - Figure of enriched GO biological processes: Top 15 enriched GO BP terms are showed in the bar plot of each disease state in each tissue. Each row represents a significant GO biological process which is colored according to the -log10(p.adjust).
ColorectumMSI-HGO analysis - Figure of enriched GO biological processes: Top 15 enriched GO BP terms are showed in the bar plot of each disease state in each tissue. Each row represents a significant GO biological process which is colored according to the -log10(p.adjust).
ColorectumFAPGO analysis - Figure of enriched GO biological processes: Top 15 enriched GO BP terms are showed in the bar plot of each disease state in each tissue. Each row represents a significant GO biological process which is colored according to the -log10(p.adjust).
∗Top 15 enriched GO BP terms are showed in the bar plot of each disease state in each tissue. Each row represents a significant GO biological process which is colored according to the -log10(p.adjust).
Page: 1 2 3 4 5 6 7 8 9 

check button Enriched GO biological processes.
GO IDTissueDisease StageDescriptionGene RatioBg Ratiopvaluep.adjustCount
GO:000170119EsophagusESCCin utero embryonic development243/8552367/187231.00e-156.86e-14243
GO:00062604EsophagusESCCDNA replication181/8552260/187233.55e-152.05e-13181
GO:00062754EsophagusESCCregulation of DNA replication73/8552107/187231.97e-062.28e-0573
GO:00352647EsophagusESCCmulticellular organism growth80/8552132/187233.84e-042.22e-0380
GO:00485687EsophagusESCCembryonic organ development228/8552427/187237.28e-043.79e-03228
GO:00017015LiverCirrhoticin utero embryonic development134/4634367/187232.78e-076.86e-06134
GO:003526411LiverCirrhoticmulticellular organism growth47/4634132/187233.40e-031.89e-0247
GO:000170111LiverHCCin utero embryonic development204/7958367/187232.44e-074.30e-06204
GO:00062601LiverHCCDNA replication146/7958260/187235.68e-067.02e-05146
GO:00062751LiverHCCregulation of DNA replication60/7958107/187233.15e-031.46e-0260
GO:003526421LiverHCCmulticellular organism growth70/7958132/187239.29e-033.57e-0270
GO:00017016LungIACin utero embryonic development68/2061367/187231.12e-053.45e-0468
GO:00352644LungIACmulticellular organism growth25/2061132/187234.69e-033.68e-0225
GO:00485684LungIACembryonic organ development64/2061427/187236.46e-034.59e-0264
GO:00062603Oral cavityOSCCDNA replication159/7305260/187233.25e-131.59e-11159
GO:000170116Oral cavityOSCCin utero embryonic development207/7305367/187237.92e-122.95e-10207
GO:00062753Oral cavityOSCCregulation of DNA replication62/7305107/187235.49e-054.54e-0462
GO:00352646Oral cavityOSCCmulticellular organism growth65/7305132/187231.06e-023.60e-0265
GO:000170117Oral cavityLPin utero embryonic development142/4623367/187231.48e-096.75e-08142
GO:000626011Oral cavityLPDNA replication97/4623260/187233.67e-067.75e-0597
Page: 1 2 3 

check button Enriched KEGG pathways.
Pathway IDTissueDisease StageDescriptionGene RatioBg Ratiopvaluep.adjustqvalueCount
Page: 1 

Top

Cell-cell communication analysis

check buttonIdentification of potential cell-cell interactions between two cell types and their ligand-receptor pairs for different disease states
LigandReceptorLRpairPathwayTissueDisease Stage
Page: 1 

Top

Single-cell gene regulatory network inference analysis

check buttonFind out the significant the regulons (TFs) and the target genes of each regulon across cell types for different disease states
TFCell TypeTissueDisease StageTarget GeneRSSRegulon Activity
∗The dot plots of a searched regulon are shown for all cell subpopulations in each disease state of each tissue based on the regulon specific score inferred using pySCENIC and by calculating the average expression.
Page: 1 

Top

Somatic mutation of malignant transformation related genes

check buttonAnnotation of somatic variants for genes involved in malignant transformation
Hugo SymbolVariant ClassVariant ClassificationdbSNP RSHGVScHGVSpHGVSp ShortSWISSPROTBIOTYPESIFTPolyPhenTumor Sample BarcodeTissueHistologySexAgeStageTherapy TypesDrugsOutcome
RBBP6SNVMissense_Mutationc.1990N>Ap.Asp664Asnp.D664NQ7Z6E9protein_codingdeleterious_low_confidence(0.05)probably_damaging(0.996)TCGA-A7-A26H-01Breastbreast invasive carcinomaFemale>=65I/IIHormone TherapyanastrozolePD
RBBP6SNVMissense_Mutationc.2220N>Cp.Lys740Asnp.K740NQ7Z6E9protein_codingdeleterious_low_confidence(0)benign(0.091)TCGA-A7-A26H-01Breastbreast invasive carcinomaFemale>=65I/IIHormone TherapyanastrozolePD
RBBP6SNVMissense_Mutationrs750648345c.4101N>Gp.Ser1367Argp.S1367RQ7Z6E9protein_codingdeleterious_low_confidence(0)benign(0.021)TCGA-A8-A075-01Breastbreast invasive carcinomaFemale<65I/IIChemotherapyepirubicinCR
RBBP6SNVMissense_Mutationc.4496N>Gp.Asp1499Glyp.D1499GQ7Z6E9protein_codingdeleterious_low_confidence(0)benign(0.086)TCGA-A8-A09W-01Breastbreast invasive carcinomaFemale>=65III/IVUnknownUnknownSD
RBBP6SNVMissense_Mutationrs774633010c.1327N>Tp.Ala443Serp.A443SQ7Z6E9protein_codingtolerated_low_confidence(0.17)benign(0.062)TCGA-AC-A23H-01Breastbreast invasive carcinomaFemale>=65I/IIUnknownUnknownPD
RBBP6SNVMissense_Mutationc.457N>Cp.Gly153Argp.G153RQ7Z6E9protein_codingdeleterious_low_confidence(0.01)probably_damaging(0.998)TCGA-AN-A0FV-01Breastbreast invasive carcinomaFemale<65I/IIUnknownUnknownSD
RBBP6SNVMissense_Mutationc.2257N>Ap.Tyr753Asnp.Y753NQ7Z6E9protein_codingdeleterious_low_confidence(0)probably_damaging(0.942)TCGA-AN-A0XN-01Breastbreast invasive carcinomaFemale>=65III/IVUnknownUnknownSD
RBBP6SNVMissense_Mutationc.3235C>Gp.Gln1079Glup.Q1079EQ7Z6E9protein_codingdeleterious_low_confidence(0)probably_damaging(0.931)TCGA-B6-A0IK-01Breastbreast invasive carcinomaFemale<65III/IVUnknownUnknownPD
RBBP6SNVMissense_Mutationc.1622G>Cp.Arg541Thrp.R541TQ7Z6E9protein_codingdeleterious_low_confidence(0)probably_damaging(0.991)TCGA-BH-A209-01Breastbreast invasive carcinomaFemale>=65I/IIUnknownUnknownSD
RBBP6SNVMissense_Mutationc.307N>Cp.Asp103Hisp.D103HQ7Z6E9protein_codingdeleterious_low_confidence(0.03)probably_damaging(0.927)TCGA-C8-A12K-01Breastbreast invasive carcinomaFemale>=65I/IIUnknownUnknownSD
Page: 1 2 3 4 5 6 7 8 9 10 11 12 13 14 15 16 17 18 19 20 21 

Top

Related drugs of malignant transformation related genes

check buttonIdentification of chemicals and drugs interact with genes involved in malignant transfromation
(DGIdb 4.0)
Entrez IDSymbolCategoryInteraction TypesDrug Claim NameDrug NamePMIDs
Page: 1