
|
|||||
|
 | |
| |
| |
| |
| |
| |
|
Gene: RBBP5 |
Gene summary for RBBP5 |
| Gene information | Species | Human | Gene symbol | RBBP5 | Gene ID | 5929 |
| Gene name | RB binding protein 5, histone lysine methyltransferase complex subunit | |
| Gene Alias | RBQ3 | |
| Cytomap | 1q32.1 | |
| Gene Type | protein-coding | GO ID | GO:0006464 | UniProtAcc | Q15291 |
Top |
Malignant transformation analysis |
| Identification of the aberrant gene expression in precancerous and cancerous lesions by comparing the gene expression of stem-like cells in diseased tissues with normal stem cells |
| Entrez ID | Symbol | Replicates | Species | Organ | Tissue | Adj P-value | Log2FC | Malignancy |
| 5929 | RBBP5 | LZE2T | Human | Esophagus | ESCC | 6.68e-05 | 5.16e-01 | 0.082 |
| 5929 | RBBP5 | LZE4T | Human | Esophagus | ESCC | 1.54e-11 | 3.52e-01 | 0.0811 |
| 5929 | RBBP5 | LZE7T | Human | Esophagus | ESCC | 4.33e-12 | 4.89e-01 | 0.0667 |
| 5929 | RBBP5 | LZE20T | Human | Esophagus | ESCC | 8.61e-07 | 1.18e-01 | 0.0662 |
| 5929 | RBBP5 | LZE22T | Human | Esophagus | ESCC | 3.30e-03 | 1.76e-01 | 0.068 |
| 5929 | RBBP5 | LZE24T | Human | Esophagus | ESCC | 6.73e-15 | 3.45e-01 | 0.0596 |
| 5929 | RBBP5 | LZE6T | Human | Esophagus | ESCC | 1.71e-02 | 9.32e-02 | 0.0845 |
| 5929 | RBBP5 | P1T-E | Human | Esophagus | ESCC | 4.17e-13 | 3.69e-01 | 0.0875 |
| 5929 | RBBP5 | P2T-E | Human | Esophagus | ESCC | 3.87e-21 | 3.68e-01 | 0.1177 |
| 5929 | RBBP5 | P4T-E | Human | Esophagus | ESCC | 4.43e-17 | 3.80e-01 | 0.1323 |
| 5929 | RBBP5 | P5T-E | Human | Esophagus | ESCC | 1.00e-13 | 2.65e-01 | 0.1327 |
| 5929 | RBBP5 | P8T-E | Human | Esophagus | ESCC | 2.27e-09 | 1.69e-01 | 0.0889 |
| 5929 | RBBP5 | P9T-E | Human | Esophagus | ESCC | 7.41e-10 | 1.94e-01 | 0.1131 |
| 5929 | RBBP5 | P10T-E | Human | Esophagus | ESCC | 5.03e-23 | 3.64e-01 | 0.116 |
| 5929 | RBBP5 | P11T-E | Human | Esophagus | ESCC | 1.70e-10 | 2.76e-01 | 0.1426 |
| 5929 | RBBP5 | P12T-E | Human | Esophagus | ESCC | 7.54e-14 | 2.31e-01 | 0.1122 |
| 5929 | RBBP5 | P15T-E | Human | Esophagus | ESCC | 6.68e-22 | 4.07e-01 | 0.1149 |
| 5929 | RBBP5 | P16T-E | Human | Esophagus | ESCC | 3.01e-23 | 4.27e-01 | 0.1153 |
| 5929 | RBBP5 | P17T-E | Human | Esophagus | ESCC | 1.36e-04 | 2.38e-01 | 0.1278 |
| 5929 | RBBP5 | P20T-E | Human | Esophagus | ESCC | 2.99e-12 | 2.68e-01 | 0.1124 |
| Page: 1 2 3 4 |
| Tissue | Expression Dynamics | Abbreviation |
| Esophagus | 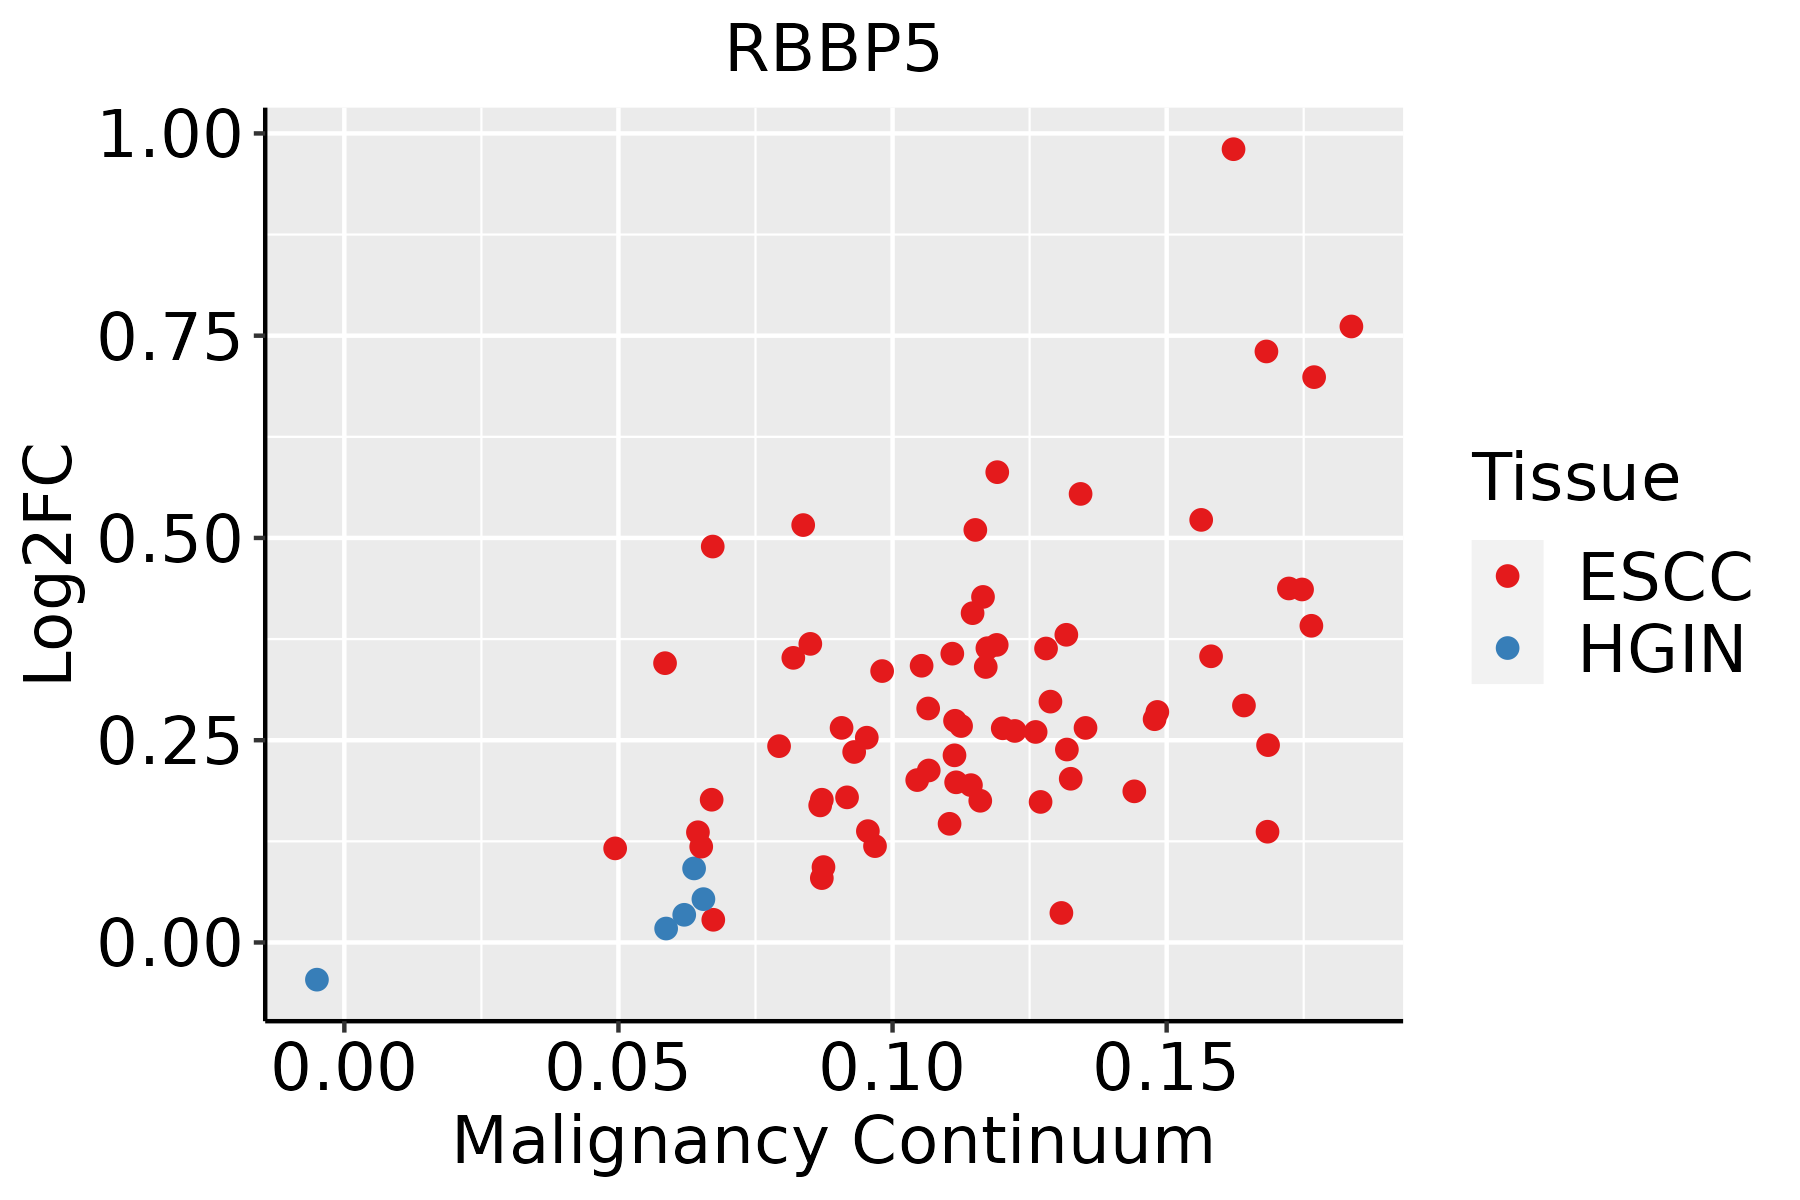 | ESCC: Esophageal squamous cell carcinoma |
| HGIN: High-grade intraepithelial neoplasias | ||
| LGIN: Low-grade intraepithelial neoplasias | ||
| Liver | 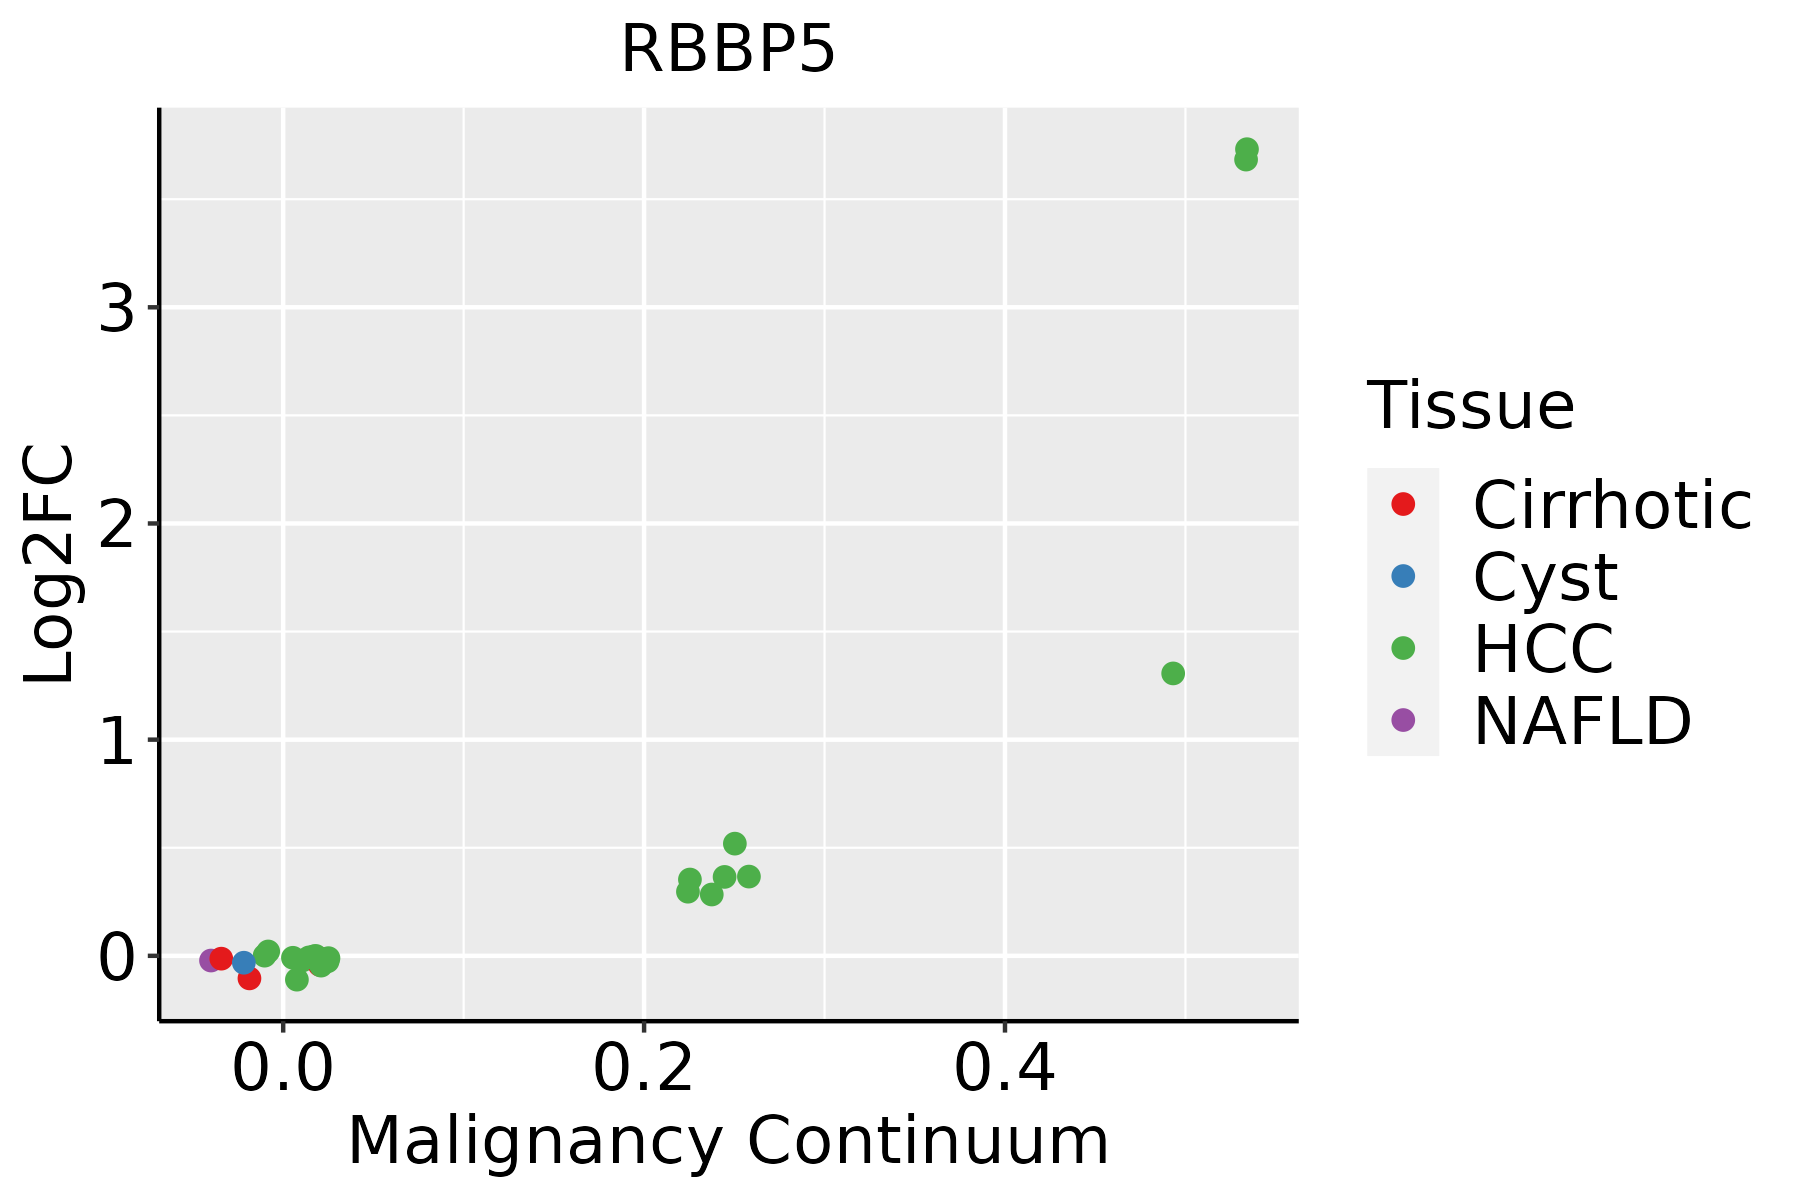 | HCC: Hepatocellular carcinoma |
| NAFLD: Non-alcoholic fatty liver disease |
| ∗log2FC in expression of this searched gene in stem-like cells from each diseased tissue sample relative to stem-like cells in normal samples in each tissue plotted against the malignancy continuum. Samples are colored based on if they are from different disease stage. |
Top |
Malignant transformation related pathway analysis |
| Find out the enriched GO biological processes and KEGG pathways involved in transition from healthy to precancer to cancer |
| Tissue | Disease Stage | Enriched GO biological Processes |
| Colorectum | AD |  |
| Colorectum | SER |  |
| Colorectum | MSS |  |
| Colorectum | MSI-H |  |
| Colorectum | FAP |  |
| ∗Top 15 enriched GO BP terms are showed in the bar plot of each disease state in each tissue. Each row represents a significant GO biological process which is colored according to the -log10(p.adjust). |
| Page: 1 2 3 4 5 6 7 8 9 |
| GO ID | Tissue | Disease Stage | Description | Gene Ratio | Bg Ratio | pvalue | p.adjust | Count |
| GO:001657015 | Esophagus | ESCC | histone modification | 323/8552 | 463/18723 | 2.61e-26 | 7.88e-24 | 323 |
| GO:001820514 | Esophagus | ESCC | peptidyl-lysine modification | 259/8552 | 376/18723 | 3.90e-20 | 5.26e-18 | 259 |
| GO:00434143 | Esophagus | ESCC | macromolecule methylation | 199/8552 | 316/18723 | 3.44e-10 | 9.57e-09 | 199 |
| GO:00322592 | Esophagus | ESCC | methylation | 222/8552 | 364/18723 | 2.26e-09 | 5.09e-08 | 222 |
| GO:000647914 | Esophagus | ESCC | protein methylation | 115/8552 | 181/18723 | 9.07e-07 | 1.16e-05 | 115 |
| GO:000821314 | Esophagus | ESCC | protein alkylation | 115/8552 | 181/18723 | 9.07e-07 | 1.16e-05 | 115 |
| GO:00165718 | Esophagus | ESCC | histone methylation | 89/8552 | 141/18723 | 2.17e-05 | 1.87e-04 | 89 |
| GO:003496814 | Esophagus | ESCC | histone lysine methylation | 72/8552 | 115/18723 | 1.85e-04 | 1.18e-03 | 72 |
| GO:001802214 | Esophagus | ESCC | peptidyl-lysine methylation | 79/8552 | 131/18723 | 5.17e-04 | 2.86e-03 | 79 |
| GO:00436275 | Esophagus | ESCC | response to estrogen | 45/8552 | 75/18723 | 8.75e-03 | 3.08e-02 | 45 |
| GO:001657021 | Liver | HCC | histone modification | 283/7958 | 463/18723 | 2.68e-16 | 2.33e-14 | 283 |
| GO:00182052 | Liver | HCC | peptidyl-lysine modification | 230/7958 | 376/18723 | 1.51e-13 | 8.32e-12 | 230 |
| GO:00434141 | Liver | HCC | macromolecule methylation | 183/7958 | 316/18723 | 2.00e-08 | 4.72e-07 | 183 |
| GO:0032259 | Liver | HCC | methylation | 206/7958 | 364/18723 | 3.35e-08 | 7.53e-07 | 206 |
| GO:00064792 | Liver | HCC | protein methylation | 111/7958 | 181/18723 | 2.36e-07 | 4.18e-06 | 111 |
| GO:00082132 | Liver | HCC | protein alkylation | 111/7958 | 181/18723 | 2.36e-07 | 4.18e-06 | 111 |
| GO:00165712 | Liver | HCC | histone methylation | 88/7958 | 141/18723 | 1.41e-06 | 2.02e-05 | 88 |
| GO:00349681 | Liver | HCC | histone lysine methylation | 70/7958 | 115/18723 | 5.32e-05 | 5.04e-04 | 70 |
| GO:00180221 | Liver | HCC | peptidyl-lysine methylation | 74/7958 | 131/18723 | 8.46e-04 | 5.06e-03 | 74 |
| GO:0051568 | Liver | HCC | histone H3-K4 methylation | 36/7958 | 59/18723 | 3.15e-03 | 1.46e-02 | 36 |
| Page: 1 2 |
| Pathway ID | Tissue | Disease Stage | Description | Gene Ratio | Bg Ratio | pvalue | p.adjust | qvalue | Count |
| Page: 1 |
Top |
Cell-cell communication analysis |
| Identification of potential cell-cell interactions between two cell types and their ligand-receptor pairs for different disease states |
| Ligand | Receptor | LRpair | Pathway | Tissue | Disease Stage |
| Page: 1 |
Top |
Single-cell gene regulatory network inference analysis |
| Find out the significant the regulons (TFs) and the target genes of each regulon across cell types for different disease states |
| TF | Cell Type | Tissue | Disease Stage | Target Gene | RSS | Regulon Activity |
| RBBP5 | BMEM | Endometrium | Healthy | PRPF4,KBTBD3,VGLL4, etc. | 1.52e-01 |  |
| ∗The dot plots of a searched regulon are shown for all cell subpopulations in each disease state of each tissue based on the regulon specific score inferred using pySCENIC and by calculating the average expression. |
| Page: 1 |
Top |
Somatic mutation of malignant transformation related genes |
| Annotation of somatic variants for genes involved in malignant transformation |
| Hugo Symbol | Variant Class | Variant Classification | dbSNP RS | HGVSc | HGVSp | HGVSp Short | SWISSPROT | BIOTYPE | SIFT | PolyPhen | Tumor Sample Barcode | Tissue | Histology | Sex | Age | Stage | Therapy Types | Drugs | Outcome |
| RBBP5 | SNV | Missense_Mutation | c.487N>A | p.Gly163Arg | p.G163R | Q15291 | protein_coding | deleterious(0) | probably_damaging(0.916) | TCGA-A8-A09Z-01 | Breast | breast invasive carcinoma | Female | >=65 | I/II | Unknown | Unknown | SD | |
| RBBP5 | SNV | Missense_Mutation | c.503C>T | p.Thr168Met | p.T168M | Q15291 | protein_coding | deleterious(0.01) | possibly_damaging(0.694) | TCGA-AO-A1KP-01 | Breast | breast invasive carcinoma | Female | >=65 | I/II | Chemotherapy | fluorouracil | SD | |
| RBBP5 | insertion | Nonsense_Mutation | novel | c.1316_1317insAAGTGAAGCTTGGTGAGGGTAACCCTGAGCTTGGGACTTTTGG | p.Ser441GlufsTer4 | p.S441Efs*4 | Q15291 | protein_coding | TCGA-AO-A03T-01 | Breast | breast invasive carcinoma | Female | <65 | I/II | Chemotherapy | cyclophosphamide | SD | ||
| RBBP5 | insertion | Frame_Shift_Ins | novel | c.704_705insTAAGTATTCTATTTTACTTGCTTCGAAACTAGTT | p.Arg235SerfsTer17 | p.R235Sfs*17 | Q15291 | protein_coding | TCGA-BH-A0AY-01 | Breast | breast invasive carcinoma | Female | <65 | I/II | Chemotherapy | SD | |||
| RBBP5 | SNV | Missense_Mutation | c.503C>T | p.Thr168Met | p.T168M | Q15291 | protein_coding | deleterious(0.01) | possibly_damaging(0.694) | TCGA-VS-A9V3-01 | Cervix | cervical & endocervical cancer | Female | <65 | I/II | Chemotherapy | cisplatin | PD | |
| RBBP5 | SNV | Missense_Mutation | c.295G>A | p.Asp99Asn | p.D99N | Q15291 | protein_coding | tolerated(0.07) | benign(0.32) | TCGA-AA-A00N-01 | Colorectum | colon adenocarcinoma | Male | >=65 | I/II | Unknown | Unknown | PD | |
| RBBP5 | SNV | Missense_Mutation | c.1240N>C | p.Asn414His | p.N414H | Q15291 | protein_coding | tolerated(0.12) | possibly_damaging(0.598) | TCGA-AA-A010-01 | Colorectum | colon adenocarcinoma | Female | <65 | I/II | Chemotherapy | folinic | CR | |
| RBBP5 | SNV | Missense_Mutation | novel | c.140G>A | p.Arg47Gln | p.R47Q | Q15291 | protein_coding | deleterious(0) | probably_damaging(0.998) | TCGA-AZ-4315-01 | Colorectum | colon adenocarcinoma | Male | <65 | I/II | Unknown | Unknown | SD |
| RBBP5 | SNV | Missense_Mutation | novel | c.1558N>T | p.Val520Leu | p.V520L | Q15291 | protein_coding | tolerated_low_confidence(0.06) | benign(0.003) | TCGA-CA-6717-01 | Colorectum | colon adenocarcinoma | Male | <65 | I/II | Chemotherapy | oxaliplatin | CR |
| RBBP5 | SNV | Missense_Mutation | novel | c.739G>A | p.Asp247Asn | p.D247N | Q15291 | protein_coding | deleterious(0) | probably_damaging(1) | TCGA-AG-3892-01 | Colorectum | rectum adenocarcinoma | Female | <65 | I/II | Unknown | Unknown | SD |
| Page: 1 2 3 4 5 |
Top |
Related drugs of malignant transformation related genes |
| Identification of chemicals and drugs interact with genes involved in malignant transfromation |
| (DGIdb 4.0) |
| Entrez ID | Symbol | Category | Interaction Types | Drug Claim Name | Drug Name | PMIDs |
| Page: 1 |

Copyright 2023-Present -The University of Texas Health Science Center at Houston |