
|
|||||
|
 | |
| |
| |
| |
| |
| |
|
Gene: RBBP4 |
Gene summary for RBBP4 |
| Gene information | Species | Human | Gene symbol | RBBP4 | Gene ID | 5928 |
| Gene name | RB binding protein 4, chromatin remodeling factor | |
| Gene Alias | NURF55 | |
| Cytomap | 1p35.1 | |
| Gene Type | protein-coding | GO ID | GO:0006260 | UniProtAcc | Q09028 |
Top |
Malignant transformation analysis |
| Identification of the aberrant gene expression in precancerous and cancerous lesions by comparing the gene expression of stem-like cells in diseased tissues with normal stem cells |
| Entrez ID | Symbol | Replicates | Species | Organ | Tissue | Adj P-value | Log2FC | Malignancy |
| 5928 | RBBP4 | LZE2T | Human | Esophagus | ESCC | 1.97e-05 | 9.21e-01 | 0.082 |
| 5928 | RBBP4 | LZE4T | Human | Esophagus | ESCC | 2.51e-19 | 5.35e-01 | 0.0811 |
| 5928 | RBBP4 | LZE5T | Human | Esophagus | ESCC | 1.75e-04 | 7.29e-01 | 0.0514 |
| 5928 | RBBP4 | LZE7T | Human | Esophagus | ESCC | 2.15e-20 | 1.76e+00 | 0.0667 |
| 5928 | RBBP4 | LZE8T | Human | Esophagus | ESCC | 3.10e-19 | 8.03e-01 | 0.067 |
| 5928 | RBBP4 | LZE20T | Human | Esophagus | ESCC | 5.63e-15 | 6.90e-01 | 0.0662 |
| 5928 | RBBP4 | LZE22D1 | Human | Esophagus | HGIN | 3.85e-06 | 3.43e-01 | 0.0595 |
| 5928 | RBBP4 | LZE22T | Human | Esophagus | ESCC | 3.78e-10 | 1.12e+00 | 0.068 |
| 5928 | RBBP4 | LZE24T | Human | Esophagus | ESCC | 5.54e-51 | 1.40e+00 | 0.0596 |
| 5928 | RBBP4 | LZE21T | Human | Esophagus | ESCC | 6.77e-05 | 5.46e-01 | 0.0655 |
| 5928 | RBBP4 | LZE6T | Human | Esophagus | ESCC | 1.36e-16 | 8.72e-01 | 0.0845 |
| 5928 | RBBP4 | P1T-E | Human | Esophagus | ESCC | 7.88e-10 | 7.98e-01 | 0.0875 |
| 5928 | RBBP4 | P2T-E | Human | Esophagus | ESCC | 2.65e-88 | 1.71e+00 | 0.1177 |
| 5928 | RBBP4 | P4T-E | Human | Esophagus | ESCC | 3.87e-54 | 1.13e+00 | 0.1323 |
| 5928 | RBBP4 | P5T-E | Human | Esophagus | ESCC | 4.27e-37 | 9.27e-01 | 0.1327 |
| 5928 | RBBP4 | P8T-E | Human | Esophagus | ESCC | 3.23e-52 | 1.11e+00 | 0.0889 |
| 5928 | RBBP4 | P9T-E | Human | Esophagus | ESCC | 3.13e-16 | 4.81e-01 | 0.1131 |
| 5928 | RBBP4 | P10T-E | Human | Esophagus | ESCC | 3.76e-93 | 1.76e+00 | 0.116 |
| 5928 | RBBP4 | P11T-E | Human | Esophagus | ESCC | 9.25e-19 | 8.28e-01 | 0.1426 |
| 5928 | RBBP4 | P12T-E | Human | Esophagus | ESCC | 1.06e-50 | 1.05e+00 | 0.1122 |
| Page: 1 2 3 4 5 6 7 |
| Tissue | Expression Dynamics | Abbreviation |
| Esophagus | 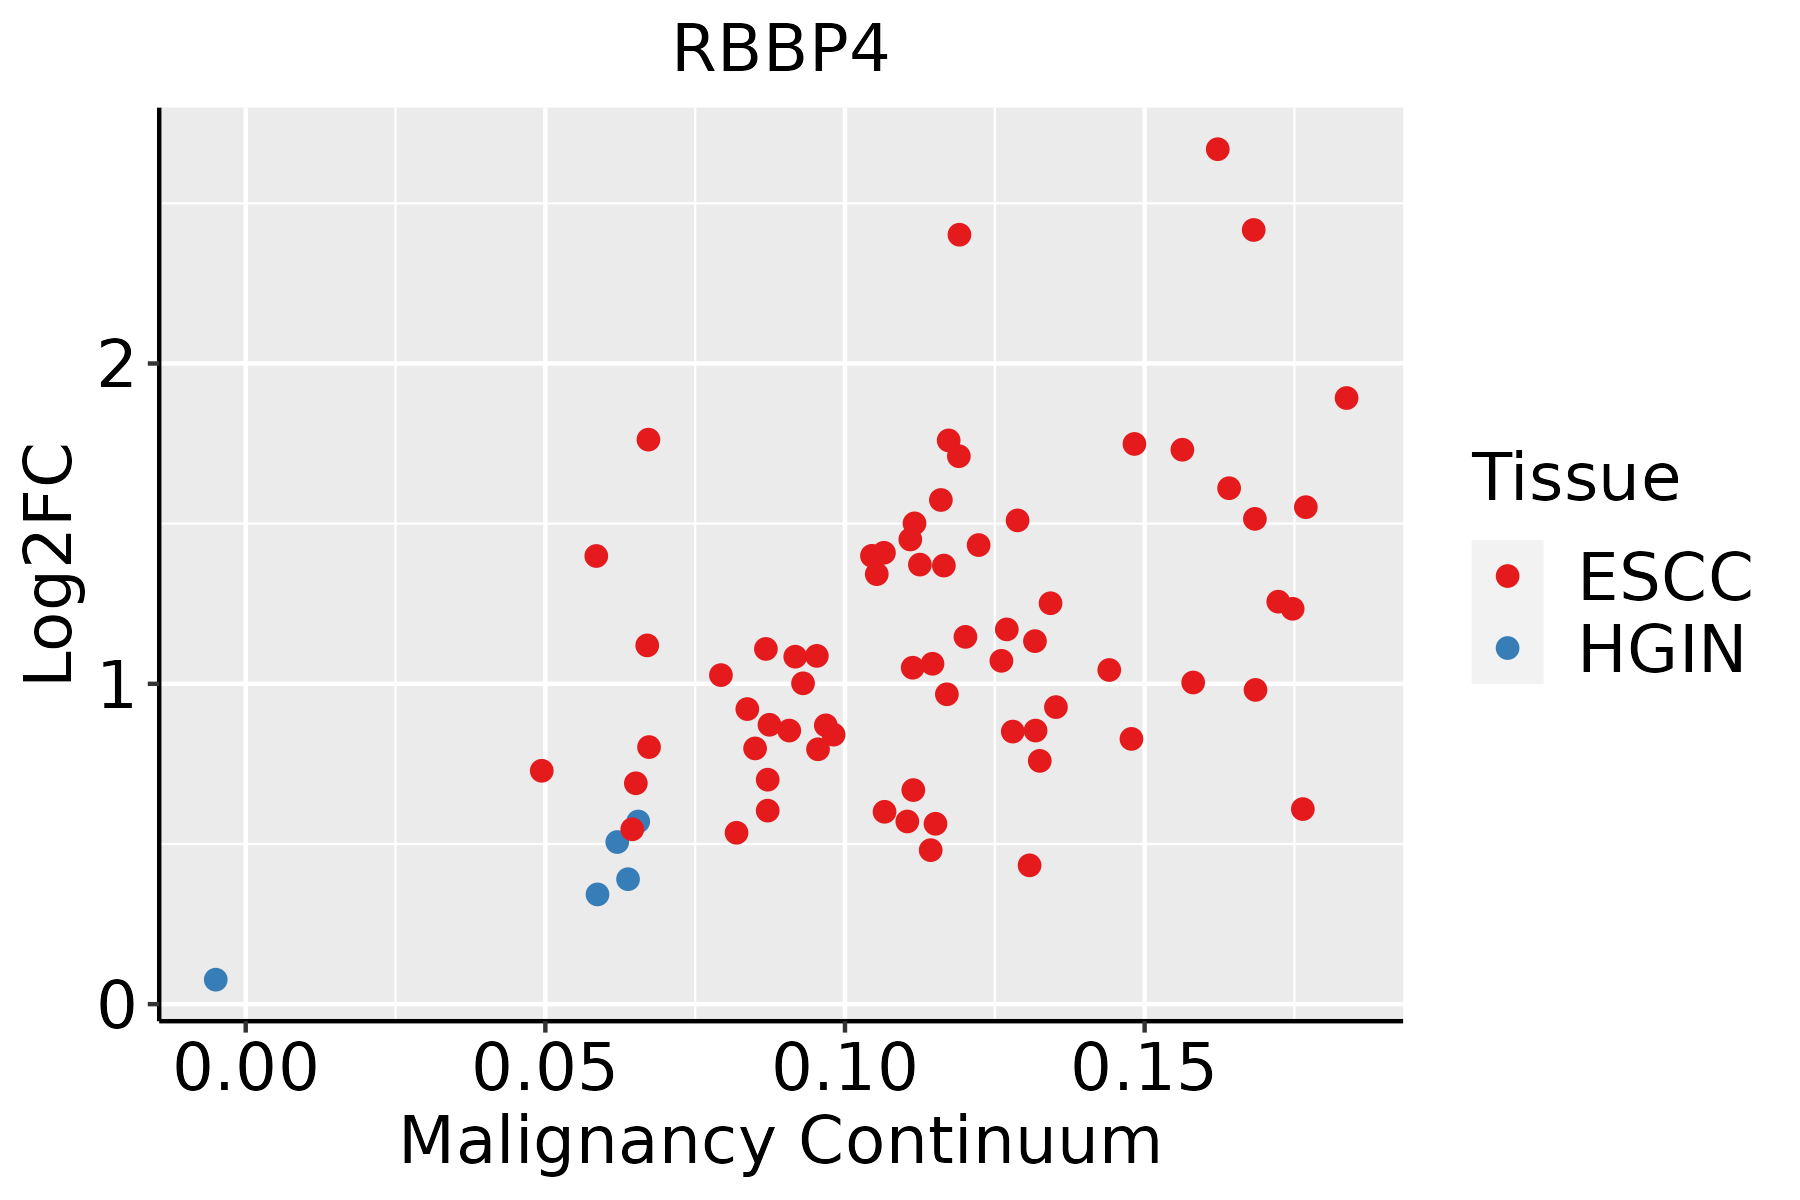 | ESCC: Esophageal squamous cell carcinoma |
| HGIN: High-grade intraepithelial neoplasias | ||
| LGIN: Low-grade intraepithelial neoplasias | ||
| Liver | 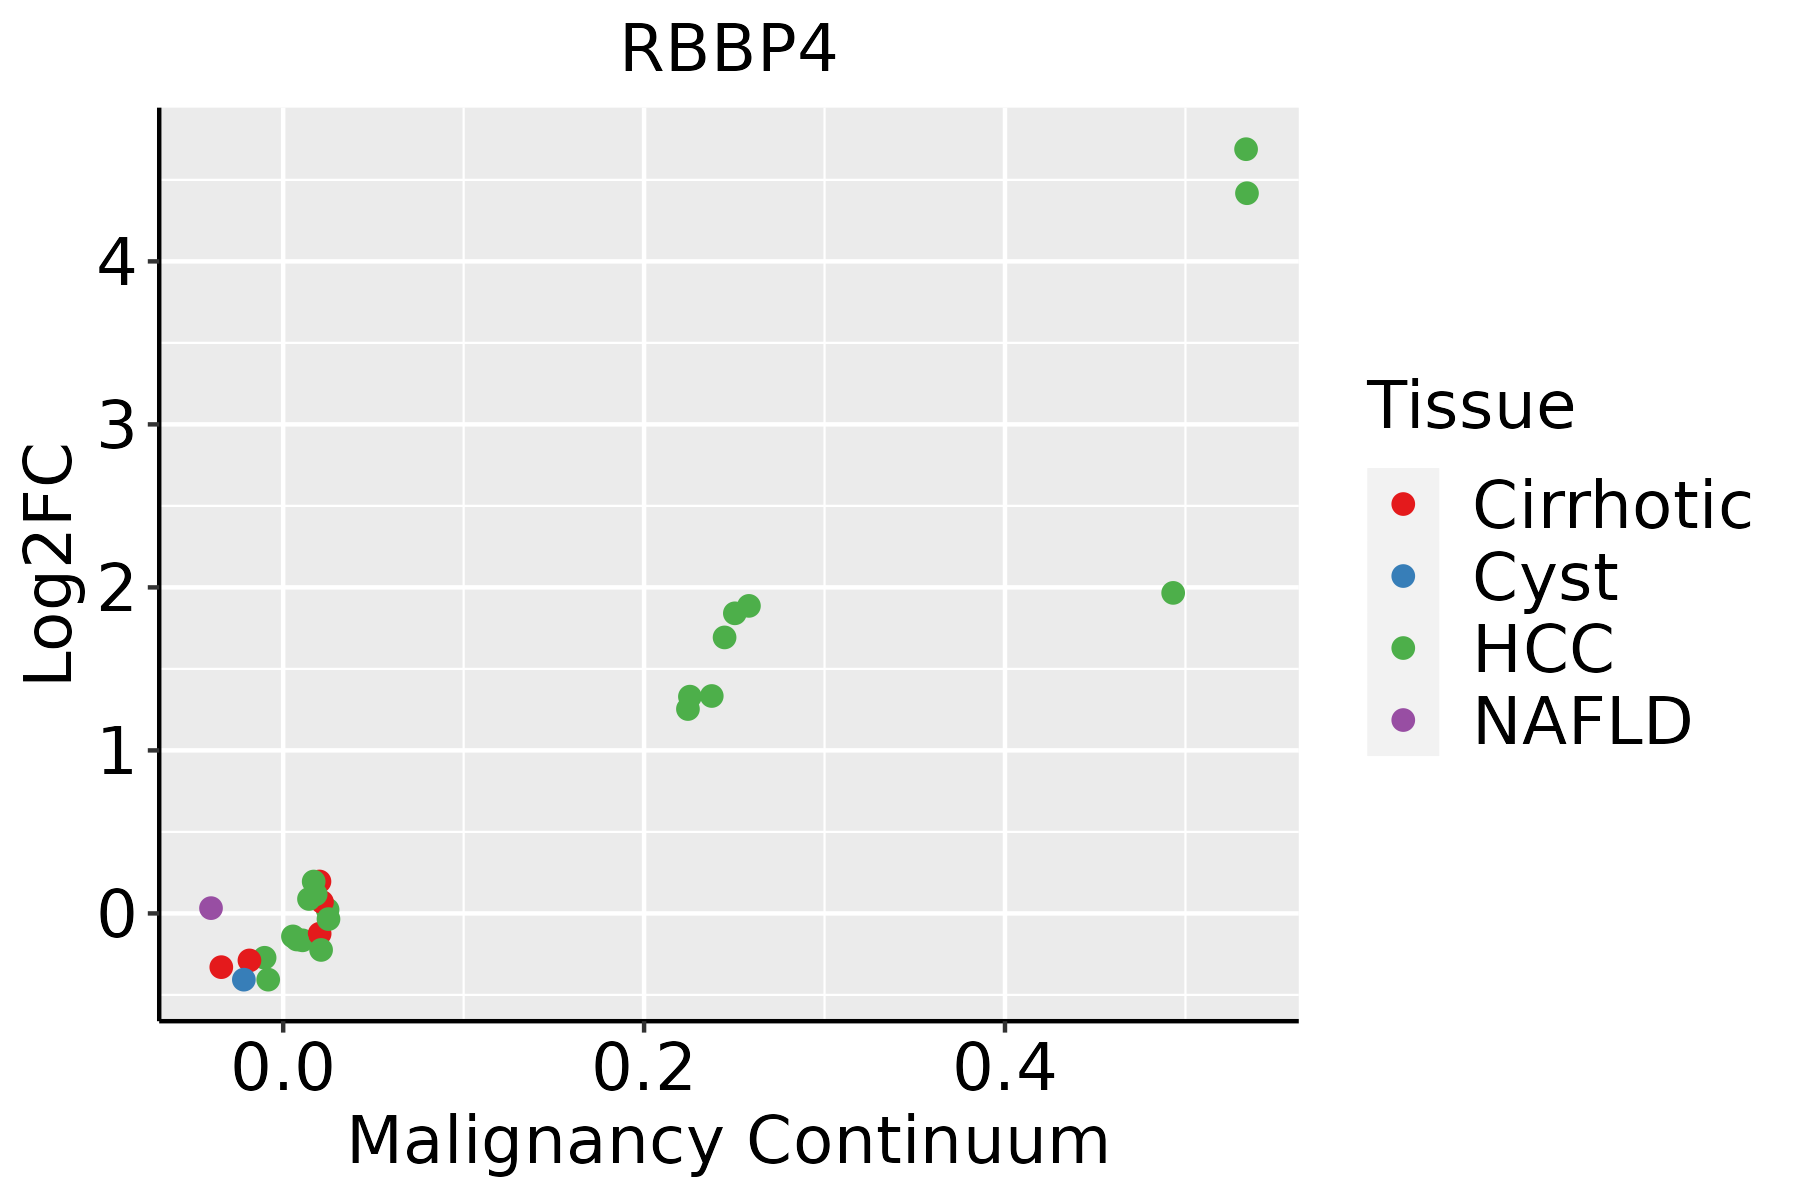 | HCC: Hepatocellular carcinoma |
| NAFLD: Non-alcoholic fatty liver disease | ||
| Oral Cavity |  | EOLP: Erosive Oral lichen planus |
| LP: leukoplakia | ||
| NEOLP: Non-erosive oral lichen planus | ||
| OSCC: Oral squamous cell carcinoma | ||
| Skin | 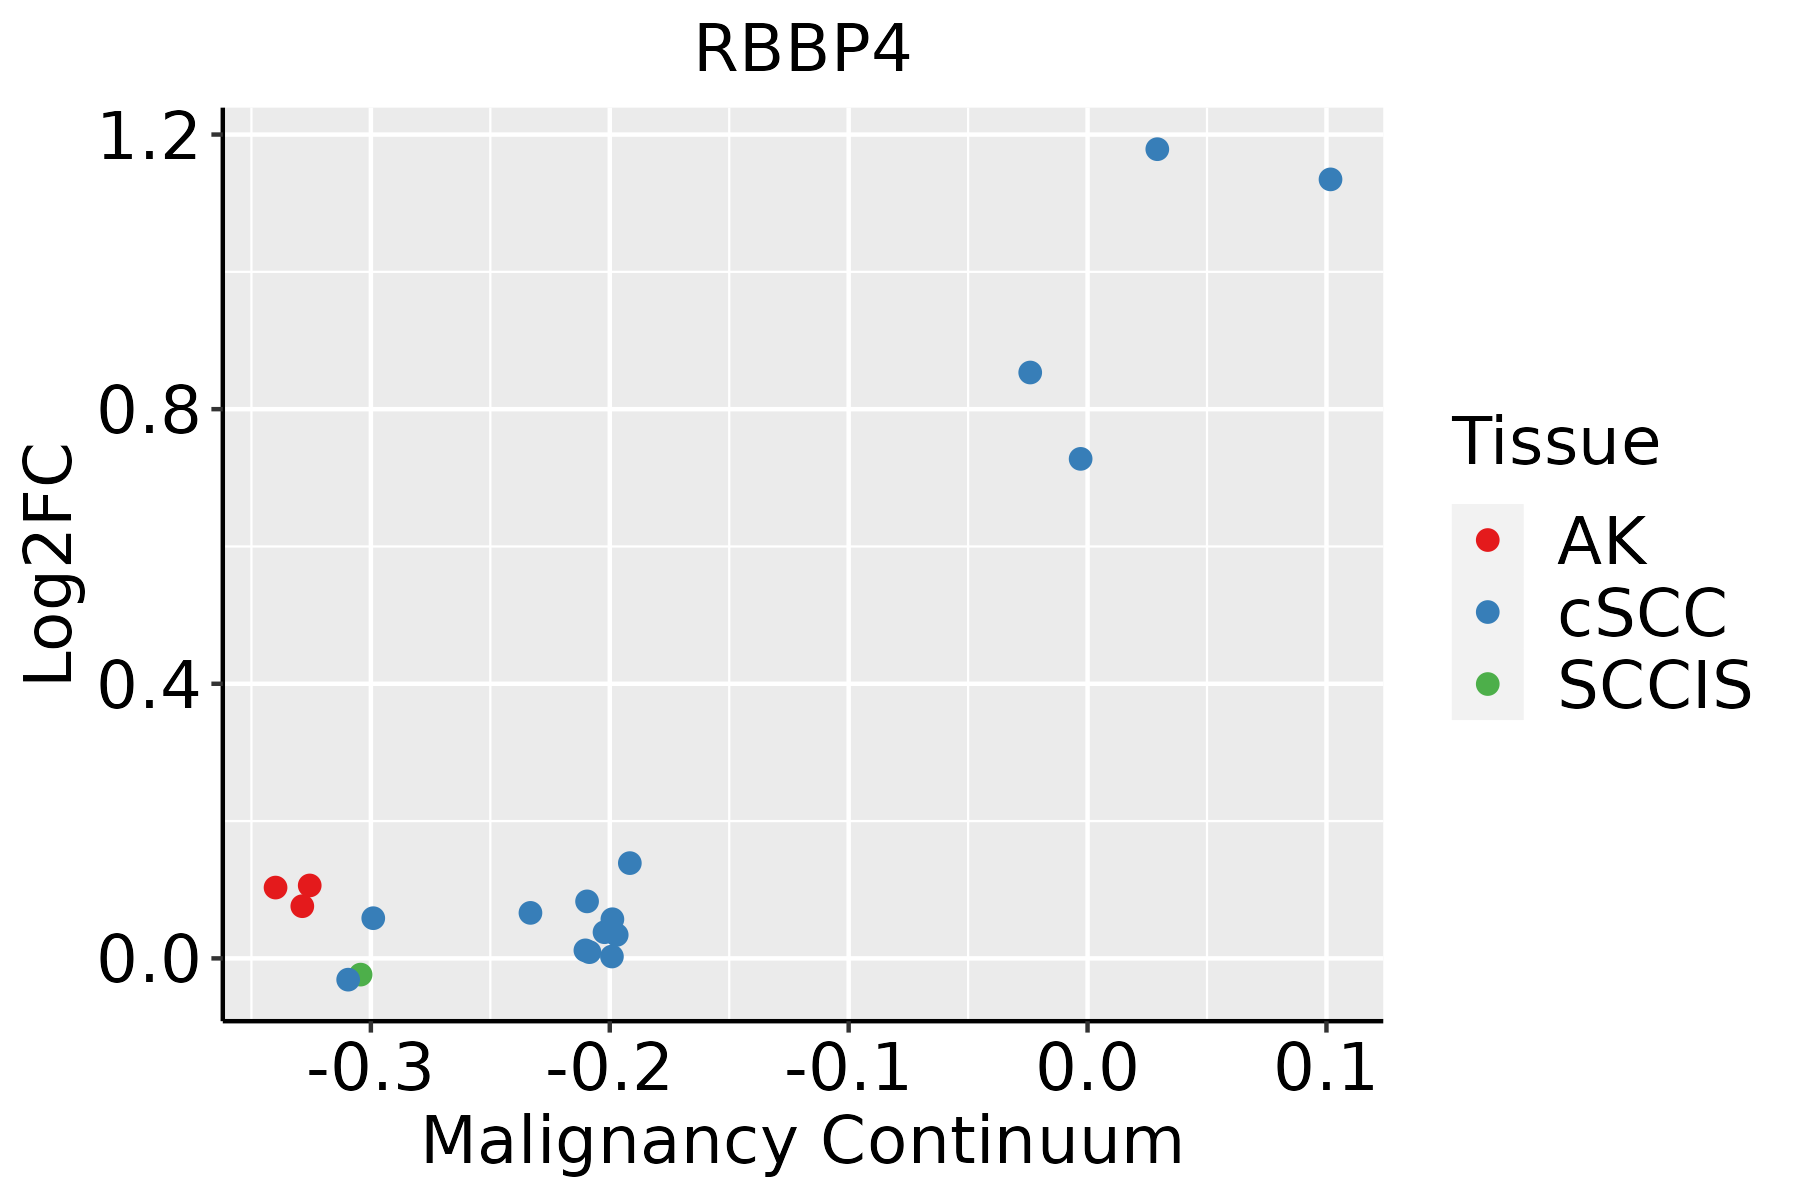 | AK: Actinic keratosis |
| cSCC: Cutaneous squamous cell carcinoma | ||
| SCCIS:squamous cell carcinoma in situ | ||
| Thyroid |  | ATC: Anaplastic thyroid cancer |
| HT: Hashimoto's thyroiditis | ||
| PTC: Papillary thyroid cancer |
| ∗log2FC in expression of this searched gene in stem-like cells from each diseased tissue sample relative to stem-like cells in normal samples in each tissue plotted against the malignancy continuum. Samples are colored based on if they are from different disease stage. |
Top |
Malignant transformation related pathway analysis |
| Find out the enriched GO biological processes and KEGG pathways involved in transition from healthy to precancer to cancer |
| Tissue | Disease Stage | Enriched GO biological Processes |
| Colorectum | AD |  |
| Colorectum | SER |  |
| Colorectum | MSS |  |
| Colorectum | MSI-H |  |
| Colorectum | FAP |  |
| ∗Top 15 enriched GO BP terms are showed in the bar plot of each disease state in each tissue. Each row represents a significant GO biological process which is colored according to the -log10(p.adjust). |
| Page: 1 2 3 4 5 6 7 8 9 |
| GO ID | Tissue | Disease Stage | Description | Gene Ratio | Bg Ratio | pvalue | p.adjust | Count |
| GO:000632516 | Esophagus | HGIN | chromatin organization | 92/2587 | 409/18723 | 1.05e-06 | 4.16e-05 | 92 |
| GO:00062604 | Esophagus | ESCC | DNA replication | 181/8552 | 260/18723 | 3.55e-15 | 2.05e-13 | 181 |
| GO:000632517 | Esophagus | ESCC | chromatin organization | 240/8552 | 409/18723 | 6.52e-08 | 1.14e-06 | 240 |
| GO:00062601 | Liver | HCC | DNA replication | 146/7958 | 260/18723 | 5.68e-06 | 7.02e-05 | 146 |
| GO:000632511 | Liver | HCC | chromatin organization | 206/7958 | 409/18723 | 7.23e-04 | 4.41e-03 | 206 |
| GO:00062603 | Oral cavity | OSCC | DNA replication | 159/7305 | 260/18723 | 3.25e-13 | 1.59e-11 | 159 |
| GO:000632510 | Oral cavity | OSCC | chromatin organization | 190/7305 | 409/18723 | 1.17e-03 | 5.97e-03 | 190 |
| GO:000626011 | Oral cavity | LP | DNA replication | 97/4623 | 260/18723 | 3.67e-06 | 7.75e-05 | 97 |
| GO:000626012 | Skin | cSCC | DNA replication | 106/4864 | 260/18723 | 1.18e-07 | 2.77e-06 | 106 |
| GO:000632519 | Skin | cSCC | chromatin organization | 147/4864 | 409/18723 | 4.41e-06 | 6.52e-05 | 147 |
| GO:000633812 | Skin | cSCC | chromatin remodeling | 94/4864 | 255/18723 | 7.58e-05 | 7.26e-04 | 94 |
| GO:00718241 | Skin | cSCC | protein-DNA complex subunit organization | 87/4864 | 241/18723 | 3.09e-04 | 2.47e-03 | 87 |
| GO:00711031 | Skin | cSCC | DNA conformation change | 96/4864 | 290/18723 | 3.87e-03 | 2.07e-02 | 96 |
| GO:000632520 | Thyroid | PTC | chromatin organization | 183/5968 | 409/18723 | 2.55e-08 | 5.70e-07 | 183 |
| GO:00062606 | Thyroid | PTC | DNA replication | 114/5968 | 260/18723 | 3.09e-05 | 2.95e-04 | 114 |
| GO:00063385 | Thyroid | PTC | chromatin remodeling | 106/5968 | 255/18723 | 6.56e-04 | 4.13e-03 | 106 |
| GO:0006325110 | Thyroid | ATC | chromatin organization | 189/6293 | 409/18723 | 6.40e-08 | 1.13e-06 | 189 |
| GO:000626013 | Thyroid | ATC | DNA replication | 124/6293 | 260/18723 | 1.58e-06 | 1.93e-05 | 124 |
| GO:000633813 | Thyroid | ATC | chromatin remodeling | 109/6293 | 255/18723 | 1.38e-03 | 7.15e-03 | 109 |
| GO:00718242 | Thyroid | ATC | protein-DNA complex subunit organization | 103/6293 | 241/18723 | 1.84e-03 | 9.03e-03 | 103 |
| Page: 1 |
| Pathway ID | Tissue | Disease Stage | Description | Gene Ratio | Bg Ratio | pvalue | p.adjust | qvalue | Count |
| hsa0421828 | Esophagus | HGIN | Cellular senescence | 42/1383 | 156/8465 | 4.94e-04 | 5.03e-03 | 4.00e-03 | 42 |
| hsa04218111 | Esophagus | HGIN | Cellular senescence | 42/1383 | 156/8465 | 4.94e-04 | 5.03e-03 | 4.00e-03 | 42 |
| hsa0421829 | Esophagus | ESCC | Cellular senescence | 119/4205 | 156/8465 | 5.89e-12 | 9.40e-11 | 4.81e-11 | 119 |
| hsa0421838 | Esophagus | ESCC | Cellular senescence | 119/4205 | 156/8465 | 5.89e-12 | 9.40e-11 | 4.81e-11 | 119 |
| hsa042187 | Liver | Cirrhotic | Cellular senescence | 66/2530 | 156/8465 | 5.94e-04 | 3.60e-03 | 2.22e-03 | 66 |
| hsa0421812 | Liver | Cirrhotic | Cellular senescence | 66/2530 | 156/8465 | 5.94e-04 | 3.60e-03 | 2.22e-03 | 66 |
| hsa0421822 | Liver | HCC | Cellular senescence | 102/4020 | 156/8465 | 4.18e-06 | 3.59e-05 | 2.00e-05 | 102 |
| hsa0421832 | Liver | HCC | Cellular senescence | 102/4020 | 156/8465 | 4.18e-06 | 3.59e-05 | 2.00e-05 | 102 |
| hsa0421820 | Oral cavity | OSCC | Cellular senescence | 112/3704 | 156/8465 | 8.04e-13 | 1.42e-11 | 7.21e-12 | 112 |
| hsa04218110 | Oral cavity | OSCC | Cellular senescence | 112/3704 | 156/8465 | 8.04e-13 | 1.42e-11 | 7.21e-12 | 112 |
| hsa0421827 | Oral cavity | LP | Cellular senescence | 71/2418 | 156/8465 | 4.17e-06 | 3.75e-05 | 2.42e-05 | 71 |
| hsa0421837 | Oral cavity | LP | Cellular senescence | 71/2418 | 156/8465 | 4.17e-06 | 3.75e-05 | 2.42e-05 | 71 |
| Page: 1 |
Top |
Cell-cell communication analysis |
| Identification of potential cell-cell interactions between two cell types and their ligand-receptor pairs for different disease states |
| Ligand | Receptor | LRpair | Pathway | Tissue | Disease Stage |
| Page: 1 |
Top |
Single-cell gene regulatory network inference analysis |
| Find out the significant the regulons (TFs) and the target genes of each regulon across cell types for different disease states |
| TF | Cell Type | Tissue | Disease Stage | Target Gene | RSS | Regulon Activity |
| ∗The dot plots of a searched regulon are shown for all cell subpopulations in each disease state of each tissue based on the regulon specific score inferred using pySCENIC and by calculating the average expression. |
| Page: 1 |
Top |
Somatic mutation of malignant transformation related genes |
| Annotation of somatic variants for genes involved in malignant transformation |
| Hugo Symbol | Variant Class | Variant Classification | dbSNP RS | HGVSc | HGVSp | HGVSp Short | SWISSPROT | BIOTYPE | SIFT | PolyPhen | Tumor Sample Barcode | Tissue | Histology | Sex | Age | Stage | Therapy Types | Drugs | Outcome |
| RBBP4 | SNV | Missense_Mutation | novel | c.895G>T | p.Ala299Ser | p.A299S | Q09028 | protein_coding | tolerated(0.05) | benign(0.051) | TCGA-A8-A09G-01 | Breast | breast invasive carcinoma | Female | >=65 | III/IV | Unknown | Unknown | SD |
| RBBP4 | SNV | Missense_Mutation | c.1231N>C | p.Asp411His | p.D411H | Q09028 | protein_coding | deleterious(0.01) | possibly_damaging(0.842) | TCGA-JW-A5VL-01 | Cervix | cervical & endocervical cancer | Female | <65 | I/II | Unknown | Unknown | SD | |
| RBBP4 | SNV | Missense_Mutation | novel | c.1108C>A | p.His370Asn | p.H370N | Q09028 | protein_coding | deleterious(0) | probably_damaging(1) | TCGA-AZ-4315-01 | Colorectum | colon adenocarcinoma | Male | <65 | I/II | Unknown | Unknown | SD |
| RBBP4 | SNV | Missense_Mutation | novel | c.91N>A | p.Leu31Ile | p.L31I | Q09028 | protein_coding | deleterious(0.01) | possibly_damaging(0.62) | TCGA-CA-6717-01 | Colorectum | colon adenocarcinoma | Male | <65 | I/II | Chemotherapy | oxaliplatin | CR |
| RBBP4 | SNV | Missense_Mutation | novel | c.1218N>T | p.Glu406Asp | p.E406D | Q09028 | protein_coding | tolerated(0.39) | benign(0) | TCGA-CA-6717-01 | Colorectum | colon adenocarcinoma | Male | <65 | I/II | Chemotherapy | oxaliplatin | CR |
| RBBP4 | SNV | Missense_Mutation | rs773549765 | c.284C>T | p.Ala95Val | p.A95V | Q09028 | protein_coding | tolerated(0.15) | benign(0.028) | TCGA-G4-6309-01 | Colorectum | colon adenocarcinoma | Female | <65 | III/IV | Chemotherapy | xeloda | PD |
| RBBP4 | SNV | Missense_Mutation | c.1056N>T | p.Glu352Asp | p.E352D | Q09028 | protein_coding | tolerated(0.23) | benign(0) | TCGA-G4-6586-01 | Colorectum | colon adenocarcinoma | Female | >=65 | I/II | Unknown | Unknown | SD | |
| RBBP4 | SNV | Missense_Mutation | novel | c.580N>A | p.Leu194Ile | p.L194I | Q09028 | protein_coding | tolerated(0.12) | benign(0.069) | TCGA-A5-A0G1-01 | Endometrium | uterine corpus endometrioid carcinoma | Female | >=65 | I/II | Unknown | Unknown | SD |
| RBBP4 | SNV | Missense_Mutation | novel | c.514N>T | p.Arg172Cys | p.R172C | Q09028 | protein_coding | tolerated(0.05) | benign(0.062) | TCGA-A5-A0G2-01 | Endometrium | uterine corpus endometrioid carcinoma | Female | <65 | III/IV | Unknown | Unknown | SD |
| RBBP4 | SNV | Missense_Mutation | novel | c.911N>T | p.Arg304Ile | p.R304I | Q09028 | protein_coding | deleterious(0) | possibly_damaging(0.875) | TCGA-A5-A2K5-01 | Endometrium | uterine corpus endometrioid carcinoma | Female | >=65 | I/II | Unknown | Unknown | SD |
| Page: 1 2 3 4 |
Top |
Related drugs of malignant transformation related genes |
| Identification of chemicals and drugs interact with genes involved in malignant transfromation |
| (DGIdb 4.0) |
| Entrez ID | Symbol | Category | Interaction Types | Drug Claim Name | Drug Name | PMIDs |
| Page: 1 |

Copyright 2023-Present -The University of Texas Health Science Center at Houston |