| Tissue | Expression Dynamics | Abbreviation |
| Esophagus | 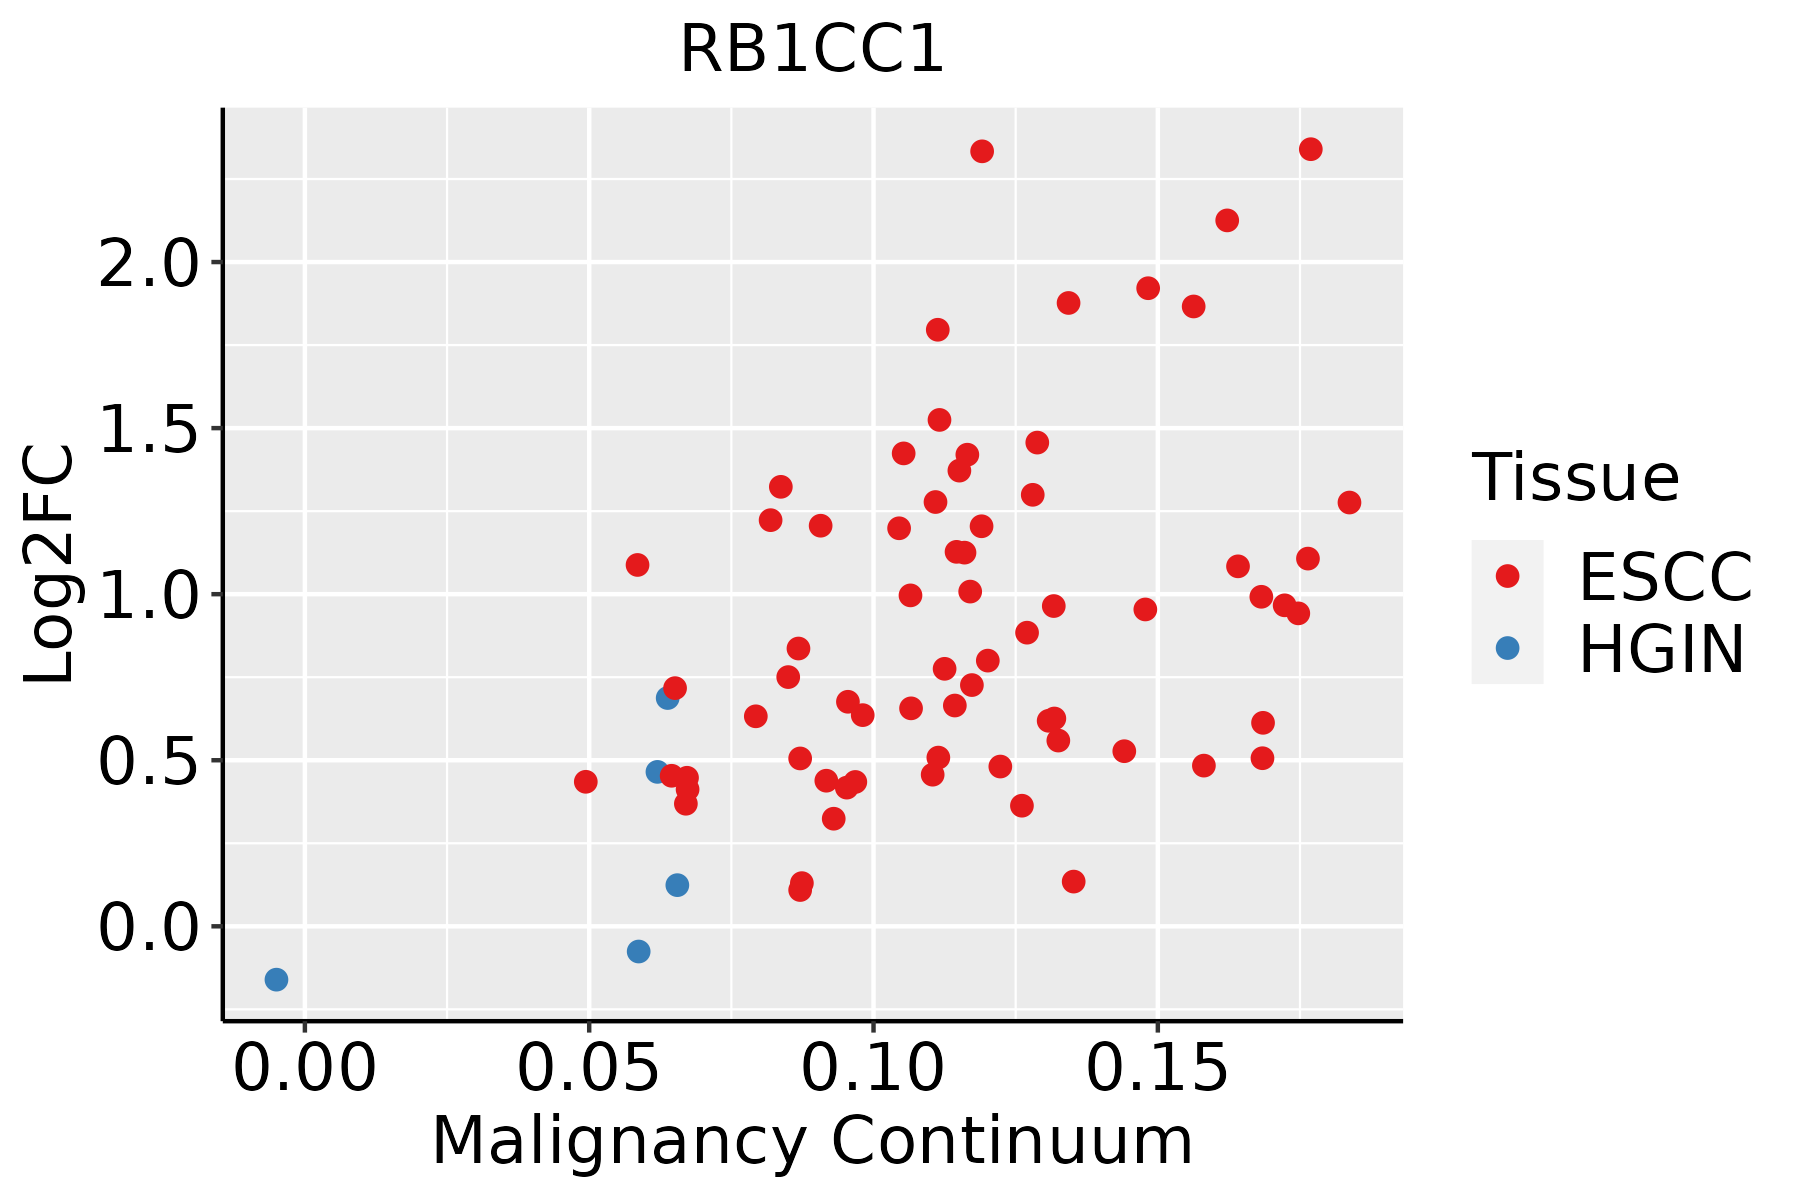 | ESCC: Esophageal squamous cell carcinoma |
| HGIN: High-grade intraepithelial neoplasias |
| LGIN: Low-grade intraepithelial neoplasias |
| Liver | 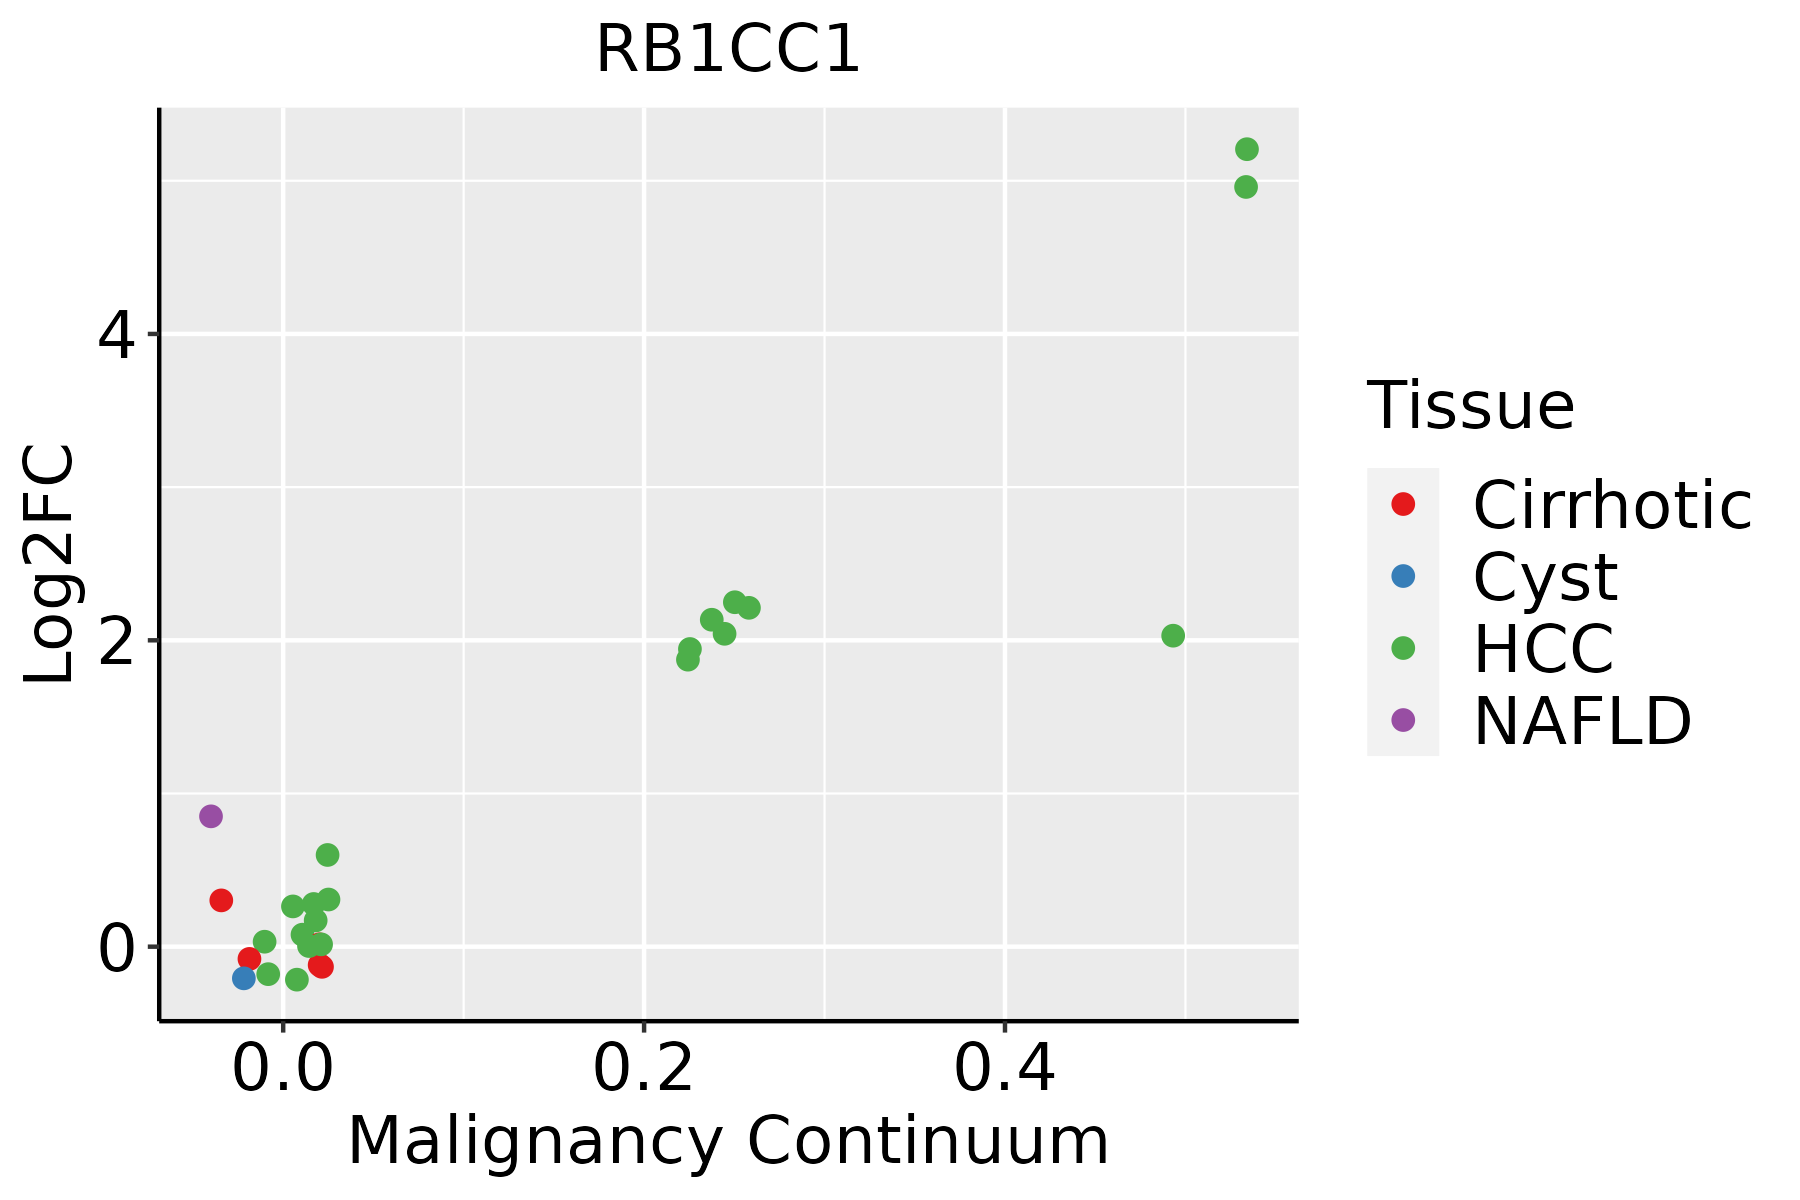 | HCC: Hepatocellular carcinoma |
| NAFLD: Non-alcoholic fatty liver disease |
| Lung |  | AAH: Atypical adenomatous hyperplasia |
| AIS: Adenocarcinoma in situ |
| IAC: Invasive lung adenocarcinoma |
| MIA: Minimally invasive adenocarcinoma |
| Oral Cavity | 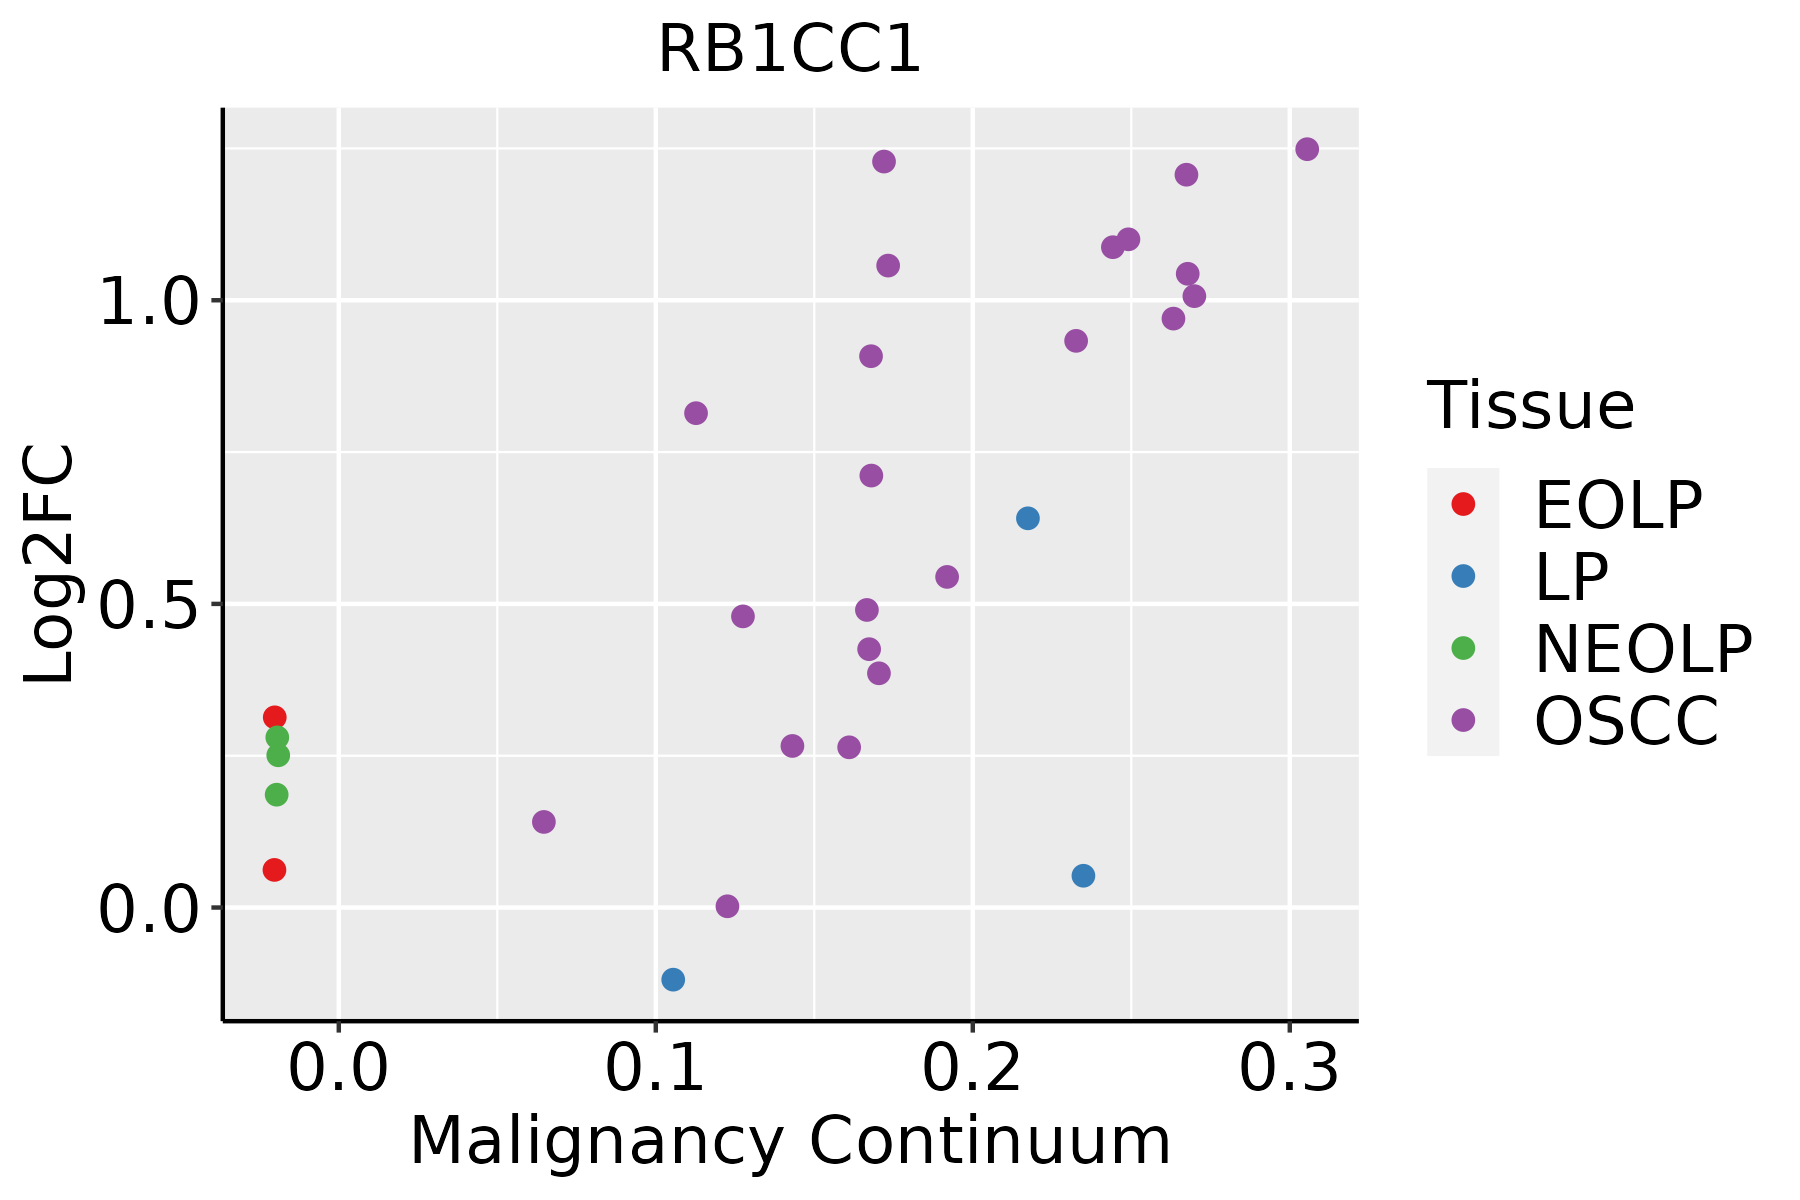 | EOLP: Erosive Oral lichen planus |
| LP: leukoplakia |
| NEOLP: Non-erosive oral lichen planus |
| OSCC: Oral squamous cell carcinoma |
| Prostate | 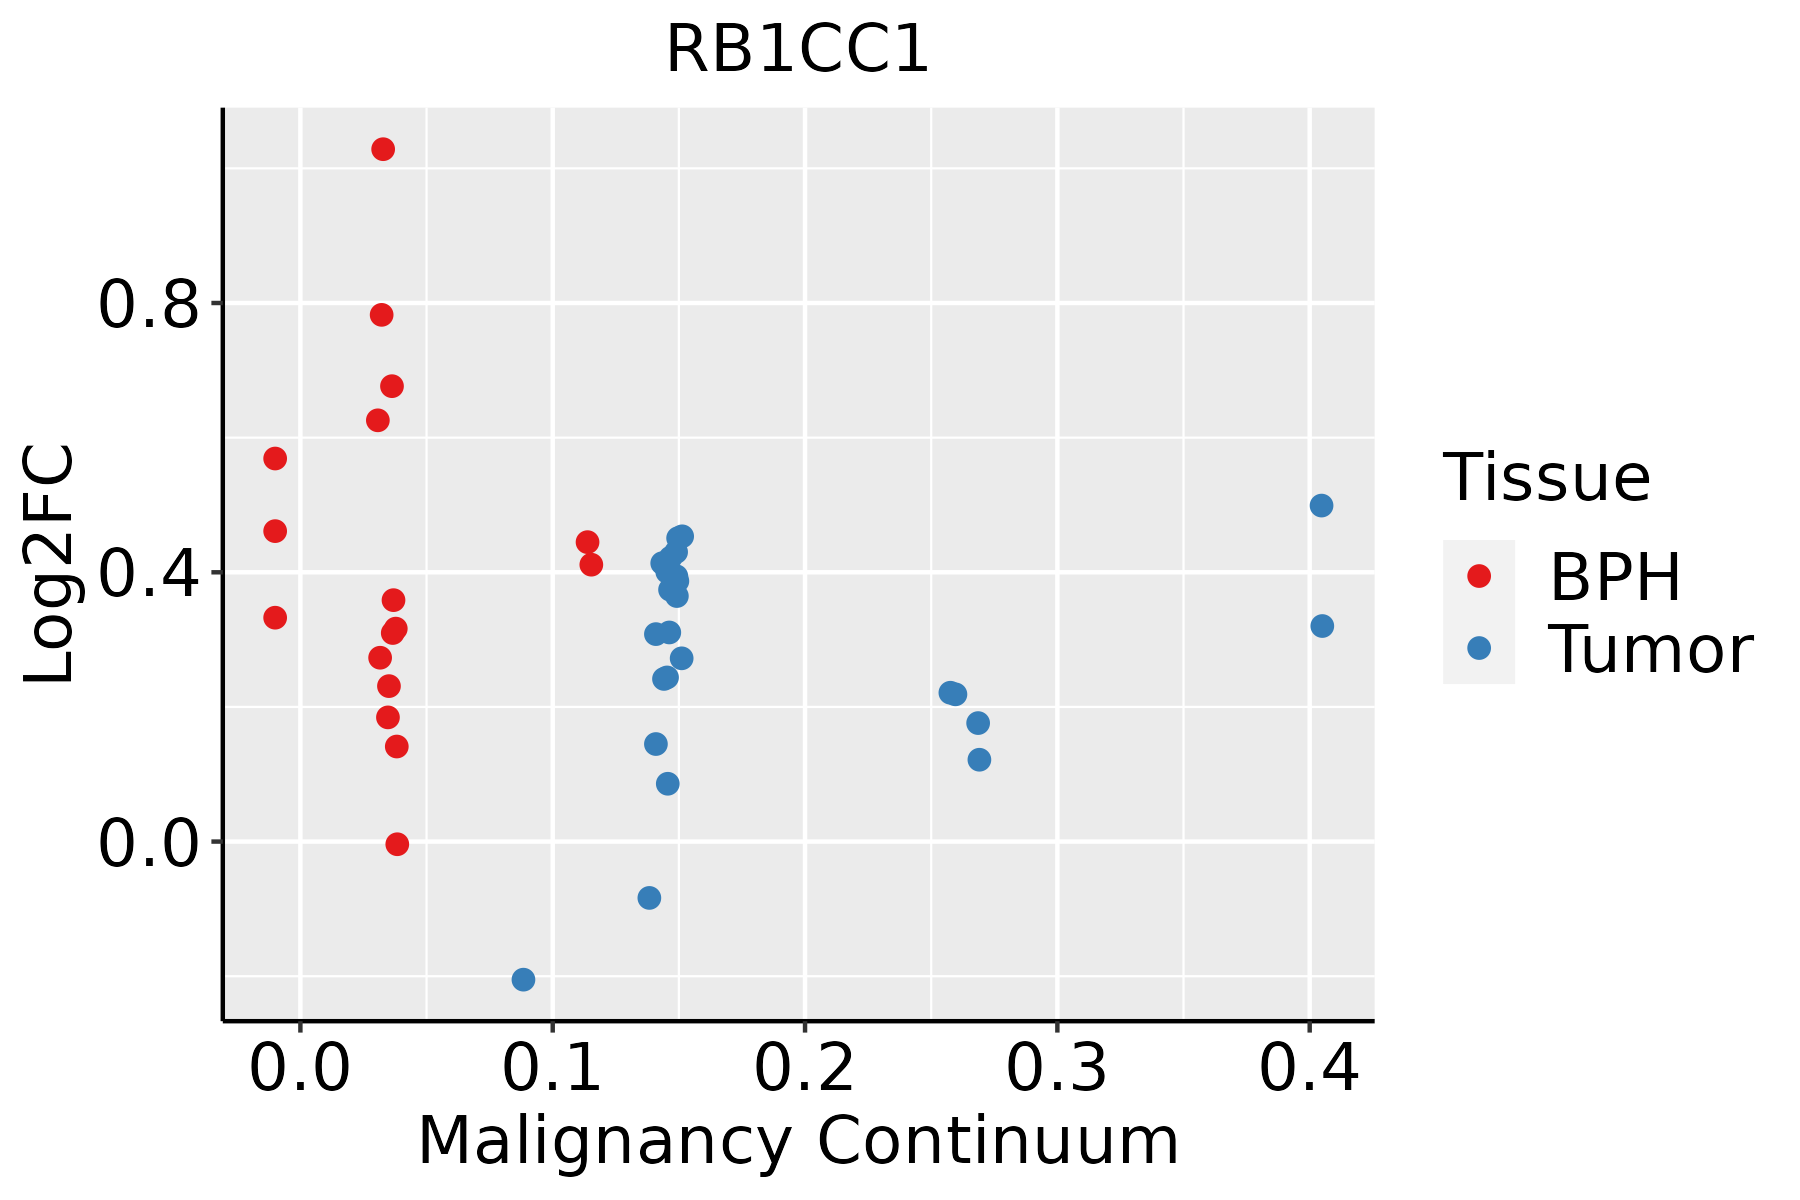 | BPH: Benign Prostatic Hyperplasia |
| Skin |  | AK: Actinic keratosis |
| cSCC: Cutaneous squamous cell carcinoma |
| SCCIS:squamous cell carcinoma in situ |
| Thyroid |  | ATC: Anaplastic thyroid cancer |
| HT: Hashimoto's thyroiditis |
| PTC: Papillary thyroid cancer |
| GO ID | Tissue | Disease Stage | Description | Gene Ratio | Bg Ratio | pvalue | p.adjust | Count |
| GO:000609120 | Esophagus | HGIN | generation of precursor metabolites and energy | 145/2587 | 490/18723 | 3.41e-20 | 2.04e-17 | 145 |
| GO:001598020 | Esophagus | HGIN | energy derivation by oxidation of organic compounds | 105/2587 | 318/18723 | 1.16e-18 | 4.99e-16 | 105 |
| GO:200123327 | Esophagus | HGIN | regulation of apoptotic signaling pathway | 97/2587 | 356/18723 | 1.36e-11 | 1.57e-09 | 97 |
| GO:001623616 | Esophagus | HGIN | macroautophagy | 77/2587 | 291/18723 | 7.15e-09 | 4.61e-07 | 77 |
| GO:002241120 | Esophagus | HGIN | cellular component disassembly | 102/2587 | 443/18723 | 8.31e-08 | 4.33e-06 | 102 |
| GO:200123427 | Esophagus | HGIN | negative regulation of apoptotic signaling pathway | 59/2587 | 224/18723 | 4.68e-07 | 2.07e-05 | 59 |
| GO:19030089 | Esophagus | HGIN | organelle disassembly | 36/2587 | 114/18723 | 8.60e-07 | 3.58e-05 | 36 |
| GO:009719126 | Esophagus | HGIN | extrinsic apoptotic signaling pathway | 56/2587 | 219/18723 | 2.48e-06 | 8.80e-05 | 56 |
| GO:000042216 | Esophagus | HGIN | autophagy of mitochondrion | 25/2587 | 81/18723 | 5.95e-05 | 1.38e-03 | 25 |
| GO:006172616 | Esophagus | HGIN | mitochondrion disassembly | 25/2587 | 81/18723 | 5.95e-05 | 1.38e-03 | 25 |
| GO:00070336 | Esophagus | HGIN | vacuole organization | 44/2587 | 180/18723 | 8.97e-05 | 1.96e-03 | 44 |
| GO:004873225 | Esophagus | HGIN | gland development | 88/2587 | 436/18723 | 1.34e-04 | 2.71e-03 | 88 |
| GO:19050375 | Esophagus | HGIN | autophagosome organization | 28/2587 | 103/18723 | 2.58e-04 | 4.53e-03 | 28 |
| GO:006100820 | Esophagus | HGIN | hepaticobiliary system development | 37/2587 | 150/18723 | 2.58e-04 | 4.53e-03 | 37 |
| GO:000188920 | Esophagus | HGIN | liver development | 36/2587 | 147/18723 | 3.61e-04 | 5.68e-03 | 36 |
| GO:200123626 | Esophagus | HGIN | regulation of extrinsic apoptotic signaling pathway | 36/2587 | 151/18723 | 6.20e-04 | 8.58e-03 | 36 |
| GO:00000455 | Esophagus | HGIN | autophagosome assembly | 26/2587 | 99/18723 | 7.45e-04 | 9.90e-03 | 26 |
| GO:00619128 | Esophagus | HGIN | selective autophagy | 19/2587 | 68/18723 | 1.68e-03 | 1.85e-02 | 19 |
| GO:200123725 | Esophagus | HGIN | negative regulation of extrinsic apoptotic signaling pathway | 23/2587 | 97/18723 | 5.91e-03 | 4.78e-02 | 23 |
| GO:2001233111 | Esophagus | ESCC | regulation of apoptotic signaling pathway | 256/8552 | 356/18723 | 4.11e-24 | 1.04e-21 | 256 |
| Pathway ID | Tissue | Disease Stage | Description | Gene Ratio | Bg Ratio | pvalue | p.adjust | qvalue | Count |
| hsa0501630 | Esophagus | HGIN | Huntington disease | 129/1383 | 306/8465 | 6.81e-28 | 7.41e-26 | 5.88e-26 | 129 |
| hsa0501430 | Esophagus | HGIN | Amyotrophic lateral sclerosis | 140/1383 | 364/8465 | 2.13e-25 | 1.16e-23 | 9.19e-24 | 140 |
| hsa0502230 | Esophagus | HGIN | Pathways of neurodegeneration - multiple diseases | 153/1383 | 476/8465 | 1.22e-18 | 4.41e-17 | 3.50e-17 | 153 |
| hsa0501030 | Esophagus | HGIN | Alzheimer disease | 130/1383 | 384/8465 | 5.26e-18 | 1.71e-16 | 1.36e-16 | 130 |
| hsa0501727 | Esophagus | HGIN | Spinocerebellar ataxia | 43/1383 | 143/8465 | 2.68e-05 | 3.64e-04 | 2.89e-04 | 43 |
| hsa05016113 | Esophagus | HGIN | Huntington disease | 129/1383 | 306/8465 | 6.81e-28 | 7.41e-26 | 5.88e-26 | 129 |
| hsa05014113 | Esophagus | HGIN | Amyotrophic lateral sclerosis | 140/1383 | 364/8465 | 2.13e-25 | 1.16e-23 | 9.19e-24 | 140 |
| hsa05022113 | Esophagus | HGIN | Pathways of neurodegeneration - multiple diseases | 153/1383 | 476/8465 | 1.22e-18 | 4.41e-17 | 3.50e-17 | 153 |
| hsa05010113 | Esophagus | HGIN | Alzheimer disease | 130/1383 | 384/8465 | 5.26e-18 | 1.71e-16 | 1.36e-16 | 130 |
| hsa05017112 | Esophagus | HGIN | Spinocerebellar ataxia | 43/1383 | 143/8465 | 2.68e-05 | 3.64e-04 | 2.89e-04 | 43 |
| hsa05014210 | Esophagus | ESCC | Amyotrophic lateral sclerosis | 266/4205 | 364/8465 | 1.31e-20 | 2.20e-18 | 1.13e-18 | 266 |
| hsa05016210 | Esophagus | ESCC | Huntington disease | 226/4205 | 306/8465 | 1.38e-18 | 8.72e-17 | 4.46e-17 | 226 |
| hsa05022210 | Esophagus | ESCC | Pathways of neurodegeneration - multiple diseases | 318/4205 | 476/8465 | 6.10e-15 | 2.04e-13 | 1.05e-13 | 318 |
| hsa05010210 | Esophagus | ESCC | Alzheimer disease | 263/4205 | 384/8465 | 1.80e-14 | 5.47e-13 | 2.80e-13 | 263 |
| hsa0414010 | Esophagus | ESCC | Autophagy - animal | 101/4205 | 141/8465 | 7.60e-08 | 6.21e-07 | 3.18e-07 | 101 |
| hsa0501728 | Esophagus | ESCC | Spinocerebellar ataxia | 94/4205 | 143/8465 | 6.77e-05 | 2.90e-04 | 1.48e-04 | 94 |
| hsa0421114 | Esophagus | ESCC | Longevity regulating pathway | 58/4205 | 89/8465 | 2.19e-03 | 6.16e-03 | 3.16e-03 | 58 |
| hsa0501438 | Esophagus | ESCC | Amyotrophic lateral sclerosis | 266/4205 | 364/8465 | 1.31e-20 | 2.20e-18 | 1.13e-18 | 266 |
| hsa0501638 | Esophagus | ESCC | Huntington disease | 226/4205 | 306/8465 | 1.38e-18 | 8.72e-17 | 4.46e-17 | 226 |
| hsa0502238 | Esophagus | ESCC | Pathways of neurodegeneration - multiple diseases | 318/4205 | 476/8465 | 6.10e-15 | 2.04e-13 | 1.05e-13 | 318 |
| Hugo Symbol | Variant Class | Variant Classification | dbSNP RS | HGVSc | HGVSp | HGVSp Short | SWISSPROT | BIOTYPE | SIFT | PolyPhen | Tumor Sample Barcode | Tissue | Histology | Sex | Age | Stage | Therapy Types | Drugs | Outcome |
| RB1CC1 | SNV | Missense_Mutation | novel | c.1784N>A | p.Pro595Gln | p.P595Q | Q8TDY2 | protein_coding | deleterious(0.04) | possibly_damaging(0.832) | TCGA-A7-A0DB-01 | Breast | breast invasive carcinoma | Female | <65 | I/II | Hormone Therapy | arimidex | SD |
| RB1CC1 | SNV | Missense_Mutation | novel | c.3995N>G | p.Phe1332Cys | p.F1332C | Q8TDY2 | protein_coding | deleterious(0) | probably_damaging(0.996) | TCGA-AN-A046-01 | Breast | breast invasive carcinoma | Female | >=65 | I/II | Unknown | Unknown | SD |
| RB1CC1 | SNV | Missense_Mutation | | c.3428N>T | p.Arg1143Ile | p.R1143I | Q8TDY2 | protein_coding | deleterious_low_confidence(0) | possibly_damaging(0.888) | TCGA-AN-A046-01 | Breast | breast invasive carcinoma | Female | >=65 | I/II | Unknown | Unknown | SD |
| RB1CC1 | SNV | Missense_Mutation | novel | c.1511N>C | p.Val504Ala | p.V504A | Q8TDY2 | protein_coding | deleterious(0) | probably_damaging(0.978) | TCGA-B6-A0RS-01 | Breast | breast invasive carcinoma | Female | <65 | I/II | Unknown | Unknown | PD |
| RB1CC1 | SNV | Missense_Mutation | | c.3922G>A | p.Glu1308Lys | p.E1308K | Q8TDY2 | protein_coding | tolerated(0.81) | benign(0.212) | TCGA-BH-A0E2-01 | Breast | breast invasive carcinoma | Female | <65 | III/IV | Chemotherapy | doxorubicin | SD |
| RB1CC1 | SNV | Missense_Mutation | | c.4472G>A | p.Arg1491Lys | p.R1491K | Q8TDY2 | protein_coding | deleterious(0.02) | probably_damaging(0.979) | TCGA-BH-A0GZ-01 | Breast | breast invasive carcinoma | Female | <65 | I/II | Hormone Therapy | arimidex | SD |
| RB1CC1 | SNV | Missense_Mutation | rs145052579 | c.992N>T | p.Ser331Phe | p.S331F | Q8TDY2 | protein_coding | deleterious(0) | probably_damaging(0.996) | TCGA-BH-A0HF-01 | Breast | breast invasive carcinoma | Female | >=65 | I/II | Hormone Therapy | arimidex | SD |
| RB1CC1 | SNV | Missense_Mutation | novel | c.1036N>A | p.Glu346Lys | p.E346K | Q8TDY2 | protein_coding | deleterious(0) | benign(0.073) | TCGA-D8-A1JE-01 | Breast | breast invasive carcinoma | Female | <65 | I/II | Chemotherapy | adriamicin | SD |
| RB1CC1 | SNV | Missense_Mutation | | c.983G>T | p.Cys328Phe | p.C328F | Q8TDY2 | protein_coding | deleterious(0) | probably_damaging(0.994) | TCGA-D8-A1JH-01 | Breast | breast invasive carcinoma | Female | <65 | I/II | Hormone Therapy | nolvadex | SD |
| RB1CC1 | SNV | Missense_Mutation | | c.629N>A | p.Arg210Lys | p.R210K | Q8TDY2 | protein_coding | deleterious(0.03) | benign(0.437) | TCGA-E2-A1LH-01 | Breast | breast invasive carcinoma | Female | <65 | I/II | Chemotherapy | adriamycin | SD |


