
|
|||||
|
 | |
| |
| |
| |
| |
| |
|
Gene: RAVER2 |
Gene summary for RAVER2 |
| Gene information | Species | Human | Gene symbol | RAVER2 | Gene ID | 55225 |
| Gene name | ribonucleoprotein, PTB binding 2 | |
| Gene Alias | RAVER2 | |
| Cytomap | 1p31.3 | |
| Gene Type | protein-coding | GO ID | GO:0000375 | UniProtAcc | Q9HCJ3 |
Top |
Malignant transformation analysis |
| Identification of the aberrant gene expression in precancerous and cancerous lesions by comparing the gene expression of stem-like cells in diseased tissues with normal stem cells |
| Entrez ID | Symbol | Replicates | Species | Organ | Tissue | Adj P-value | Log2FC | Malignancy |
| 55225 | RAVER2 | HTA11_3410_2000001011 | Human | Colorectum | AD | 1.06e-14 | -5.90e-01 | 0.0155 |
| 55225 | RAVER2 | HTA11_696_2000001011 | Human | Colorectum | AD | 2.75e-02 | -2.19e-01 | -0.1464 |
| 55225 | RAVER2 | HTA11_866_3004761011 | Human | Colorectum | AD | 7.55e-11 | -5.85e-01 | 0.096 |
| 55225 | RAVER2 | HTA11_7696_3000711011 | Human | Colorectum | AD | 2.84e-14 | -5.28e-01 | 0.0674 |
| 55225 | RAVER2 | HTA11_99999970781_79442 | Human | Colorectum | MSS | 1.92e-03 | -3.49e-01 | 0.294 |
| 55225 | RAVER2 | HTA11_99999971662_82457 | Human | Colorectum | MSS | 7.98e-04 | -3.38e-01 | 0.3859 |
| 55225 | RAVER2 | HTA11_99999973899_84307 | Human | Colorectum | MSS | 8.53e-05 | -6.09e-01 | 0.2585 |
| 55225 | RAVER2 | HTA11_99999974143_84620 | Human | Colorectum | MSS | 7.23e-21 | -6.13e-01 | 0.3005 |
| 55225 | RAVER2 | F007 | Human | Colorectum | FAP | 7.20e-03 | -3.79e-01 | 0.1176 |
| 55225 | RAVER2 | A001-C-207 | Human | Colorectum | FAP | 3.88e-07 | -4.13e-01 | 0.1278 |
| 55225 | RAVER2 | A015-C-203 | Human | Colorectum | FAP | 1.44e-30 | -5.04e-01 | -0.1294 |
| 55225 | RAVER2 | A015-C-204 | Human | Colorectum | FAP | 1.91e-06 | -3.53e-01 | -0.0228 |
| 55225 | RAVER2 | A014-C-040 | Human | Colorectum | FAP | 8.39e-04 | -2.87e-01 | -0.1184 |
| 55225 | RAVER2 | A002-C-201 | Human | Colorectum | FAP | 3.50e-16 | -4.32e-01 | 0.0324 |
| 55225 | RAVER2 | A002-C-203 | Human | Colorectum | FAP | 4.42e-05 | -2.05e-01 | 0.2786 |
| 55225 | RAVER2 | A001-C-119 | Human | Colorectum | FAP | 8.17e-15 | -6.41e-01 | -0.1557 |
| 55225 | RAVER2 | A001-C-108 | Human | Colorectum | FAP | 6.75e-21 | -3.87e-01 | -0.0272 |
| 55225 | RAVER2 | A002-C-205 | Human | Colorectum | FAP | 1.76e-23 | -5.65e-01 | -0.1236 |
| 55225 | RAVER2 | A001-C-104 | Human | Colorectum | FAP | 1.57e-06 | -3.27e-01 | 0.0184 |
| 55225 | RAVER2 | A015-C-005 | Human | Colorectum | FAP | 1.20e-07 | -3.78e-01 | -0.0336 |
| Page: 1 2 |
| Tissue | Expression Dynamics | Abbreviation |
| Colorectum (GSE201348) |  | FAP: Familial adenomatous polyposis |
| CRC: Colorectal cancer | ||
| Colorectum (HTA11) | 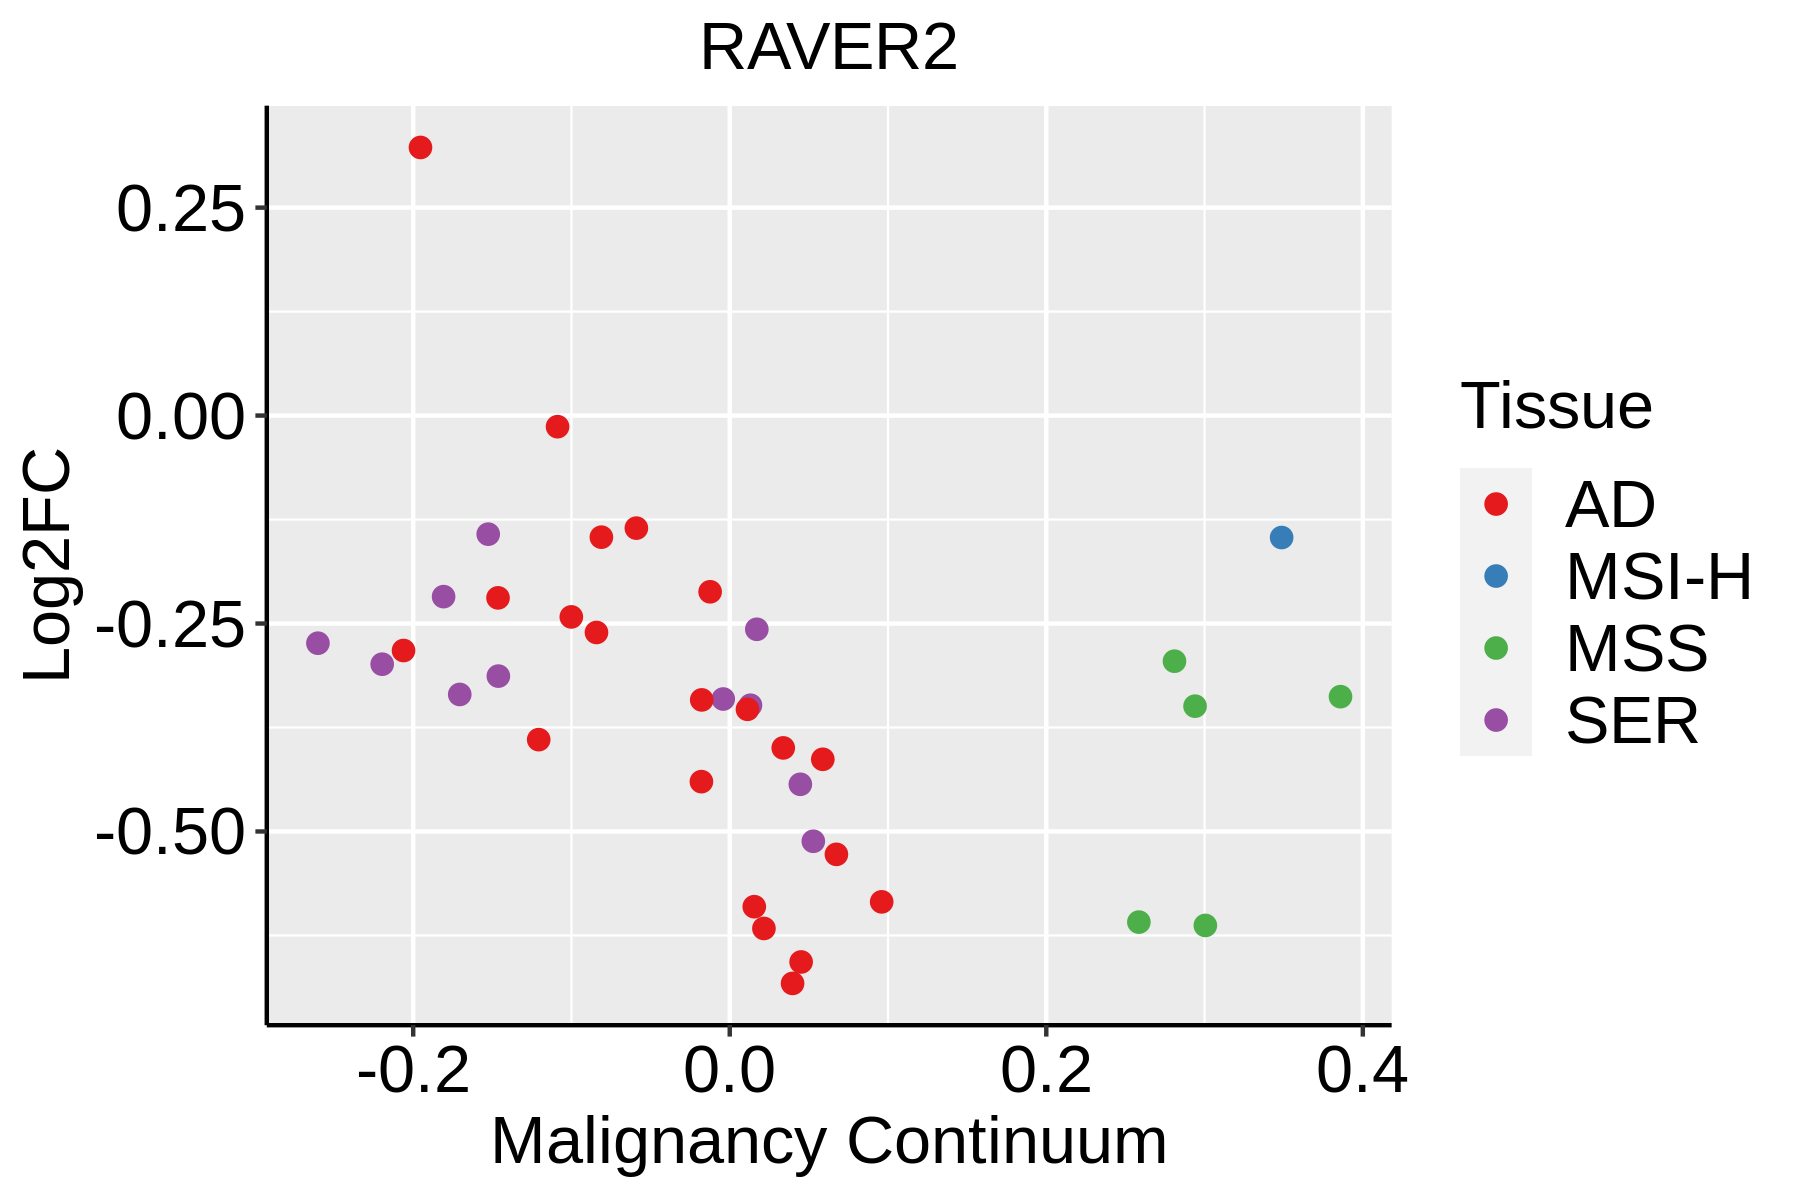 | AD: Adenomas |
| SER: Sessile serrated lesions | ||
| MSI-H: Microsatellite-high colorectal cancer | ||
| MSS: Microsatellite stable colorectal cancer |
| ∗log2FC in expression of this searched gene in stem-like cells from each diseased tissue sample relative to stem-like cells in normal samples in each tissue plotted against the malignancy continuum. Samples are colored based on if they are from different disease stage. |
Top |
Malignant transformation related pathway analysis |
| Find out the enriched GO biological processes and KEGG pathways involved in transition from healthy to precancer to cancer |
| Tissue | Disease Stage | Enriched GO biological Processes |
| Colorectum | AD |  |
| Colorectum | SER |  |
| Colorectum | MSS |  |
| Colorectum | MSI-H |  |
| Colorectum | FAP |  |
| ∗Top 15 enriched GO BP terms are showed in the bar plot of each disease state in each tissue. Each row represents a significant GO biological process which is colored according to the -log10(p.adjust). |
| Page: 1 2 3 4 5 6 7 8 9 |
| GO ID | Tissue | Disease Stage | Description | Gene Ratio | Bg Ratio | pvalue | p.adjust | Count |
| GO:0008380 | Colorectum | AD | RNA splicing | 169/3918 | 434/18723 | 3.59e-18 | 2.04e-15 | 169 |
| GO:0000377 | Colorectum | AD | RNA splicing, via transesterification reactions with bulged adenosine as nucleophile | 130/3918 | 320/18723 | 5.88e-16 | 2.16e-13 | 130 |
| GO:0000398 | Colorectum | AD | mRNA splicing, via spliceosome | 130/3918 | 320/18723 | 5.88e-16 | 2.16e-13 | 130 |
| GO:0000375 | Colorectum | AD | RNA splicing, via transesterification reactions | 131/3918 | 324/18723 | 7.11e-16 | 2.22e-13 | 131 |
| GO:1903311 | Colorectum | AD | regulation of mRNA metabolic process | 117/3918 | 288/18723 | 1.69e-14 | 4.23e-12 | 117 |
| GO:0043484 | Colorectum | AD | regulation of RNA splicing | 70/3918 | 148/18723 | 6.47e-13 | 1.16e-10 | 70 |
| GO:0048024 | Colorectum | AD | regulation of mRNA splicing, via spliceosome | 50/3918 | 101/18723 | 1.62e-10 | 1.56e-08 | 50 |
| GO:0050684 | Colorectum | AD | regulation of mRNA processing | 61/3918 | 137/18723 | 4.23e-10 | 3.58e-08 | 61 |
| GO:0000380 | Colorectum | AD | alternative mRNA splicing, via spliceosome | 33/3918 | 77/18723 | 1.13e-05 | 2.55e-04 | 33 |
| GO:0000381 | Colorectum | AD | regulation of alternative mRNA splicing, via spliceosome | 27/3918 | 60/18723 | 2.41e-05 | 4.66e-04 | 27 |
| GO:00083802 | Colorectum | MSS | RNA splicing | 159/3467 | 434/18723 | 1.75e-19 | 1.22e-16 | 159 |
| GO:19033112 | Colorectum | MSS | regulation of mRNA metabolic process | 115/3467 | 288/18723 | 1.23e-17 | 6.41e-15 | 115 |
| GO:00003772 | Colorectum | MSS | RNA splicing, via transesterification reactions with bulged adenosine as nucleophile | 121/3467 | 320/18723 | 2.52e-16 | 8.27e-14 | 121 |
| GO:00003982 | Colorectum | MSS | mRNA splicing, via spliceosome | 121/3467 | 320/18723 | 2.52e-16 | 8.27e-14 | 121 |
| GO:00003752 | Colorectum | MSS | RNA splicing, via transesterification reactions | 122/3467 | 324/18723 | 2.75e-16 | 8.58e-14 | 122 |
| GO:00434842 | Colorectum | MSS | regulation of RNA splicing | 66/3467 | 148/18723 | 2.44e-13 | 5.25e-11 | 66 |
| GO:00506842 | Colorectum | MSS | regulation of mRNA processing | 57/3467 | 137/18723 | 2.88e-10 | 2.68e-08 | 57 |
| GO:00480242 | Colorectum | MSS | regulation of mRNA splicing, via spliceosome | 46/3467 | 101/18723 | 4.20e-10 | 3.49e-08 | 46 |
| GO:00003802 | Colorectum | MSS | alternative mRNA splicing, via spliceosome | 33/3467 | 77/18723 | 6.87e-07 | 2.48e-05 | 33 |
| GO:00003812 | Colorectum | MSS | regulation of alternative mRNA splicing, via spliceosome | 26/3467 | 60/18723 | 8.01e-06 | 2.03e-04 | 26 |
| Page: 1 2 |
| Pathway ID | Tissue | Disease Stage | Description | Gene Ratio | Bg Ratio | pvalue | p.adjust | qvalue | Count |
| Page: 1 |
Top |
Cell-cell communication analysis |
| Identification of potential cell-cell interactions between two cell types and their ligand-receptor pairs for different disease states |
| Ligand | Receptor | LRpair | Pathway | Tissue | Disease Stage |
| Page: 1 |
Top |
Single-cell gene regulatory network inference analysis |
| Find out the significant the regulons (TFs) and the target genes of each regulon across cell types for different disease states |
| TF | Cell Type | Tissue | Disease Stage | Target Gene | RSS | Regulon Activity |
| ∗The dot plots of a searched regulon are shown for all cell subpopulations in each disease state of each tissue based on the regulon specific score inferred using pySCENIC and by calculating the average expression. |
| Page: 1 |
Top |
Somatic mutation of malignant transformation related genes |
| Annotation of somatic variants for genes involved in malignant transformation |
| Hugo Symbol | Variant Class | Variant Classification | dbSNP RS | HGVSc | HGVSp | HGVSp Short | SWISSPROT | BIOTYPE | SIFT | PolyPhen | Tumor Sample Barcode | Tissue | Histology | Sex | Age | Stage | Therapy Types | Drugs | Outcome |
| RAVER2 | SNV | Missense_Mutation | novel | c.115G>A | p.Glu39Lys | p.E39K | Q9HCJ3 | protein_coding | tolerated(0.61) | benign(0) | TCGA-A2-A0CR-01 | Breast | breast invasive carcinoma | Female | <65 | I/II | Chemotherapy | adriamycin | CR |
| RAVER2 | SNV | Missense_Mutation | c.1354C>G | p.His452Asp | p.H452D | Q9HCJ3 | protein_coding | tolerated(0.64) | benign(0.099) | TCGA-D8-A1J9-01 | Breast | breast invasive carcinoma | Female | <65 | I/II | Unknown | Unknown | SD | |
| RAVER2 | SNV | Missense_Mutation | novel | c.1516G>A | p.Glu506Lys | p.E506K | Q9HCJ3 | protein_coding | tolerated(0.24) | possibly_damaging(0.783) | TCGA-DG-A2KK-01 | Cervix | cervical & endocervical cancer | Female | <65 | III/IV | Chemotherapy | cisplatin | SD |
| RAVER2 | SNV | Missense_Mutation | novel | c.1815N>G | p.Ile605Met | p.I605M | Q9HCJ3 | protein_coding | deleterious(0.03) | possibly_damaging(0.482) | TCGA-HM-A4S6-01 | Cervix | cervical & endocervical cancer | Female | <65 | III/IV | Chemotherapy | cisplatin | CR |
| RAVER2 | SNV | Missense_Mutation | c.1646N>T | p.Ala549Val | p.A549V | Q9HCJ3 | protein_coding | tolerated(0.23) | benign(0.015) | TCGA-A6-6653-01 | Colorectum | colon adenocarcinoma | Male | >=65 | I/II | Unknown | Unknown | SD | |
| RAVER2 | SNV | Missense_Mutation | rs759218839 | c.2016N>T | p.Leu672Phe | p.L672F | Q9HCJ3 | protein_coding | tolerated(0.17) | benign(0.09) | TCGA-A6-6780-01 | Colorectum | colon adenocarcinoma | Male | >=65 | I/II | Unknown | Unknown | SD |
| RAVER2 | SNV | Missense_Mutation | novel | c.1880N>G | p.Asp627Gly | p.D627G | Q9HCJ3 | protein_coding | tolerated(0.06) | benign(0.041) | TCGA-AA-3947-01 | Colorectum | colon adenocarcinoma | Female | <65 | I/II | Unknown | Unknown | SD |
| RAVER2 | SNV | Missense_Mutation | rs781074957 | c.394G>T | p.Asp132Tyr | p.D132Y | Q9HCJ3 | protein_coding | deleterious(0) | probably_damaging(0.939) | TCGA-AA-A00N-01 | Colorectum | colon adenocarcinoma | Male | >=65 | I/II | Unknown | Unknown | PD |
| RAVER2 | SNV | Missense_Mutation | c.1927T>A | p.Tyr643Asn | p.Y643N | Q9HCJ3 | protein_coding | deleterious(0.02) | possibly_damaging(0.826) | TCGA-CK-4951-01 | Colorectum | colon adenocarcinoma | Female | >=65 | I/II | Unknown | Unknown | PD | |
| RAVER2 | SNV | Missense_Mutation | c.1141A>G | p.Met381Val | p.M381V | Q9HCJ3 | protein_coding | tolerated(0.71) | benign(0.003) | TCGA-CM-6168-01 | Colorectum | colon adenocarcinoma | Female | >=65 | I/II | Unknown | Unknown | SD |
| Page: 1 2 3 4 5 6 7 |
Top |
Related drugs of malignant transformation related genes |
| Identification of chemicals and drugs interact with genes involved in malignant transfromation |
| (DGIdb 4.0) |
| Entrez ID | Symbol | Category | Interaction Types | Drug Claim Name | Drug Name | PMIDs |
| Page: 1 |

Copyright 2023-Present -The University of Texas Health Science Center at Houston |