
|
|||||
|
 | |
| |
| |
| |
| |
| |
|
Gene: RAVER1 |
Gene summary for RAVER1 |
| Gene information | Species | Human | Gene symbol | RAVER1 | Gene ID | 125950 |
| Gene name | ribonucleoprotein, PTB binding 1 | |
| Gene Alias | RAVER1 | |
| Cytomap | 19p13.2 | |
| Gene Type | protein-coding | GO ID | GO:0000375 | UniProtAcc | E9PAU2 |
Top |
Malignant transformation analysis |
| Identification of the aberrant gene expression in precancerous and cancerous lesions by comparing the gene expression of stem-like cells in diseased tissues with normal stem cells |
| Entrez ID | Symbol | Replicates | Species | Organ | Tissue | Adj P-value | Log2FC | Malignancy |
| 125950 | RAVER1 | LZE7T | Human | Esophagus | ESCC | 3.01e-10 | 4.15e-01 | 0.0667 |
| 125950 | RAVER1 | LZE8T | Human | Esophagus | ESCC | 1.35e-07 | 2.12e-01 | 0.067 |
| 125950 | RAVER1 | LZE20T | Human | Esophagus | ESCC | 4.98e-02 | 1.08e-01 | 0.0662 |
| 125950 | RAVER1 | LZE22T | Human | Esophagus | ESCC | 1.57e-02 | 2.80e-01 | 0.068 |
| 125950 | RAVER1 | LZE24T | Human | Esophagus | ESCC | 2.54e-14 | 3.24e-01 | 0.0596 |
| 125950 | RAVER1 | LZE22D3 | Human | Esophagus | HGIN | 1.73e-02 | 4.41e-01 | 0.0653 |
| 125950 | RAVER1 | LZE21T | Human | Esophagus | ESCC | 6.52e-03 | 2.77e-01 | 0.0655 |
| 125950 | RAVER1 | P2T-E | Human | Esophagus | ESCC | 4.12e-11 | 1.86e-01 | 0.1177 |
| 125950 | RAVER1 | P4T-E | Human | Esophagus | ESCC | 6.27e-06 | 1.70e-01 | 0.1323 |
| 125950 | RAVER1 | P5T-E | Human | Esophagus | ESCC | 4.17e-05 | 1.27e-01 | 0.1327 |
| 125950 | RAVER1 | P8T-E | Human | Esophagus | ESCC | 2.02e-06 | 1.86e-01 | 0.0889 |
| 125950 | RAVER1 | P9T-E | Human | Esophagus | ESCC | 6.74e-06 | 1.76e-01 | 0.1131 |
| 125950 | RAVER1 | P10T-E | Human | Esophagus | ESCC | 1.47e-14 | 2.40e-01 | 0.116 |
| 125950 | RAVER1 | P11T-E | Human | Esophagus | ESCC | 1.13e-06 | 2.94e-01 | 0.1426 |
| 125950 | RAVER1 | P12T-E | Human | Esophagus | ESCC | 1.47e-14 | 2.69e-01 | 0.1122 |
| 125950 | RAVER1 | P15T-E | Human | Esophagus | ESCC | 5.83e-12 | 2.74e-01 | 0.1149 |
| 125950 | RAVER1 | P16T-E | Human | Esophagus | ESCC | 9.02e-11 | 2.14e-01 | 0.1153 |
| 125950 | RAVER1 | P17T-E | Human | Esophagus | ESCC | 4.48e-07 | 3.00e-01 | 0.1278 |
| 125950 | RAVER1 | P19T-E | Human | Esophagus | ESCC | 5.57e-05 | 3.76e-01 | 0.1662 |
| 125950 | RAVER1 | P20T-E | Human | Esophagus | ESCC | 4.38e-08 | 2.02e-01 | 0.1124 |
| Page: 1 2 3 4 |
| Tissue | Expression Dynamics | Abbreviation |
| Esophagus | 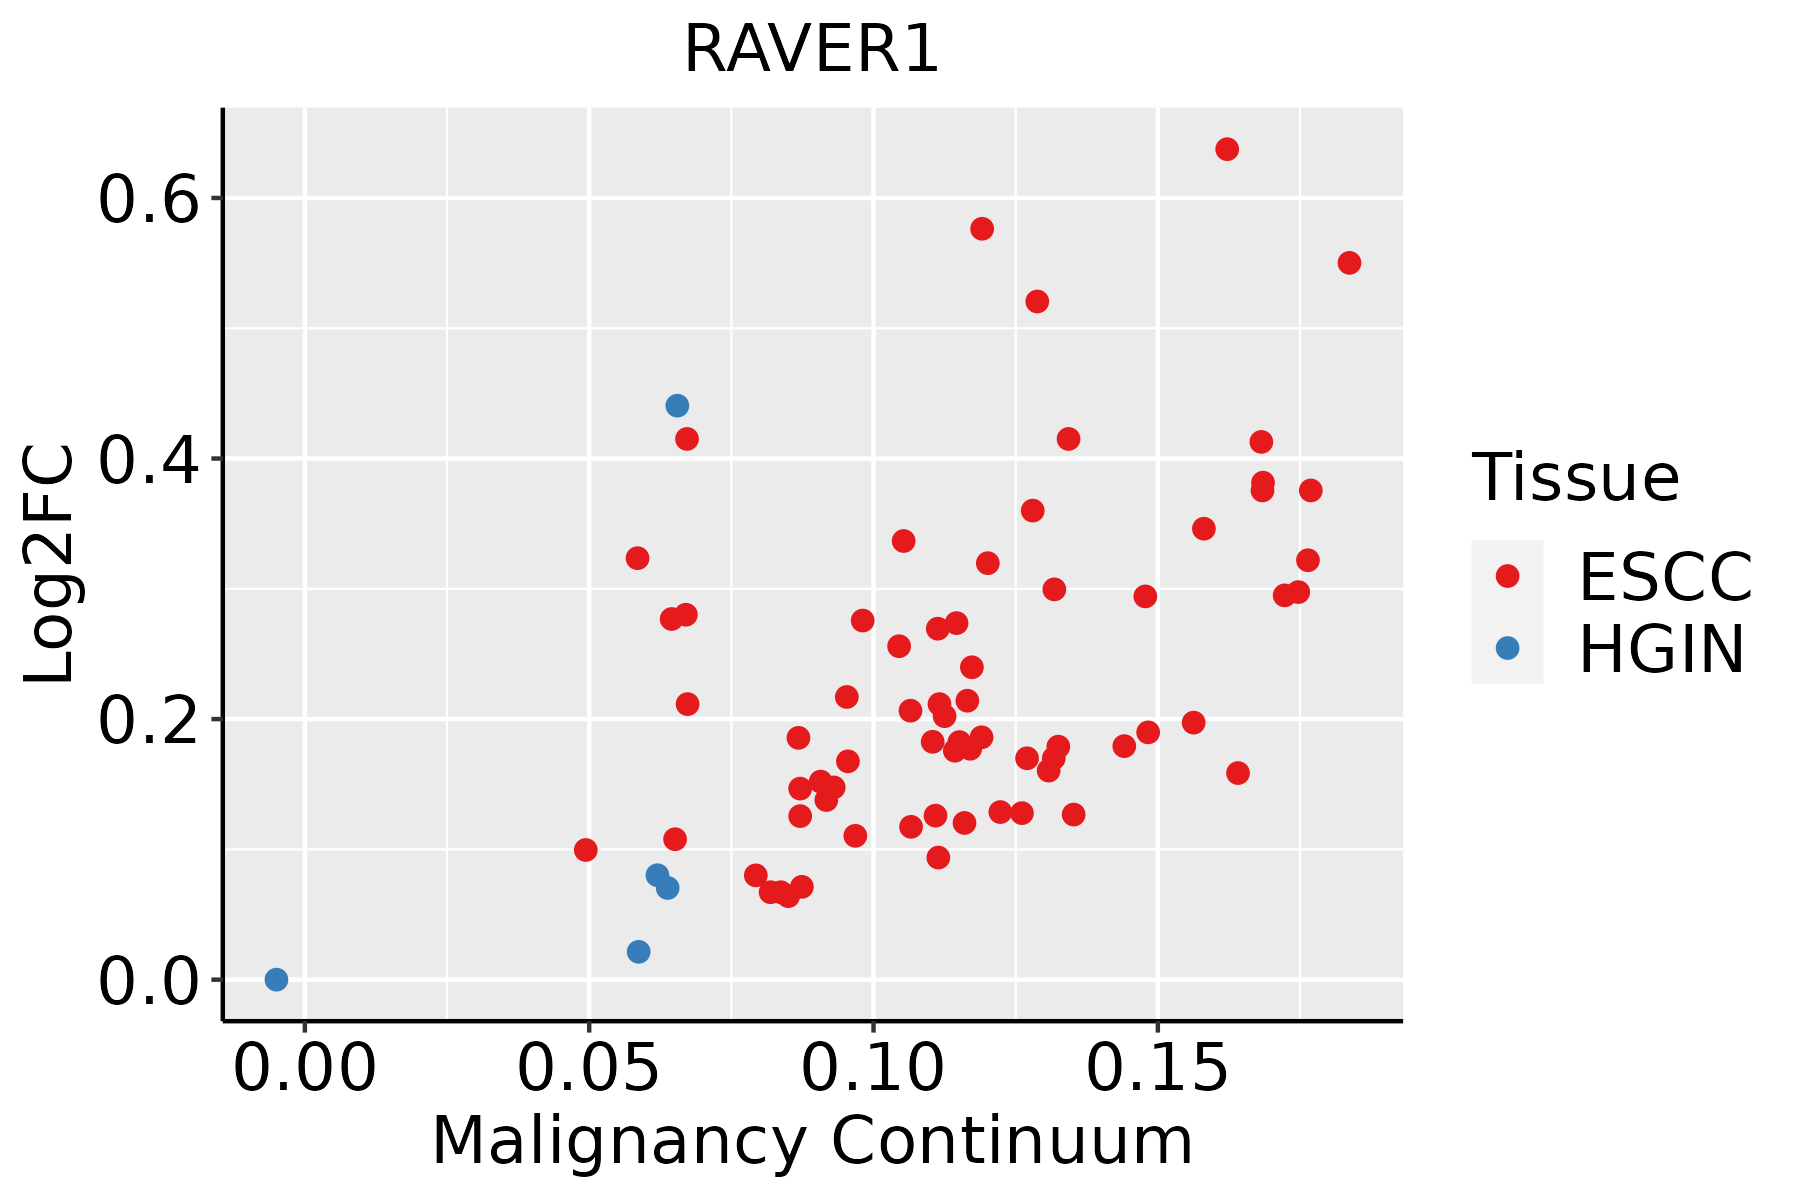 | ESCC: Esophageal squamous cell carcinoma |
| HGIN: High-grade intraepithelial neoplasias | ||
| LGIN: Low-grade intraepithelial neoplasias |
| ∗log2FC in expression of this searched gene in stem-like cells from each diseased tissue sample relative to stem-like cells in normal samples in each tissue plotted against the malignancy continuum. Samples are colored based on if they are from different disease stage. |
Top |
Malignant transformation related pathway analysis |
| Find out the enriched GO biological processes and KEGG pathways involved in transition from healthy to precancer to cancer |
| Tissue | Disease Stage | Enriched GO biological Processes |
| Colorectum | AD |  |
| Colorectum | SER |  |
| Colorectum | MSS |  |
| Colorectum | MSI-H |  |
| Colorectum | FAP |  |
| ∗Top 15 enriched GO BP terms are showed in the bar plot of each disease state in each tissue. Each row represents a significant GO biological process which is colored according to the -log10(p.adjust). |
| Page: 1 2 3 4 5 6 7 8 9 |
| GO ID | Tissue | Disease Stage | Description | Gene Ratio | Bg Ratio | pvalue | p.adjust | Count |
| GO:000838026 | Esophagus | HGIN | RNA splicing | 160/2587 | 434/18723 | 3.74e-34 | 1.12e-30 | 160 |
| GO:000037520 | Esophagus | HGIN | RNA splicing, via transesterification reactions | 115/2587 | 324/18723 | 3.16e-23 | 3.80e-20 | 115 |
| GO:000037720 | Esophagus | HGIN | RNA splicing, via transesterification reactions with bulged adenosine as nucleophile | 113/2587 | 320/18723 | 1.24e-22 | 9.26e-20 | 113 |
| GO:000039820 | Esophagus | HGIN | mRNA splicing, via spliceosome | 113/2587 | 320/18723 | 1.24e-22 | 9.26e-20 | 113 |
| GO:004348427 | Esophagus | HGIN | regulation of RNA splicing | 59/2587 | 148/18723 | 3.61e-15 | 7.22e-13 | 59 |
| GO:190331120 | Esophagus | HGIN | regulation of mRNA metabolic process | 91/2587 | 288/18723 | 5.06e-15 | 9.78e-13 | 91 |
| GO:005068419 | Esophagus | HGIN | regulation of mRNA processing | 55/2587 | 137/18723 | 2.17e-14 | 3.94e-12 | 55 |
| GO:004802426 | Esophagus | HGIN | regulation of mRNA splicing, via spliceosome | 42/2587 | 101/18723 | 6.35e-12 | 7.78e-10 | 42 |
| GO:000038018 | Esophagus | HGIN | alternative mRNA splicing, via spliceosome | 32/2587 | 77/18723 | 2.06e-09 | 1.54e-07 | 32 |
| GO:000038118 | Esophagus | HGIN | regulation of alternative mRNA splicing, via spliceosome | 22/2587 | 60/18723 | 7.92e-06 | 2.40e-04 | 22 |
| GO:0008380111 | Esophagus | ESCC | RNA splicing | 336/8552 | 434/18723 | 1.74e-42 | 3.67e-39 | 336 |
| GO:0000375111 | Esophagus | ESCC | RNA splicing, via transesterification reactions | 248/8552 | 324/18723 | 3.05e-30 | 1.49e-27 | 248 |
| GO:0000377111 | Esophagus | ESCC | RNA splicing, via transesterification reactions with bulged adenosine as nucleophile | 244/8552 | 320/18723 | 2.52e-29 | 1.07e-26 | 244 |
| GO:0000398111 | Esophagus | ESCC | mRNA splicing, via spliceosome | 244/8552 | 320/18723 | 2.52e-29 | 1.07e-26 | 244 |
| GO:1903311110 | Esophagus | ESCC | regulation of mRNA metabolic process | 210/8552 | 288/18723 | 3.25e-21 | 5.56e-19 | 210 |
| GO:0043484111 | Esophagus | ESCC | regulation of RNA splicing | 116/8552 | 148/18723 | 3.18e-16 | 2.38e-14 | 116 |
| GO:0050684110 | Esophagus | ESCC | regulation of mRNA processing | 109/8552 | 137/18723 | 3.51e-16 | 2.59e-14 | 109 |
| GO:0048024111 | Esophagus | ESCC | regulation of mRNA splicing, via spliceosome | 78/8552 | 101/18723 | 8.72e-11 | 2.66e-09 | 78 |
| GO:000038019 | Esophagus | ESCC | alternative mRNA splicing, via spliceosome | 55/8552 | 77/18723 | 4.07e-06 | 4.38e-05 | 55 |
| GO:000038119 | Esophagus | ESCC | regulation of alternative mRNA splicing, via spliceosome | 40/8552 | 60/18723 | 8.30e-04 | 4.28e-03 | 40 |
| Page: 1 |
| Pathway ID | Tissue | Disease Stage | Description | Gene Ratio | Bg Ratio | pvalue | p.adjust | qvalue | Count |
| Page: 1 |
Top |
Cell-cell communication analysis |
| Identification of potential cell-cell interactions between two cell types and their ligand-receptor pairs for different disease states |
| Ligand | Receptor | LRpair | Pathway | Tissue | Disease Stage |
| Page: 1 |
Top |
Single-cell gene regulatory network inference analysis |
| Find out the significant the regulons (TFs) and the target genes of each regulon across cell types for different disease states |
| TF | Cell Type | Tissue | Disease Stage | Target Gene | RSS | Regulon Activity |
| ∗The dot plots of a searched regulon are shown for all cell subpopulations in each disease state of each tissue based on the regulon specific score inferred using pySCENIC and by calculating the average expression. |
| Page: 1 |
Top |
Somatic mutation of malignant transformation related genes |
| Annotation of somatic variants for genes involved in malignant transformation |
| Hugo Symbol | Variant Class | Variant Classification | dbSNP RS | HGVSc | HGVSp | HGVSp Short | SWISSPROT | BIOTYPE | SIFT | PolyPhen | Tumor Sample Barcode | Tissue | Histology | Sex | Age | Stage | Therapy Types | Drugs | Outcome |
| RAVER1 | SNV | Missense_Mutation | rs562246379 | c.751G>A | p.Asp251Asn | p.D251N | protein_coding | deleterious(0.02) | possibly_damaging(0.668) | TCGA-C5-A7X5-01 | Cervix | cervical & endocervical cancer | Female | >=65 | I/II | Chemotherapy | carboplatin | PD | |
| RAVER1 | SNV | Missense_Mutation | novel | c.653N>A | p.Arg218His | p.R218H | protein_coding | tolerated(0.06) | probably_damaging(0.987) | TCGA-A6-2672-01 | Colorectum | colon adenocarcinoma | Female | >=65 | III/IV | Unknown | Unknown | SD | |
| RAVER1 | SNV | Missense_Mutation | novel | c.653G>A | p.Arg218His | p.R218H | protein_coding | tolerated(0.06) | probably_damaging(0.987) | TCGA-AA-3947-01 | Colorectum | colon adenocarcinoma | Female | <65 | I/II | Unknown | Unknown | SD | |
| RAVER1 | SNV | Missense_Mutation | rs752237465 | c.2095N>A | p.Gly699Arg | p.G699R | protein_coding | tolerated(0.14) | probably_damaging(0.996) | TCGA-AD-6889-01 | Colorectum | colon adenocarcinoma | Male | >=65 | I/II | Chemotherapy | xeloda | PD | |
| RAVER1 | SNV | Missense_Mutation | c.658N>A | p.Leu220Ile | p.L220I | protein_coding | deleterious(0) | probably_damaging(0.919) | TCGA-AD-6964-01 | Colorectum | colon adenocarcinoma | Male | <65 | III/IV | Chemotherapy | folfox | PD | ||
| RAVER1 | SNV | Missense_Mutation | rs754877220 | c.406N>T | p.Arg136Trp | p.R136W | protein_coding | deleterious(0) | probably_damaging(0.995) | TCGA-AD-A5EJ-01 | Colorectum | colon adenocarcinoma | Female | >=65 | I/II | Unknown | Unknown | SD | |
| RAVER1 | SNV | Missense_Mutation | rs768296431 | c.713N>A | p.Arg238His | p.R238H | protein_coding | deleterious(0.03) | benign(0.005) | TCGA-CK-6746-01 | Colorectum | colon adenocarcinoma | Female | >=65 | I/II | Unknown | Unknown | SD | |
| RAVER1 | SNV | Missense_Mutation | c.985N>A | p.Ala329Thr | p.A329T | protein_coding | deleterious(0) | benign(0.038) | TCGA-F4-6570-01 | Colorectum | colon adenocarcinoma | Female | >=65 | I/II | Unknown | Unknown | SD | ||
| RAVER1 | SNV | Missense_Mutation | c.2225N>A | p.Gly742Asp | p.G742D | protein_coding | deleterious(0) | probably_damaging(0.998) | TCGA-F4-6856-01 | Colorectum | colon adenocarcinoma | Male | <65 | I/II | Ancillary | leucovorin | CR | ||
| RAVER1 | SNV | Missense_Mutation | c.533N>A | p.Cys178Tyr | p.C178Y | protein_coding | deleterious(0) | probably_damaging(0.992) | TCGA-G4-6628-01 | Colorectum | colon adenocarcinoma | Male | >=65 | I/II | Unknown | Unknown | SD |
| Page: 1 2 3 4 5 |
Top |
Related drugs of malignant transformation related genes |
| Identification of chemicals and drugs interact with genes involved in malignant transfromation |
| (DGIdb 4.0) |
| Entrez ID | Symbol | Category | Interaction Types | Drug Claim Name | Drug Name | PMIDs |
| Page: 1 |

Copyright 2023-Present -The University of Texas Health Science Center at Houston |