
|
|||||
|
 | |
| |
| |
| |
| |
| |
|
Gene: RASSF9 |
Gene summary for RASSF9 |
| Gene information | Species | Human | Gene symbol | RASSF9 | Gene ID | 9182 |
| Gene name | Ras association domain family member 9 | |
| Gene Alias | P-CIP1 | |
| Cytomap | 12q21.31 | |
| Gene Type | protein-coding | GO ID | GO:0006605 | UniProtAcc | O75901 |
Top |
Malignant transformation analysis |
| Identification of the aberrant gene expression in precancerous and cancerous lesions by comparing the gene expression of stem-like cells in diseased tissues with normal stem cells |
| Entrez ID | Symbol | Replicates | Species | Organ | Tissue | Adj P-value | Log2FC | Malignancy |
| 9182 | RASSF9 | LZE4T | Human | Esophagus | ESCC | 1.44e-22 | 6.92e-01 | 0.0811 |
| 9182 | RASSF9 | LZE5T | Human | Esophagus | ESCC | 1.40e-06 | 3.65e-01 | 0.0514 |
| 9182 | RASSF9 | LZE7T | Human | Esophagus | ESCC | 3.90e-02 | 2.08e-01 | 0.0667 |
| 9182 | RASSF9 | LZE8T | Human | Esophagus | ESCC | 4.41e-02 | 1.09e-01 | 0.067 |
| 9182 | RASSF9 | LZE24T | Human | Esophagus | ESCC | 1.46e-02 | 1.19e-01 | 0.0596 |
| 9182 | RASSF9 | LZE21T | Human | Esophagus | ESCC | 9.73e-05 | 2.53e-01 | 0.0655 |
| 9182 | RASSF9 | P1T-E | Human | Esophagus | ESCC | 3.58e-07 | 3.07e-01 | 0.0875 |
| 9182 | RASSF9 | P2T-E | Human | Esophagus | ESCC | 3.99e-14 | 2.49e-01 | 0.1177 |
| 9182 | RASSF9 | P4T-E | Human | Esophagus | ESCC | 2.98e-27 | 7.79e-01 | 0.1323 |
| 9182 | RASSF9 | P5T-E | Human | Esophagus | ESCC | 2.13e-07 | 1.64e-01 | 0.1327 |
| 9182 | RASSF9 | P8T-E | Human | Esophagus | ESCC | 1.14e-55 | 1.02e+00 | 0.0889 |
| 9182 | RASSF9 | P9T-E | Human | Esophagus | ESCC | 4.72e-09 | 2.04e-01 | 0.1131 |
| 9182 | RASSF9 | P10T-E | Human | Esophagus | ESCC | 2.11e-37 | 6.59e-01 | 0.116 |
| 9182 | RASSF9 | P12T-E | Human | Esophagus | ESCC | 3.15e-25 | 5.37e-01 | 0.1122 |
| 9182 | RASSF9 | P15T-E | Human | Esophagus | ESCC | 8.54e-16 | 3.37e-01 | 0.1149 |
| 9182 | RASSF9 | P20T-E | Human | Esophagus | ESCC | 1.04e-10 | 2.90e-01 | 0.1124 |
| 9182 | RASSF9 | P22T-E | Human | Esophagus | ESCC | 7.28e-06 | 1.78e-01 | 0.1236 |
| 9182 | RASSF9 | P23T-E | Human | Esophagus | ESCC | 1.83e-49 | 1.21e+00 | 0.108 |
| 9182 | RASSF9 | P26T-E | Human | Esophagus | ESCC | 8.82e-68 | 1.15e+00 | 0.1276 |
| 9182 | RASSF9 | P27T-E | Human | Esophagus | ESCC | 1.38e-28 | 5.70e-01 | 0.1055 |
| Page: 1 2 3 |
| Tissue | Expression Dynamics | Abbreviation |
| Esophagus | 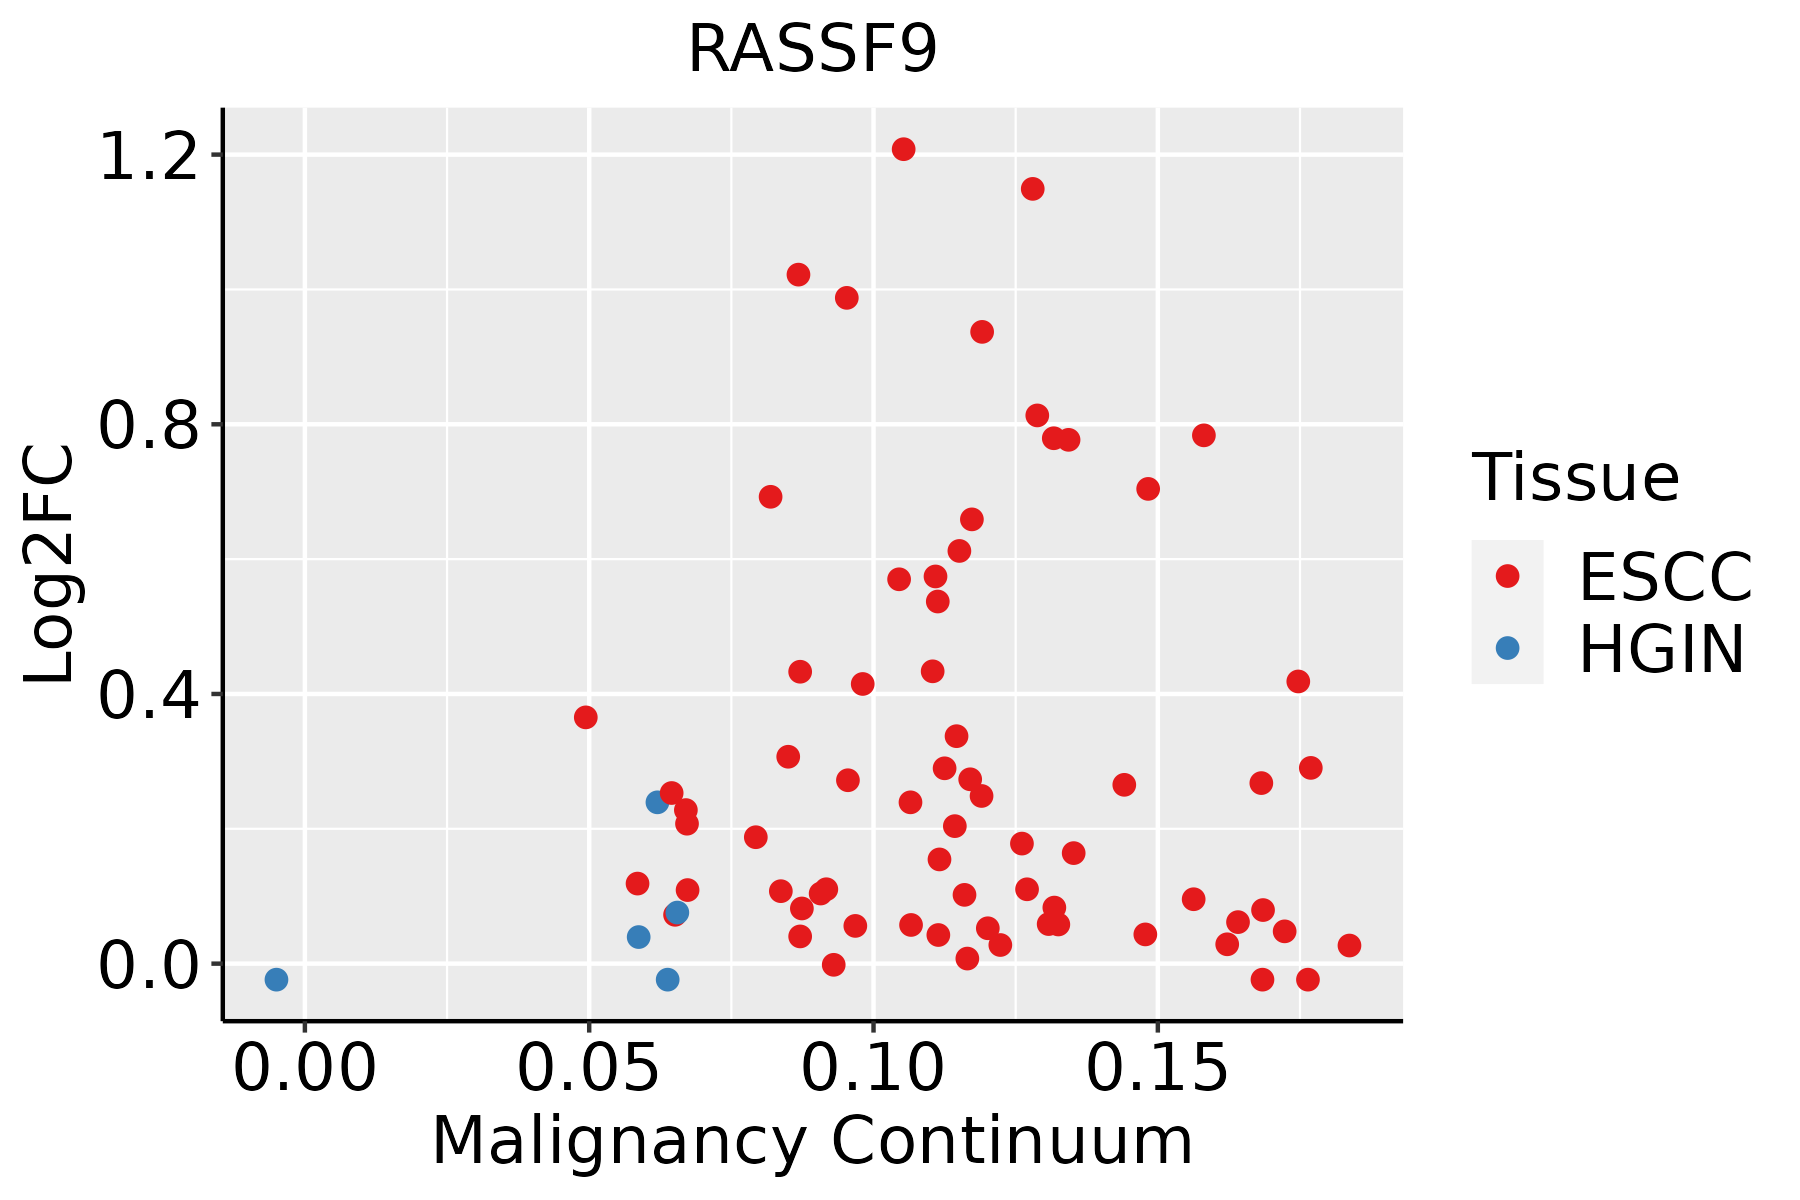 | ESCC: Esophageal squamous cell carcinoma |
| HGIN: High-grade intraepithelial neoplasias | ||
| LGIN: Low-grade intraepithelial neoplasias | ||
| Oral Cavity | 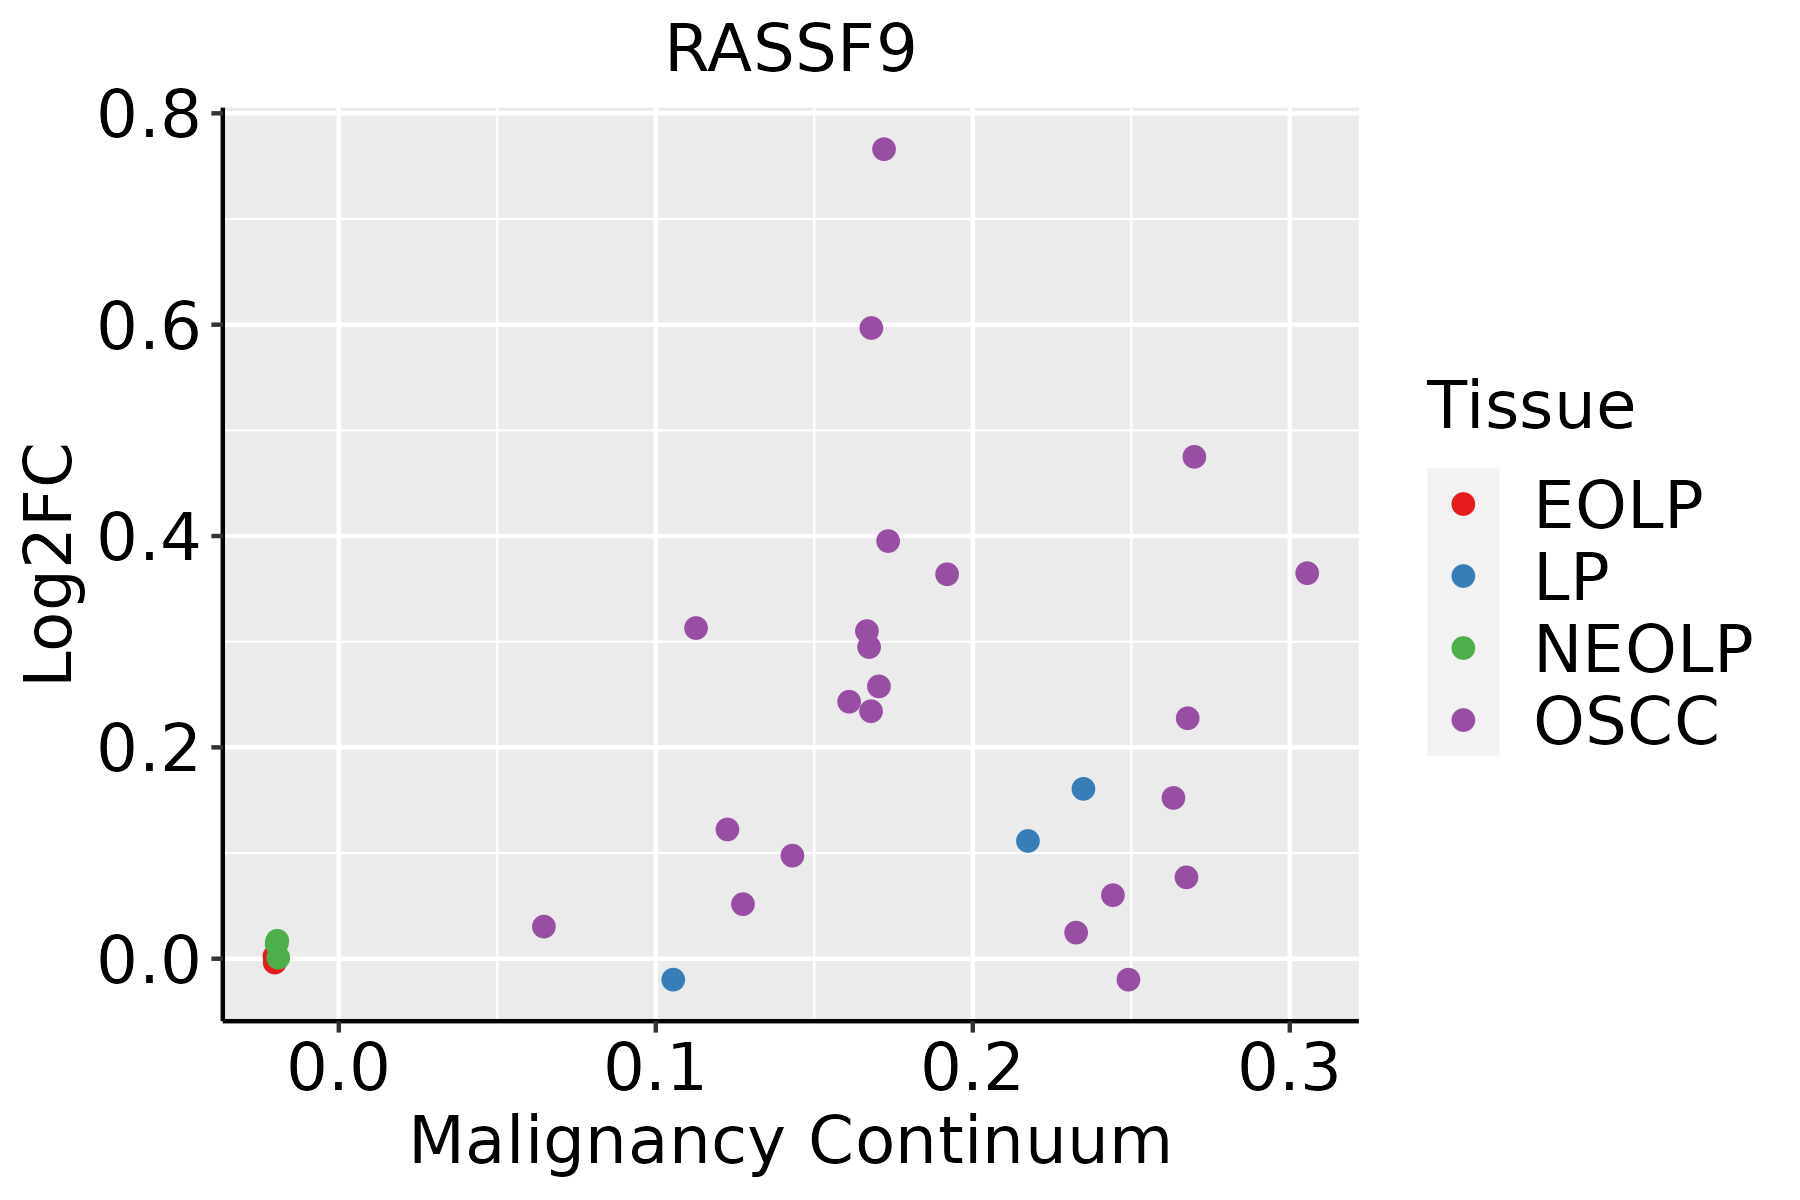 | EOLP: Erosive Oral lichen planus |
| LP: leukoplakia | ||
| NEOLP: Non-erosive oral lichen planus | ||
| OSCC: Oral squamous cell carcinoma |
| ∗log2FC in expression of this searched gene in stem-like cells from each diseased tissue sample relative to stem-like cells in normal samples in each tissue plotted against the malignancy continuum. Samples are colored based on if they are from different disease stage. |
Top |
Malignant transformation related pathway analysis |
| Find out the enriched GO biological processes and KEGG pathways involved in transition from healthy to precancer to cancer |
| Tissue | Disease Stage | Enriched GO biological Processes |
| Colorectum | AD |  |
| Colorectum | SER |  |
| Colorectum | MSS |  |
| Colorectum | MSI-H |  |
| Colorectum | FAP |  |
| ∗Top 15 enriched GO BP terms are showed in the bar plot of each disease state in each tissue. Each row represents a significant GO biological process which is colored according to the -log10(p.adjust). |
| Page: 1 2 3 4 5 6 7 8 9 |
| GO ID | Tissue | Disease Stage | Description | Gene Ratio | Bg Ratio | pvalue | p.adjust | Count |
| GO:0006605111 | Esophagus | ESCC | protein targeting | 229/8552 | 314/18723 | 4.93e-23 | 1.01e-20 | 229 |
| GO:001619715 | Esophagus | ESCC | endosomal transport | 168/8552 | 230/18723 | 2.28e-17 | 1.93e-15 | 168 |
| GO:000660520 | Oral cavity | OSCC | protein targeting | 204/7305 | 314/18723 | 6.78e-21 | 1.13e-18 | 204 |
| GO:00161979 | Oral cavity | OSCC | endosomal transport | 141/7305 | 230/18723 | 5.40e-12 | 2.06e-10 | 141 |
| Page: 1 |
| Pathway ID | Tissue | Disease Stage | Description | Gene Ratio | Bg Ratio | pvalue | p.adjust | qvalue | Count |
| Page: 1 |
Top |
Cell-cell communication analysis |
| Identification of potential cell-cell interactions between two cell types and their ligand-receptor pairs for different disease states |
| Ligand | Receptor | LRpair | Pathway | Tissue | Disease Stage |
| Page: 1 |
Top |
Single-cell gene regulatory network inference analysis |
| Find out the significant the regulons (TFs) and the target genes of each regulon across cell types for different disease states |
| TF | Cell Type | Tissue | Disease Stage | Target Gene | RSS | Regulon Activity |
| ∗The dot plots of a searched regulon are shown for all cell subpopulations in each disease state of each tissue based on the regulon specific score inferred using pySCENIC and by calculating the average expression. |
| Page: 1 |
Top |
Somatic mutation of malignant transformation related genes |
| Annotation of somatic variants for genes involved in malignant transformation |
| Hugo Symbol | Variant Class | Variant Classification | dbSNP RS | HGVSc | HGVSp | HGVSp Short | SWISSPROT | BIOTYPE | SIFT | PolyPhen | Tumor Sample Barcode | Tissue | Histology | Sex | Age | Stage | Therapy Types | Drugs | Outcome |
| RASSF9 | insertion | Frame_Shift_Ins | novel | c.154_155insATCGAGATAATATGGAGACATTAGT | p.Val52AspfsTer15 | p.V52Dfs*15 | O75901 | protein_coding | TCGA-A8-A082-01 | Breast | breast invasive carcinoma | Female | <65 | I/II | Chemotherapy | 5-fluorouracil | CR | ||
| RASSF9 | insertion | Nonsense_Mutation | novel | c.213_214insATGCTTCTTTAGAGTGTATTCATGCTTTA | p.Gly72MetfsTer4 | p.G72Mfs*4 | O75901 | protein_coding | TCGA-A8-A09D-01 | Breast | breast invasive carcinoma | Female | <65 | I/II | Chemotherapy | doxorubicin | CR | ||
| RASSF9 | SNV | Missense_Mutation | novel | c.112N>G | p.Lys38Glu | p.K38E | O75901 | protein_coding | deleterious(0) | probably_damaging(0.998) | TCGA-2W-A8YY-01 | Cervix | cervical & endocervical cancer | Female | <65 | I/II | Chemotherapy | cisplatin | CR |
| RASSF9 | SNV | Missense_Mutation | c.575N>A | p.Ser192Tyr | p.S192Y | O75901 | protein_coding | deleterious(0) | probably_damaging(0.982) | TCGA-EK-A2R8-01 | Cervix | cervical & endocervical cancer | Female | <65 | I/II | Unknown | Unknown | SD | |
| RASSF9 | SNV | Missense_Mutation | rs746945008 | c.1261N>G | p.Gln421Glu | p.Q421E | O75901 | protein_coding | deleterious(0) | probably_damaging(0.996) | TCGA-EK-A3GK-01 | Cervix | cervical & endocervical cancer | Female | <65 | I/II | Unknown | Unknown | SD |
| RASSF9 | SNV | Missense_Mutation | novel | c.227A>G | p.Asp76Gly | p.D76G | O75901 | protein_coding | tolerated(0.18) | possibly_damaging(0.517) | TCGA-VS-A8QH-01 | Cervix | cervical & endocervical cancer | Female | >=65 | I/II | Chemotherapy | gemcitabine | PD |
| RASSF9 | SNV | Missense_Mutation | c.137G>A | p.Arg46His | p.R46H | O75901 | protein_coding | tolerated(0.51) | benign(0.007) | TCGA-A6-2679-01 | Colorectum | colon adenocarcinoma | Female | >=65 | I/II | Unknown | Unknown | SD | |
| RASSF9 | SNV | Missense_Mutation | c.1052N>G | p.Gln351Arg | p.Q351R | O75901 | protein_coding | tolerated(0.34) | benign(0.086) | TCGA-AA-3977-01 | Colorectum | colon adenocarcinoma | Male | >=65 | I/II | Unknown | Unknown | SD | |
| RASSF9 | SNV | Missense_Mutation | c.887N>A | p.Ile296Asn | p.I296N | O75901 | protein_coding | tolerated(0.07) | benign(0.021) | TCGA-DM-A280-01 | Colorectum | colon adenocarcinoma | Female | >=65 | I/II | Unknown | Unknown | SD | |
| RASSF9 | SNV | Missense_Mutation | c.549N>A | p.Met183Ile | p.M183I | O75901 | protein_coding | tolerated(0.21) | benign(0.018) | TCGA-G4-6588-01 | Colorectum | colon adenocarcinoma | Female | <65 | I/II | Unknown | Unknown | SD |
| Page: 1 2 3 4 5 6 7 |
Top |
Related drugs of malignant transformation related genes |
| Identification of chemicals and drugs interact with genes involved in malignant transfromation |
| (DGIdb 4.0) |
| Entrez ID | Symbol | Category | Interaction Types | Drug Claim Name | Drug Name | PMIDs |
| Page: 1 |

Copyright 2023-Present -The University of Texas Health Science Center at Houston |