
|
|||||
|
 | |
| |
| |
| |
| |
| |
|
Gene: RASSF7 |
Gene summary for RASSF7 |
| Gene information | Species | Human | Gene symbol | RASSF7 | Gene ID | 8045 |
| Gene name | Ras association domain family member 7 | |
| Gene Alias | C11orf13 | |
| Cytomap | 11p15.5 | |
| Gene Type | protein-coding | GO ID | GO:0000226 | UniProtAcc | Q02833 |
Top |
Malignant transformation analysis |
| Identification of the aberrant gene expression in precancerous and cancerous lesions by comparing the gene expression of stem-like cells in diseased tissues with normal stem cells |
| Entrez ID | Symbol | Replicates | Species | Organ | Tissue | Adj P-value | Log2FC | Malignancy |
| 8045 | RASSF7 | LZE4T | Human | Esophagus | ESCC | 3.22e-03 | 6.76e-02 | 0.0811 |
| 8045 | RASSF7 | LZE5T | Human | Esophagus | ESCC | 7.78e-05 | 2.78e-01 | 0.0514 |
| 8045 | RASSF7 | LZE8T | Human | Esophagus | ESCC | 1.31e-10 | 2.22e-01 | 0.067 |
| 8045 | RASSF7 | LZE20T | Human | Esophagus | ESCC | 1.36e-09 | 2.86e-01 | 0.0662 |
| 8045 | RASSF7 | LZE22D1 | Human | Esophagus | HGIN | 1.32e-04 | 1.53e-01 | 0.0595 |
| 8045 | RASSF7 | LZE22T | Human | Esophagus | ESCC | 6.04e-07 | 2.78e-01 | 0.068 |
| 8045 | RASSF7 | LZE24D1 | Human | Esophagus | HGIN | 1.12e-02 | 6.81e-01 | 0.054 |
| 8045 | RASSF7 | LZE24T | Human | Esophagus | ESCC | 7.13e-24 | 7.35e-01 | 0.0596 |
| 8045 | RASSF7 | LZE21T | Human | Esophagus | ESCC | 3.35e-02 | 1.69e-01 | 0.0655 |
| 8045 | RASSF7 | LZE6T | Human | Esophagus | ESCC | 1.23e-03 | 1.35e-01 | 0.0845 |
| 8045 | RASSF7 | P1T-E | Human | Esophagus | ESCC | 1.31e-13 | 6.79e-01 | 0.0875 |
| 8045 | RASSF7 | P2T-E | Human | Esophagus | ESCC | 1.26e-12 | 2.09e-01 | 0.1177 |
| 8045 | RASSF7 | P4T-E | Human | Esophagus | ESCC | 2.97e-03 | 1.12e-01 | 0.1323 |
| 8045 | RASSF7 | P5T-E | Human | Esophagus | ESCC | 1.46e-13 | 1.47e-01 | 0.1327 |
| 8045 | RASSF7 | P8T-E | Human | Esophagus | ESCC | 2.66e-35 | 6.13e-01 | 0.0889 |
| 8045 | RASSF7 | P9T-E | Human | Esophagus | ESCC | 2.65e-18 | 3.40e-01 | 0.1131 |
| 8045 | RASSF7 | P10T-E | Human | Esophagus | ESCC | 1.02e-16 | 2.97e-01 | 0.116 |
| 8045 | RASSF7 | P11T-E | Human | Esophagus | ESCC | 1.31e-11 | 4.77e-01 | 0.1426 |
| 8045 | RASSF7 | P12T-E | Human | Esophagus | ESCC | 1.72e-15 | 3.32e-01 | 0.1122 |
| 8045 | RASSF7 | P15T-E | Human | Esophagus | ESCC | 1.90e-14 | 3.87e-01 | 0.1149 |
| Page: 1 2 3 4 5 6 |
| Tissue | Expression Dynamics | Abbreviation |
| Esophagus | 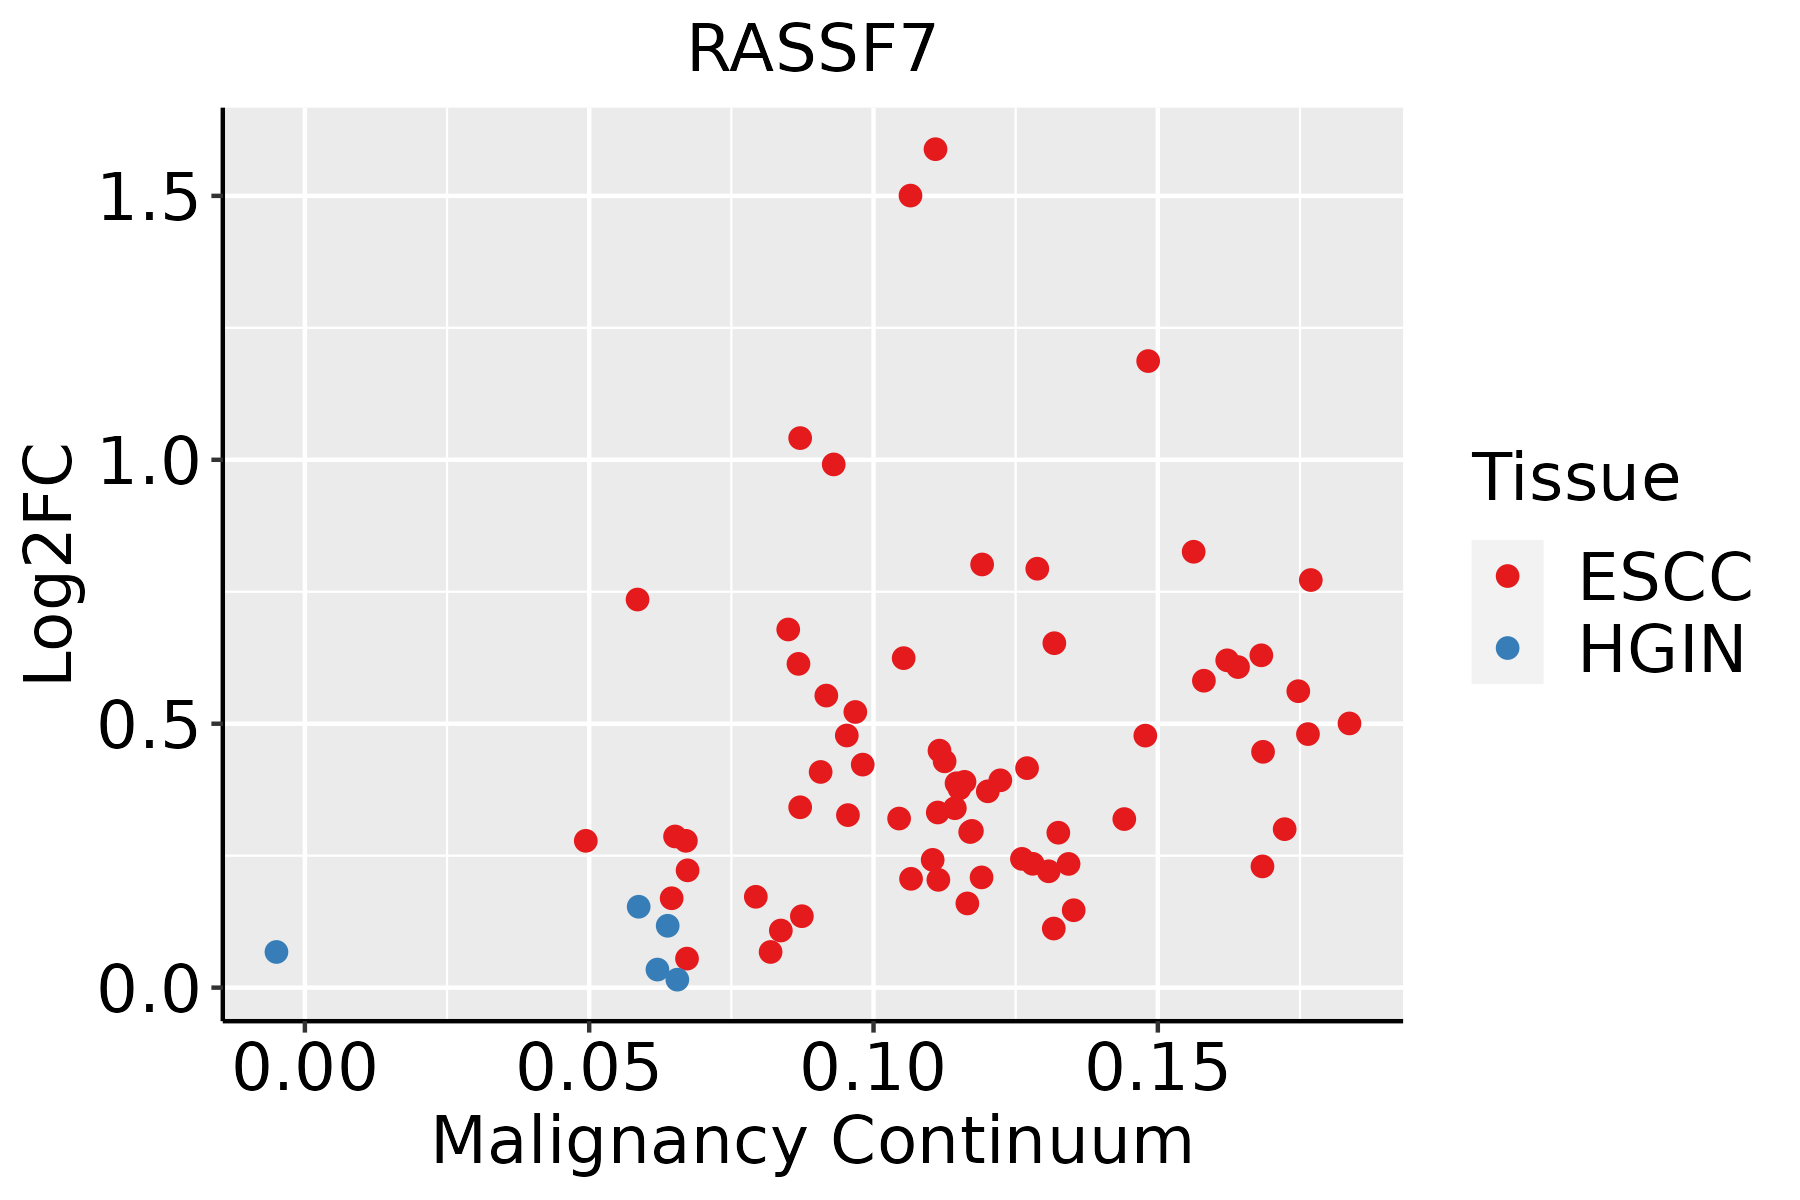 | ESCC: Esophageal squamous cell carcinoma |
| HGIN: High-grade intraepithelial neoplasias | ||
| LGIN: Low-grade intraepithelial neoplasias | ||
| Liver |  | HCC: Hepatocellular carcinoma |
| NAFLD: Non-alcoholic fatty liver disease | ||
| Oral Cavity | 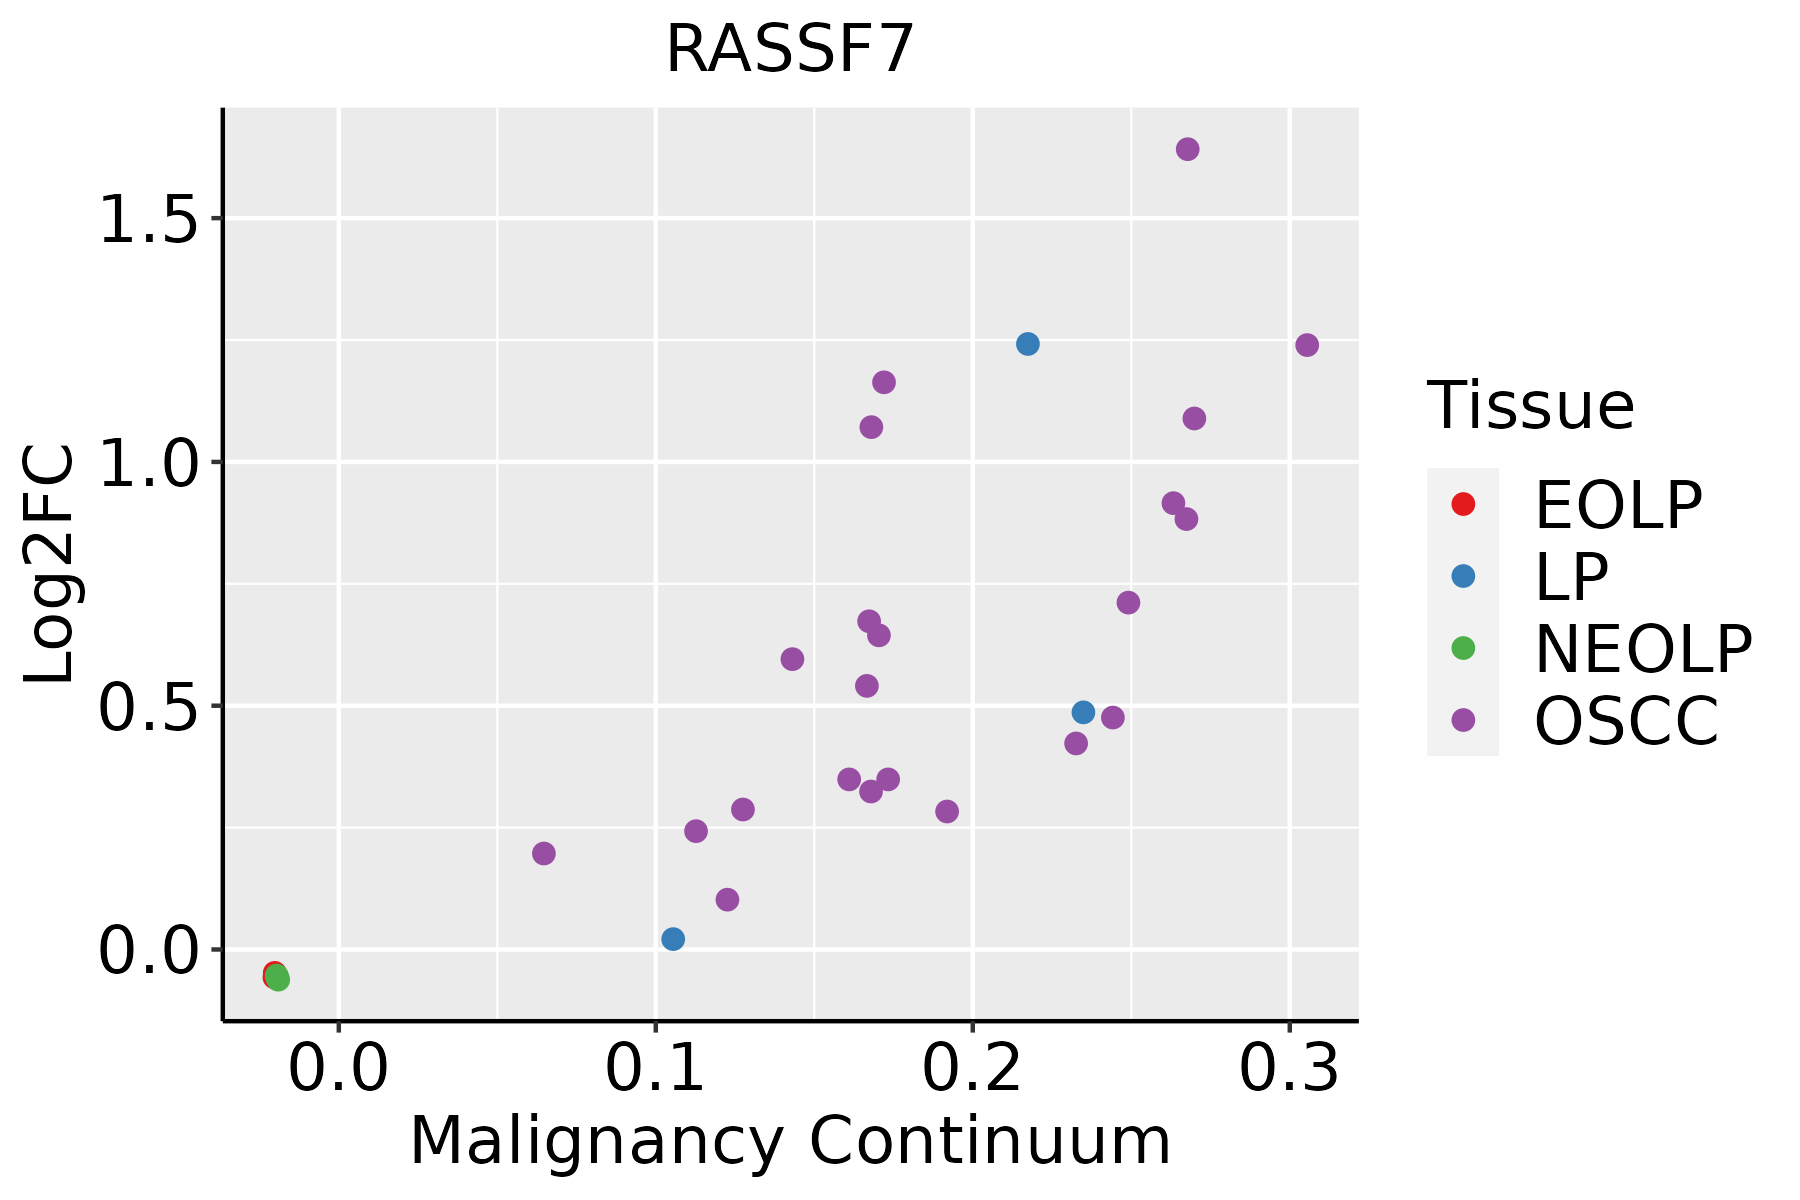 | EOLP: Erosive Oral lichen planus |
| LP: leukoplakia | ||
| NEOLP: Non-erosive oral lichen planus | ||
| OSCC: Oral squamous cell carcinoma | ||
| Skin | 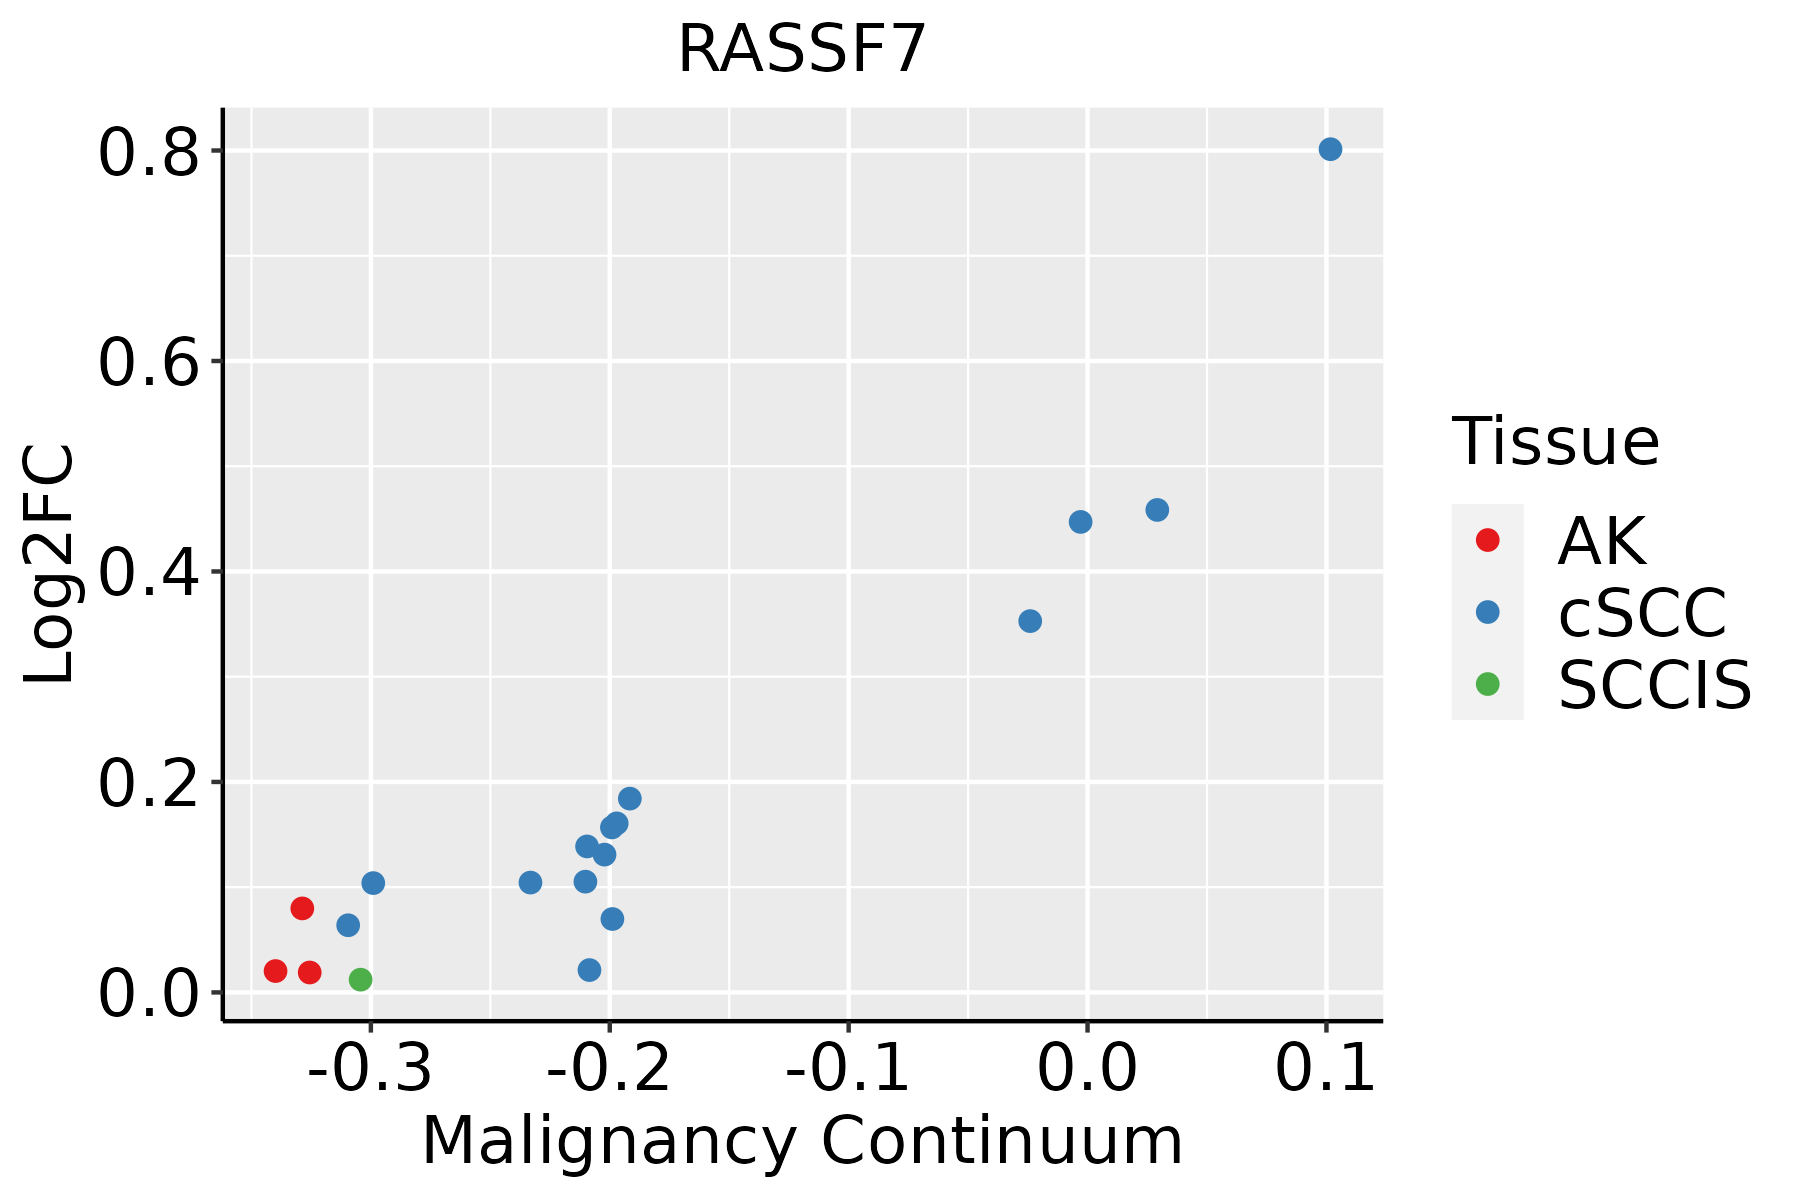 | AK: Actinic keratosis |
| cSCC: Cutaneous squamous cell carcinoma | ||
| SCCIS:squamous cell carcinoma in situ |
| ∗log2FC in expression of this searched gene in stem-like cells from each diseased tissue sample relative to stem-like cells in normal samples in each tissue plotted against the malignancy continuum. Samples are colored based on if they are from different disease stage. |
Top |
Malignant transformation related pathway analysis |
| Find out the enriched GO biological processes and KEGG pathways involved in transition from healthy to precancer to cancer |
| Tissue | Disease Stage | Enriched GO biological Processes |
| Colorectum | AD |  |
| Colorectum | SER |  |
| Colorectum | MSS |  |
| Colorectum | MSI-H |  |
| Colorectum | FAP |  |
| ∗Top 15 enriched GO BP terms are showed in the bar plot of each disease state in each tissue. Each row represents a significant GO biological process which is colored according to the -log10(p.adjust). |
| Page: 1 2 3 4 5 6 7 8 9 |
| GO ID | Tissue | Disease Stage | Description | Gene Ratio | Bg Ratio | pvalue | p.adjust | Count |
| GO:00705078 | Esophagus | ESCC | regulation of microtubule cytoskeleton organization | 99/8552 | 148/18723 | 1.43e-07 | 2.29e-06 | 99 |
| GO:00328864 | Esophagus | ESCC | regulation of microtubule-based process | 134/8552 | 240/18723 | 9.44e-04 | 4.80e-03 | 134 |
| GO:00705072 | Liver | Cirrhotic | regulation of microtubule cytoskeleton organization | 50/4634 | 148/18723 | 8.33e-03 | 3.87e-02 | 50 |
| GO:007050711 | Liver | HCC | regulation of microtubule cytoskeleton organization | 88/7958 | 148/18723 | 2.28e-05 | 2.41e-04 | 88 |
| GO:0032886 | Liver | HCC | regulation of microtubule-based process | 123/7958 | 240/18723 | 3.69e-03 | 1.64e-02 | 123 |
| GO:00705077 | Oral cavity | OSCC | regulation of microtubule cytoskeleton organization | 84/7305 | 148/18723 | 8.80e-06 | 9.33e-05 | 84 |
| GO:00328863 | Oral cavity | OSCC | regulation of microtubule-based process | 115/7305 | 240/18723 | 2.95e-03 | 1.28e-02 | 115 |
| GO:007050715 | Oral cavity | LP | regulation of microtubule cytoskeleton organization | 53/4623 | 148/18723 | 1.60e-03 | 1.23e-02 | 53 |
| GO:007050716 | Skin | cSCC | regulation of microtubule cytoskeleton organization | 61/4864 | 148/18723 | 3.61e-05 | 3.90e-04 | 61 |
| GO:003288612 | Skin | cSCC | regulation of microtubule-based process | 82/4864 | 240/18723 | 2.82e-03 | 1.58e-02 | 82 |
| Page: 1 |
| Pathway ID | Tissue | Disease Stage | Description | Gene Ratio | Bg Ratio | pvalue | p.adjust | qvalue | Count |
| Page: 1 |
Top |
Cell-cell communication analysis |
| Identification of potential cell-cell interactions between two cell types and their ligand-receptor pairs for different disease states |
| Ligand | Receptor | LRpair | Pathway | Tissue | Disease Stage |
| Page: 1 |
Top |
Single-cell gene regulatory network inference analysis |
| Find out the significant the regulons (TFs) and the target genes of each regulon across cell types for different disease states |
| TF | Cell Type | Tissue | Disease Stage | Target Gene | RSS | Regulon Activity |
| ∗The dot plots of a searched regulon are shown for all cell subpopulations in each disease state of each tissue based on the regulon specific score inferred using pySCENIC and by calculating the average expression. |
| Page: 1 |
Top |
Somatic mutation of malignant transformation related genes |
| Annotation of somatic variants for genes involved in malignant transformation |
| Hugo Symbol | Variant Class | Variant Classification | dbSNP RS | HGVSc | HGVSp | HGVSp Short | SWISSPROT | BIOTYPE | SIFT | PolyPhen | Tumor Sample Barcode | Tissue | Histology | Sex | Age | Stage | Therapy Types | Drugs | Outcome |
| RASSF7 | SNV | Missense_Mutation | c.16G>C | p.Ala6Pro | p.A6P | Q02833 | protein_coding | deleterious_low_confidence(0.03) | benign(0.404) | TCGA-A7-A13D-01 | Breast | breast invasive carcinoma | Female | <65 | I/II | Chemotherapy | cytoxan | SD | |
| RASSF7 | SNV | Missense_Mutation | novel | c.941N>G | p.Pro314Arg | p.P314R | Q02833 | protein_coding | deleterious(0.05) | benign(0.003) | TCGA-D8-A3Z6-01 | Breast | breast invasive carcinoma | Female | <65 | III/IV | Chemotherapy | cyclophosphane | SD |
| RASSF7 | SNV | Missense_Mutation | c.958C>G | p.Leu320Val | p.L320V | Q02833 | protein_coding | tolerated(0.16) | benign(0.012) | TCGA-EK-A2RB-01 | Cervix | cervical & endocervical cancer | Female | <65 | I/II | Unknown | Unknown | SD | |
| RASSF7 | SNV | Missense_Mutation | novel | c.841N>A | p.Glu281Lys | p.E281K | Q02833 | protein_coding | deleterious(0.02) | probably_damaging(0.965) | TCGA-VS-A9V5-01 | Cervix | cervical & endocervical cancer | Female | <65 | I/II | Chemotherapy | carboplatin | PD |
| RASSF7 | SNV | Missense_Mutation | novel | c.586N>G | p.Leu196Val | p.L196V | Q02833 | protein_coding | deleterious(0.04) | possibly_damaging(0.628) | TCGA-A6-3809-01 | Colorectum | colon adenocarcinoma | Female | >=65 | I/II | Unknown | Unknown | SD |
| RASSF7 | SNV | Missense_Mutation | c.490A>T | p.Arg164Trp | p.R164W | Q02833 | protein_coding | deleterious(0) | possibly_damaging(0.891) | TCGA-CK-4951-01 | Colorectum | colon adenocarcinoma | Female | >=65 | I/II | Unknown | Unknown | PD | |
| RASSF7 | SNV | Missense_Mutation | c.220N>A | p.Gly74Arg | p.G74R | Q02833 | protein_coding | deleterious(0) | probably_damaging(1) | TCGA-G4-6588-01 | Colorectum | colon adenocarcinoma | Female | <65 | I/II | Unknown | Unknown | SD | |
| RASSF7 | SNV | Missense_Mutation | novel | c.592N>A | p.Ala198Thr | p.A198T | Q02833 | protein_coding | deleterious(0.04) | benign(0.075) | TCGA-AJ-A3BG-01 | Endometrium | uterine corpus endometrioid carcinoma | Female | >=65 | I/II | Chemotherapy | carboplatin | PD |
| RASSF7 | SNV | Missense_Mutation | c.922N>T | p.Arg308Trp | p.R308W | Q02833 | protein_coding | deleterious(0) | benign(0.232) | TCGA-AP-A059-01 | Endometrium | uterine corpus endometrioid carcinoma | Female | >=65 | I/II | Unknown | Unknown | SD | |
| RASSF7 | SNV | Missense_Mutation | rs541192906 | c.172N>T | p.Arg58Trp | p.R58W | Q02833 | protein_coding | deleterious(0.02) | probably_damaging(0.998) | TCGA-AX-A2IN-01 | Endometrium | uterine corpus endometrioid carcinoma | Female | <65 | I/II | Unknown | Unknown | PD |
| Page: 1 2 3 |
Top |
Related drugs of malignant transformation related genes |
| Identification of chemicals and drugs interact with genes involved in malignant transfromation |
| (DGIdb 4.0) |
| Entrez ID | Symbol | Category | Interaction Types | Drug Claim Name | Drug Name | PMIDs |
| Page: 1 |

Copyright 2023-Present -The University of Texas Health Science Center at Houston |