
|
|||||
|
 | |
| |
| |
| |
| |
| |
|
Gene: RASSF6 |
Gene summary for RASSF6 |
| Gene information | Species | Human | Gene symbol | RASSF6 | Gene ID | 166824 |
| Gene name | Ras association domain family member 6 | |
| Gene Alias | RASSF6 | |
| Cytomap | 4q13.3 | |
| Gene Type | protein-coding | GO ID | GO:0006915 | UniProtAcc | Q6ZTQ3 |
Top |
Malignant transformation analysis |
| Identification of the aberrant gene expression in precancerous and cancerous lesions by comparing the gene expression of stem-like cells in diseased tissues with normal stem cells |
| Entrez ID | Symbol | Replicates | Species | Organ | Tissue | Adj P-value | Log2FC | Malignancy |
| 166824 | RASSF6 | LZE7T | Human | Esophagus | ESCC | 2.28e-06 | 7.04e-01 | 0.0667 |
| 166824 | RASSF6 | LZE8T | Human | Esophagus | ESCC | 5.69e-11 | 3.98e-01 | 0.067 |
| 166824 | RASSF6 | LZE21D1 | Human | Esophagus | HGIN | 3.04e-03 | 5.53e-01 | 0.0632 |
| 166824 | RASSF6 | LZE24T | Human | Esophagus | ESCC | 3.12e-02 | 6.08e-02 | 0.0596 |
| 166824 | RASSF6 | LZE21T | Human | Esophagus | ESCC | 4.52e-04 | 1.85e-01 | 0.0655 |
| 166824 | RASSF6 | P1T-E | Human | Esophagus | ESCC | 1.34e-07 | 4.02e-01 | 0.0875 |
| 166824 | RASSF6 | P2T-E | Human | Esophagus | ESCC | 8.96e-56 | 1.34e+00 | 0.1177 |
| 166824 | RASSF6 | P4T-E | Human | Esophagus | ESCC | 1.09e-05 | 1.18e-01 | 0.1323 |
| 166824 | RASSF6 | P8T-E | Human | Esophagus | ESCC | 1.47e-18 | 6.70e-01 | 0.0889 |
| 166824 | RASSF6 | P10T-E | Human | Esophagus | ESCC | 2.18e-02 | 5.71e-02 | 0.116 |
| 166824 | RASSF6 | P11T-E | Human | Esophagus | ESCC | 1.94e-16 | 9.54e-01 | 0.1426 |
| 166824 | RASSF6 | P12T-E | Human | Esophagus | ESCC | 2.37e-05 | 9.54e-02 | 0.1122 |
| 166824 | RASSF6 | P15T-E | Human | Esophagus | ESCC | 5.43e-09 | 2.12e-01 | 0.1149 |
| 166824 | RASSF6 | P16T-E | Human | Esophagus | ESCC | 1.77e-12 | 2.91e-01 | 0.1153 |
| 166824 | RASSF6 | P21T-E | Human | Esophagus | ESCC | 2.53e-20 | 5.07e-01 | 0.1617 |
| 166824 | RASSF6 | P23T-E | Human | Esophagus | ESCC | 5.65e-08 | 3.11e-01 | 0.108 |
| 166824 | RASSF6 | P26T-E | Human | Esophagus | ESCC | 2.42e-34 | 8.31e-01 | 0.1276 |
| 166824 | RASSF6 | P27T-E | Human | Esophagus | ESCC | 9.28e-10 | 8.66e-02 | 0.1055 |
| 166824 | RASSF6 | P28T-E | Human | Esophagus | ESCC | 1.06e-04 | 7.85e-02 | 0.1149 |
| 166824 | RASSF6 | P30T-E | Human | Esophagus | ESCC | 1.16e-04 | 3.46e-01 | 0.137 |
| Page: 1 2 3 4 |
| Tissue | Expression Dynamics | Abbreviation |
| Esophagus |  | ESCC: Esophageal squamous cell carcinoma |
| HGIN: High-grade intraepithelial neoplasias | ||
| LGIN: Low-grade intraepithelial neoplasias | ||
| Liver | 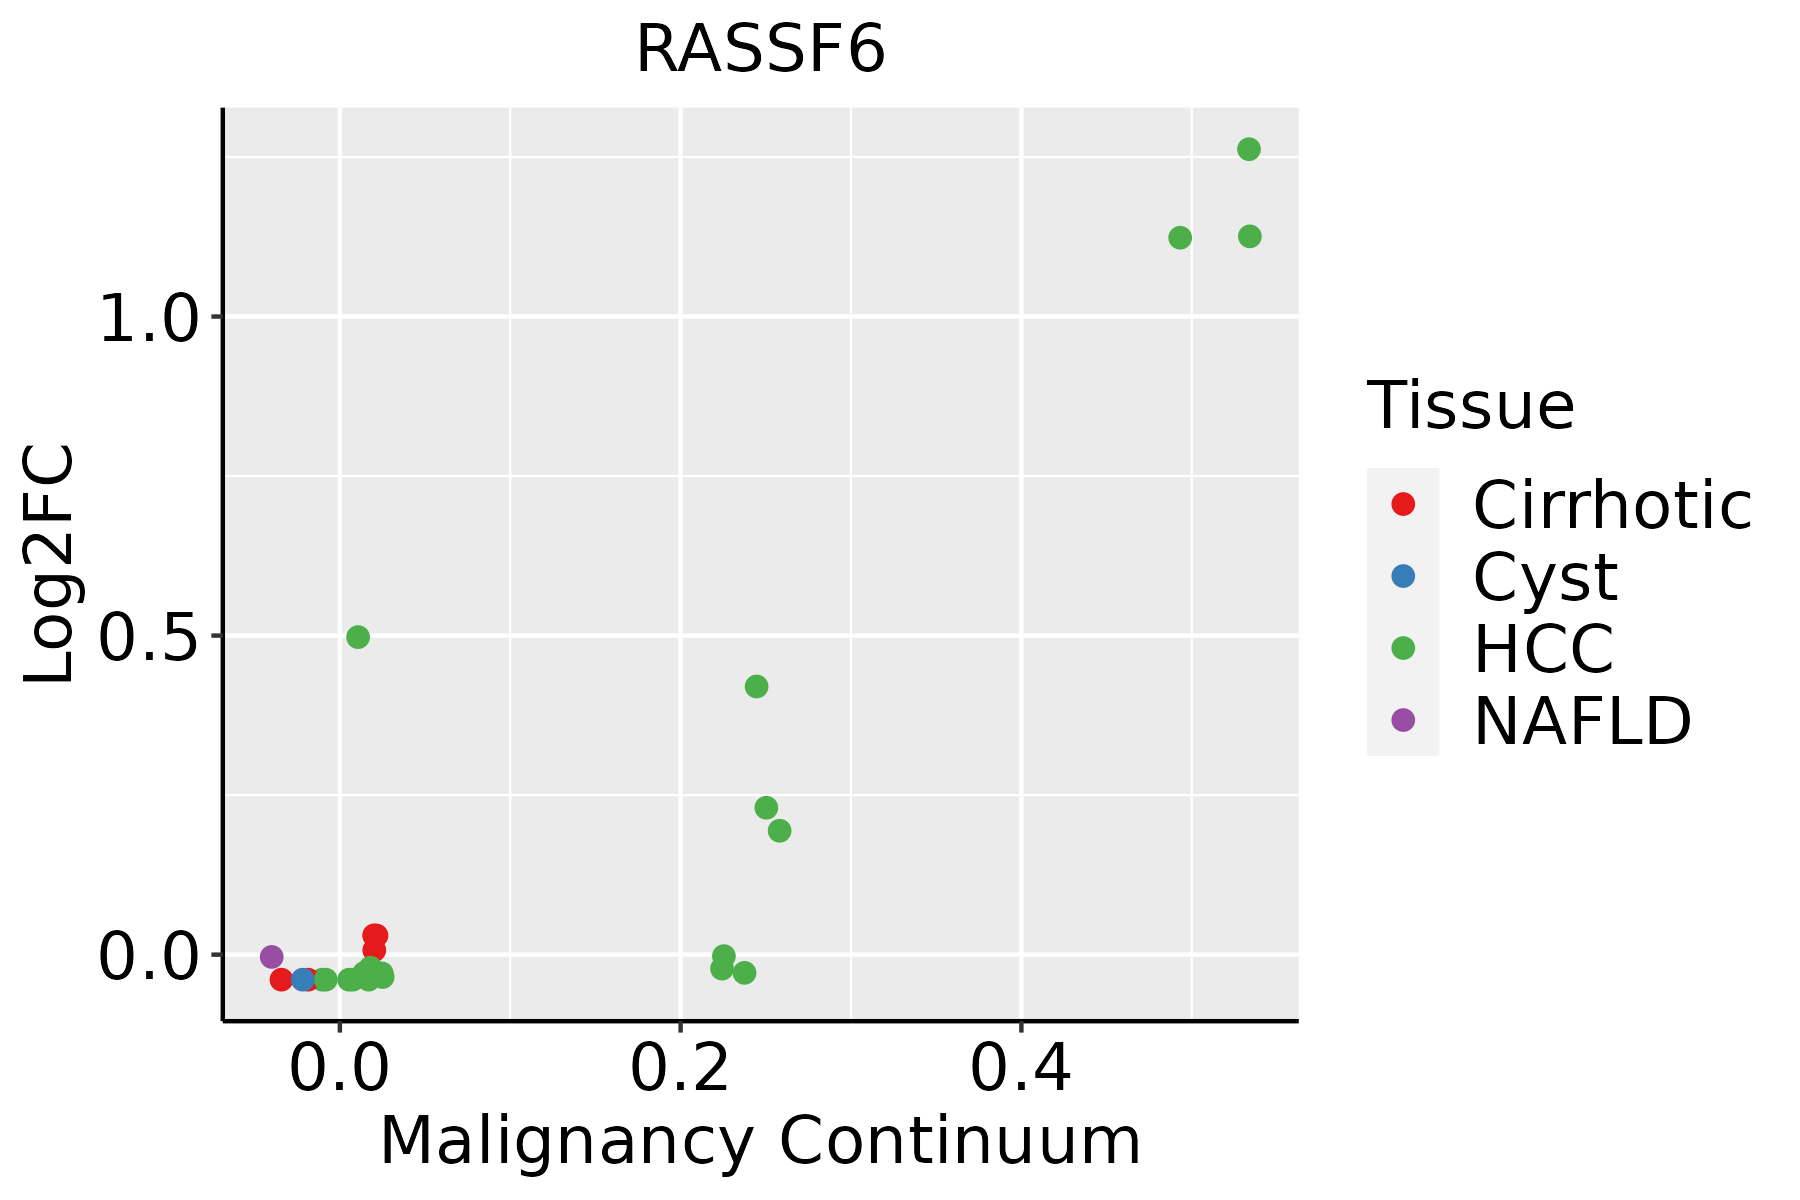 | HCC: Hepatocellular carcinoma |
| NAFLD: Non-alcoholic fatty liver disease | ||
| Prostate | 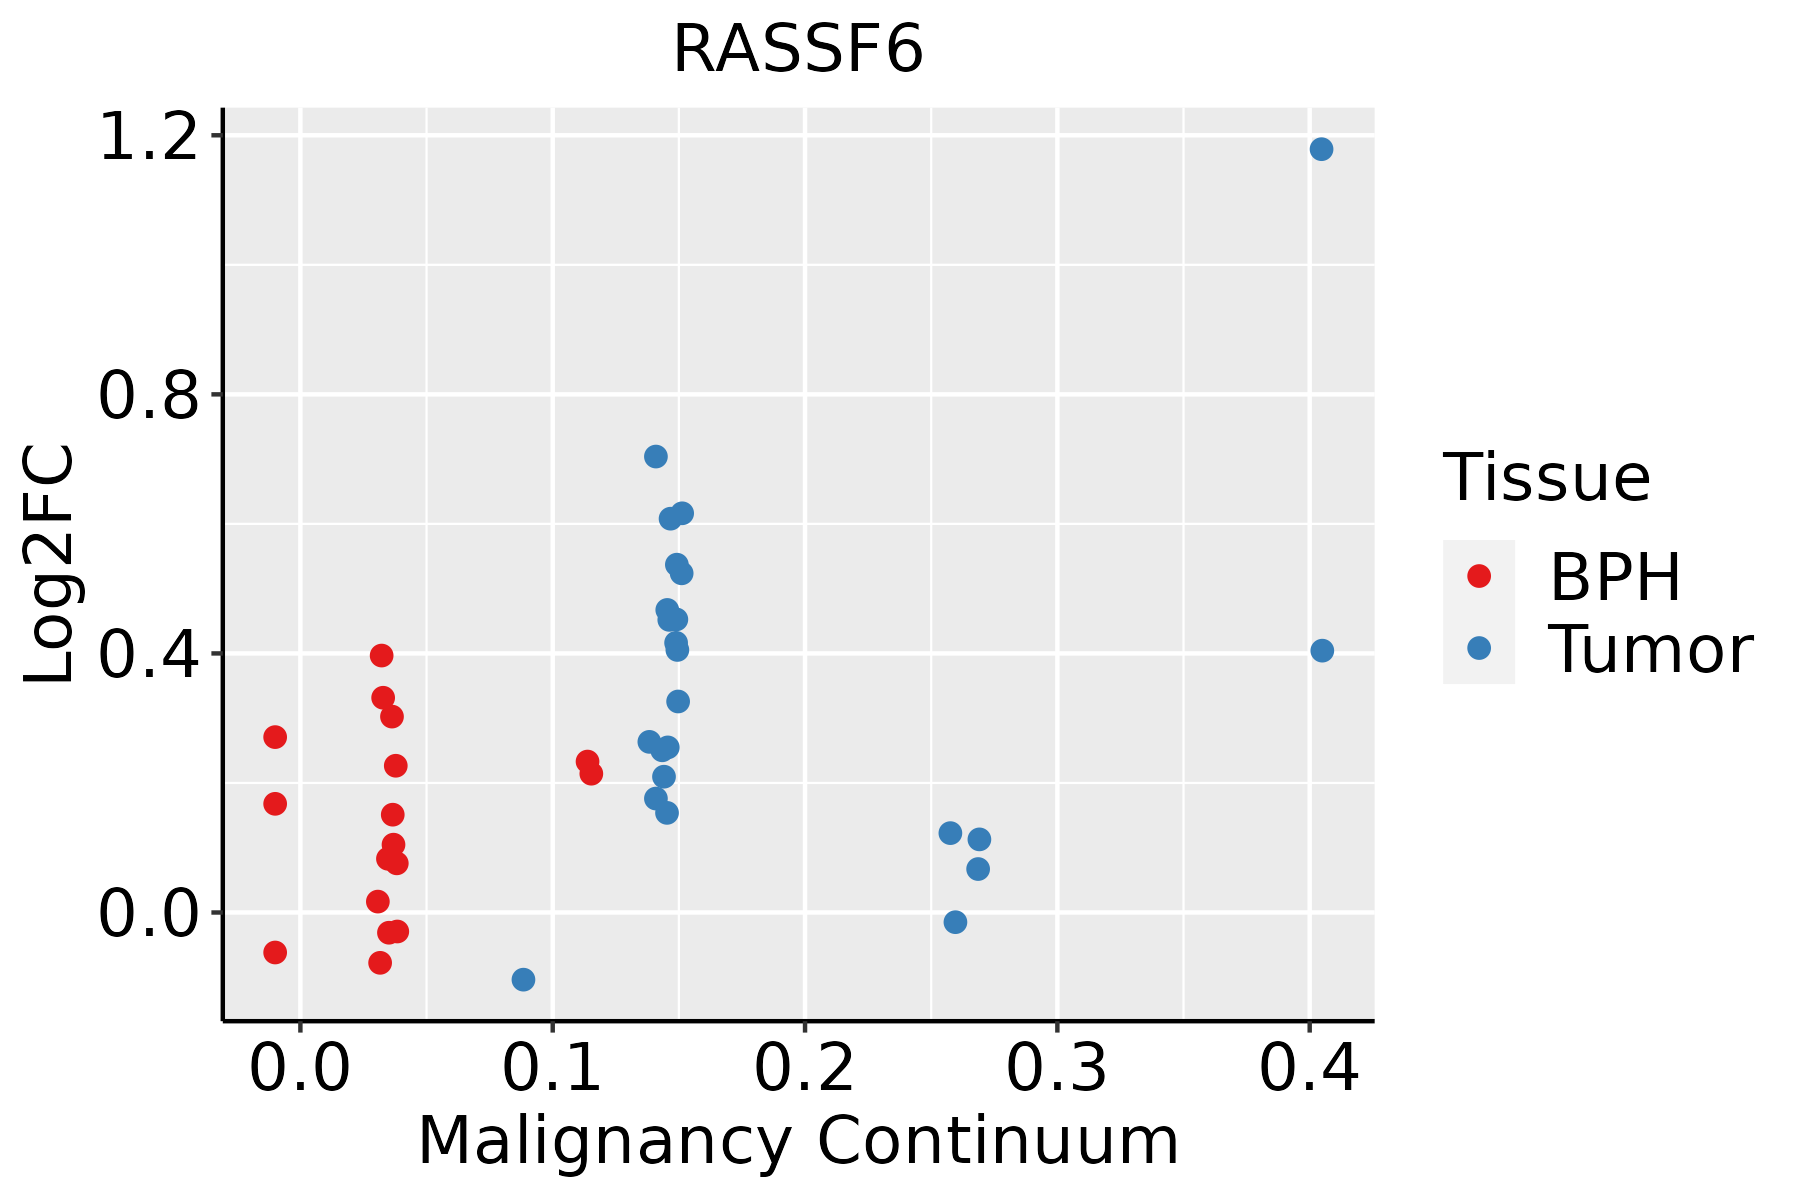 | BPH: Benign Prostatic Hyperplasia |
| ∗log2FC in expression of this searched gene in stem-like cells from each diseased tissue sample relative to stem-like cells in normal samples in each tissue plotted against the malignancy continuum. Samples are colored based on if they are from different disease stage. |
Top |
Malignant transformation related pathway analysis |
| Find out the enriched GO biological processes and KEGG pathways involved in transition from healthy to precancer to cancer |
| Tissue | Disease Stage | Enriched GO biological Processes |
| Colorectum | AD |  |
| Colorectum | SER |  |
| Colorectum | MSS |  |
| Colorectum | MSI-H |  |
| Colorectum | FAP |  |
| ∗Top 15 enriched GO BP terms are showed in the bar plot of each disease state in each tissue. Each row represents a significant GO biological process which is colored according to the -log10(p.adjust). |
| Page: 1 2 3 4 5 6 7 8 9 |
| GO ID | Tissue | Disease Stage | Description | Gene Ratio | Bg Ratio | pvalue | p.adjust | Count |
| Page: 1 |
| Pathway ID | Tissue | Disease Stage | Description | Gene Ratio | Bg Ratio | pvalue | p.adjust | qvalue | Count |
| hsa0439018 | Esophagus | ESCC | Hippo signaling pathway | 92/4205 | 157/8465 | 1.46e-02 | 3.31e-02 | 1.69e-02 | 92 |
| hsa0439019 | Esophagus | ESCC | Hippo signaling pathway | 92/4205 | 157/8465 | 1.46e-02 | 3.31e-02 | 1.69e-02 | 92 |
| hsa0439010 | Prostate | BPH | Hippo signaling pathway | 52/1718 | 157/8465 | 9.93e-05 | 6.00e-04 | 3.71e-04 | 52 |
| hsa0439015 | Prostate | BPH | Hippo signaling pathway | 52/1718 | 157/8465 | 9.93e-05 | 6.00e-04 | 3.71e-04 | 52 |
| hsa0439024 | Prostate | Tumor | Hippo signaling pathway | 54/1791 | 157/8465 | 7.52e-05 | 5.30e-04 | 3.28e-04 | 54 |
| hsa0439034 | Prostate | Tumor | Hippo signaling pathway | 54/1791 | 157/8465 | 7.52e-05 | 5.30e-04 | 3.28e-04 | 54 |
| Page: 1 |
Top |
Cell-cell communication analysis |
| Identification of potential cell-cell interactions between two cell types and their ligand-receptor pairs for different disease states |
| Ligand | Receptor | LRpair | Pathway | Tissue | Disease Stage |
| Page: 1 |
Top |
Single-cell gene regulatory network inference analysis |
| Find out the significant the regulons (TFs) and the target genes of each regulon across cell types for different disease states |
| TF | Cell Type | Tissue | Disease Stage | Target Gene | RSS | Regulon Activity |
| ∗The dot plots of a searched regulon are shown for all cell subpopulations in each disease state of each tissue based on the regulon specific score inferred using pySCENIC and by calculating the average expression. |
| Page: 1 |
Top |
Somatic mutation of malignant transformation related genes |
| Annotation of somatic variants for genes involved in malignant transformation |
| Hugo Symbol | Variant Class | Variant Classification | dbSNP RS | HGVSc | HGVSp | HGVSp Short | SWISSPROT | BIOTYPE | SIFT | PolyPhen | Tumor Sample Barcode | Tissue | Histology | Sex | Age | Stage | Therapy Types | Drugs | Outcome |
| RASSF6 | SNV | Missense_Mutation | rs145420998 | c.893G>A | p.Arg298His | p.R298H | Q6ZTQ3 | protein_coding | deleterious(0) | probably_damaging(0.987) | TCGA-2W-A8YY-01 | Cervix | cervical & endocervical cancer | Female | <65 | I/II | Chemotherapy | cisplatin | CR |
| RASSF6 | SNV | Missense_Mutation | novel | c.310C>G | p.Leu104Val | p.L104V | Q6ZTQ3 | protein_coding | deleterious(0) | probably_damaging(0.963) | TCGA-VS-A9UP-01 | Cervix | cervical & endocervical cancer | Female | <65 | I/II | Chemotherapy | cisplatin | PD |
| RASSF6 | SNV | Missense_Mutation | novel | c.286T>C | p.Trp96Arg | p.W96R | Q6ZTQ3 | protein_coding | deleterious(0) | probably_damaging(0.999) | TCGA-AA-3811-01 | Colorectum | colon adenocarcinoma | Female | >=65 | III/IV | Unknown | Unknown | PD |
| RASSF6 | SNV | Missense_Mutation | rs149223773 | c.889G>A | p.Ala297Thr | p.A297T | Q6ZTQ3 | protein_coding | deleterious(0.05) | possibly_damaging(0.628) | TCGA-AD-6889-01 | Colorectum | colon adenocarcinoma | Male | >=65 | I/II | Chemotherapy | xeloda | PD |
| RASSF6 | SNV | Missense_Mutation | c.1037N>C | p.Phe346Ser | p.F346S | Q6ZTQ3 | protein_coding | deleterious(0.01) | possibly_damaging(0.492) | TCGA-G4-6586-01 | Colorectum | colon adenocarcinoma | Female | >=65 | I/II | Unknown | Unknown | SD | |
| RASSF6 | insertion | Frame_Shift_Ins | novel | c.72_73insTTGATCTTGTT | p.Asp25LeufsTer13 | p.D25Lfs*13 | Q6ZTQ3 | protein_coding | TCGA-AM-5821-01 | Colorectum | colon adenocarcinoma | Female | >=65 | I/II | Unknown | Unknown | SD | ||
| RASSF6 | deletion | Frame_Shift_Del | c.759delN | p.Lys253AsnfsTer25 | p.K253Nfs*25 | Q6ZTQ3 | protein_coding | TCGA-WS-AB45-01 | Colorectum | colon adenocarcinoma | Female | <65 | I/II | Unknown | Unknown | SD | |||
| RASSF6 | SNV | Missense_Mutation | rs143969358 | c.409N>A | p.Asp137Asn | p.D137N | Q6ZTQ3 | protein_coding | tolerated(0.15) | possibly_damaging(0.737) | TCGA-A5-A2K5-01 | Endometrium | uterine corpus endometrioid carcinoma | Female | >=65 | I/II | Unknown | Unknown | SD |
| RASSF6 | SNV | Missense_Mutation | novel | c.299N>A | p.Arg100Gln | p.R100Q | Q6ZTQ3 | protein_coding | tolerated(0.08) | benign(0.11) | TCGA-AP-A056-01 | Endometrium | uterine corpus endometrioid carcinoma | Female | <65 | I/II | Unknown | Unknown | SD |
| RASSF6 | SNV | Missense_Mutation | novel | c.913N>T | p.Asp305Tyr | p.D305Y | Q6ZTQ3 | protein_coding | deleterious(0) | probably_damaging(0.998) | TCGA-AX-A2HC-01 | Endometrium | uterine corpus endometrioid carcinoma | Female | <65 | III/IV | Chemotherapy | paclitaxel | PD |
| Page: 1 2 3 4 |
Top |
Related drugs of malignant transformation related genes |
| Identification of chemicals and drugs interact with genes involved in malignant transfromation |
| (DGIdb 4.0) |
| Entrez ID | Symbol | Category | Interaction Types | Drug Claim Name | Drug Name | PMIDs |
| Page: 1 |

Copyright 2023-Present -The University of Texas Health Science Center at Houston |