
|
|||||
|
 | |
| |
| |
| |
| |
| |
|
Gene: RASSF5 |
Gene summary for RASSF5 |
| Gene information | Species | Human | Gene symbol | RASSF5 | Gene ID | 83593 |
| Gene name | Ras association domain family member 5 | |
| Gene Alias | Maxp1 | |
| Cytomap | 1q32.1 | |
| Gene Type | protein-coding | GO ID | GO:0006464 | UniProtAcc | A8K5F3 |
Top |
Malignant transformation analysis |
| Identification of the aberrant gene expression in precancerous and cancerous lesions by comparing the gene expression of stem-like cells in diseased tissues with normal stem cells |
| Entrez ID | Symbol | Replicates | Species | Organ | Tissue | Adj P-value | Log2FC | Malignancy |
| 83593 | RASSF5 | C21 | Human | Oral cavity | OSCC | 1.52e-06 | 4.00e-01 | 0.2678 |
| 83593 | RASSF5 | C38 | Human | Oral cavity | OSCC | 4.13e-04 | 5.43e-01 | 0.172 |
| 83593 | RASSF5 | C43 | Human | Oral cavity | OSCC | 4.69e-38 | 6.91e-01 | 0.1704 |
| 83593 | RASSF5 | C46 | Human | Oral cavity | OSCC | 4.35e-14 | 4.44e-01 | 0.1673 |
| 83593 | RASSF5 | C57 | Human | Oral cavity | OSCC | 1.41e-03 | 2.54e-01 | 0.1679 |
| 83593 | RASSF5 | C08 | Human | Oral cavity | OSCC | 3.63e-07 | 1.71e-01 | 0.1919 |
| 83593 | RASSF5 | LN46 | Human | Oral cavity | OSCC | 1.39e-18 | 8.66e-01 | 0.1666 |
| 83593 | RASSF5 | EOLP-1 | Human | Oral cavity | EOLP | 7.46e-12 | 3.95e-01 | -0.0202 |
| 83593 | RASSF5 | EOLP-2 | Human | Oral cavity | EOLP | 3.67e-11 | 4.21e-01 | -0.0203 |
| 83593 | RASSF5 | NEOLP-1 | Human | Oral cavity | NEOLP | 1.66e-14 | 4.67e-01 | -0.0194 |
| 83593 | RASSF5 | SYSMH1 | Human | Oral cavity | OSCC | 5.19e-03 | 1.81e-01 | 0.1127 |
| 83593 | RASSF5 | SYSMH2 | Human | Oral cavity | OSCC | 1.11e-03 | 8.69e-02 | 0.2326 |
| 83593 | RASSF5 | SYSMH3 | Human | Oral cavity | OSCC | 4.04e-03 | 5.09e-02 | 0.2442 |
| 83593 | RASSF5 | SYSMH6 | Human | Oral cavity | OSCC | 3.22e-05 | 1.66e-01 | 0.1275 |
| Page: 1 |
| Tissue | Expression Dynamics | Abbreviation |
| Oral Cavity | 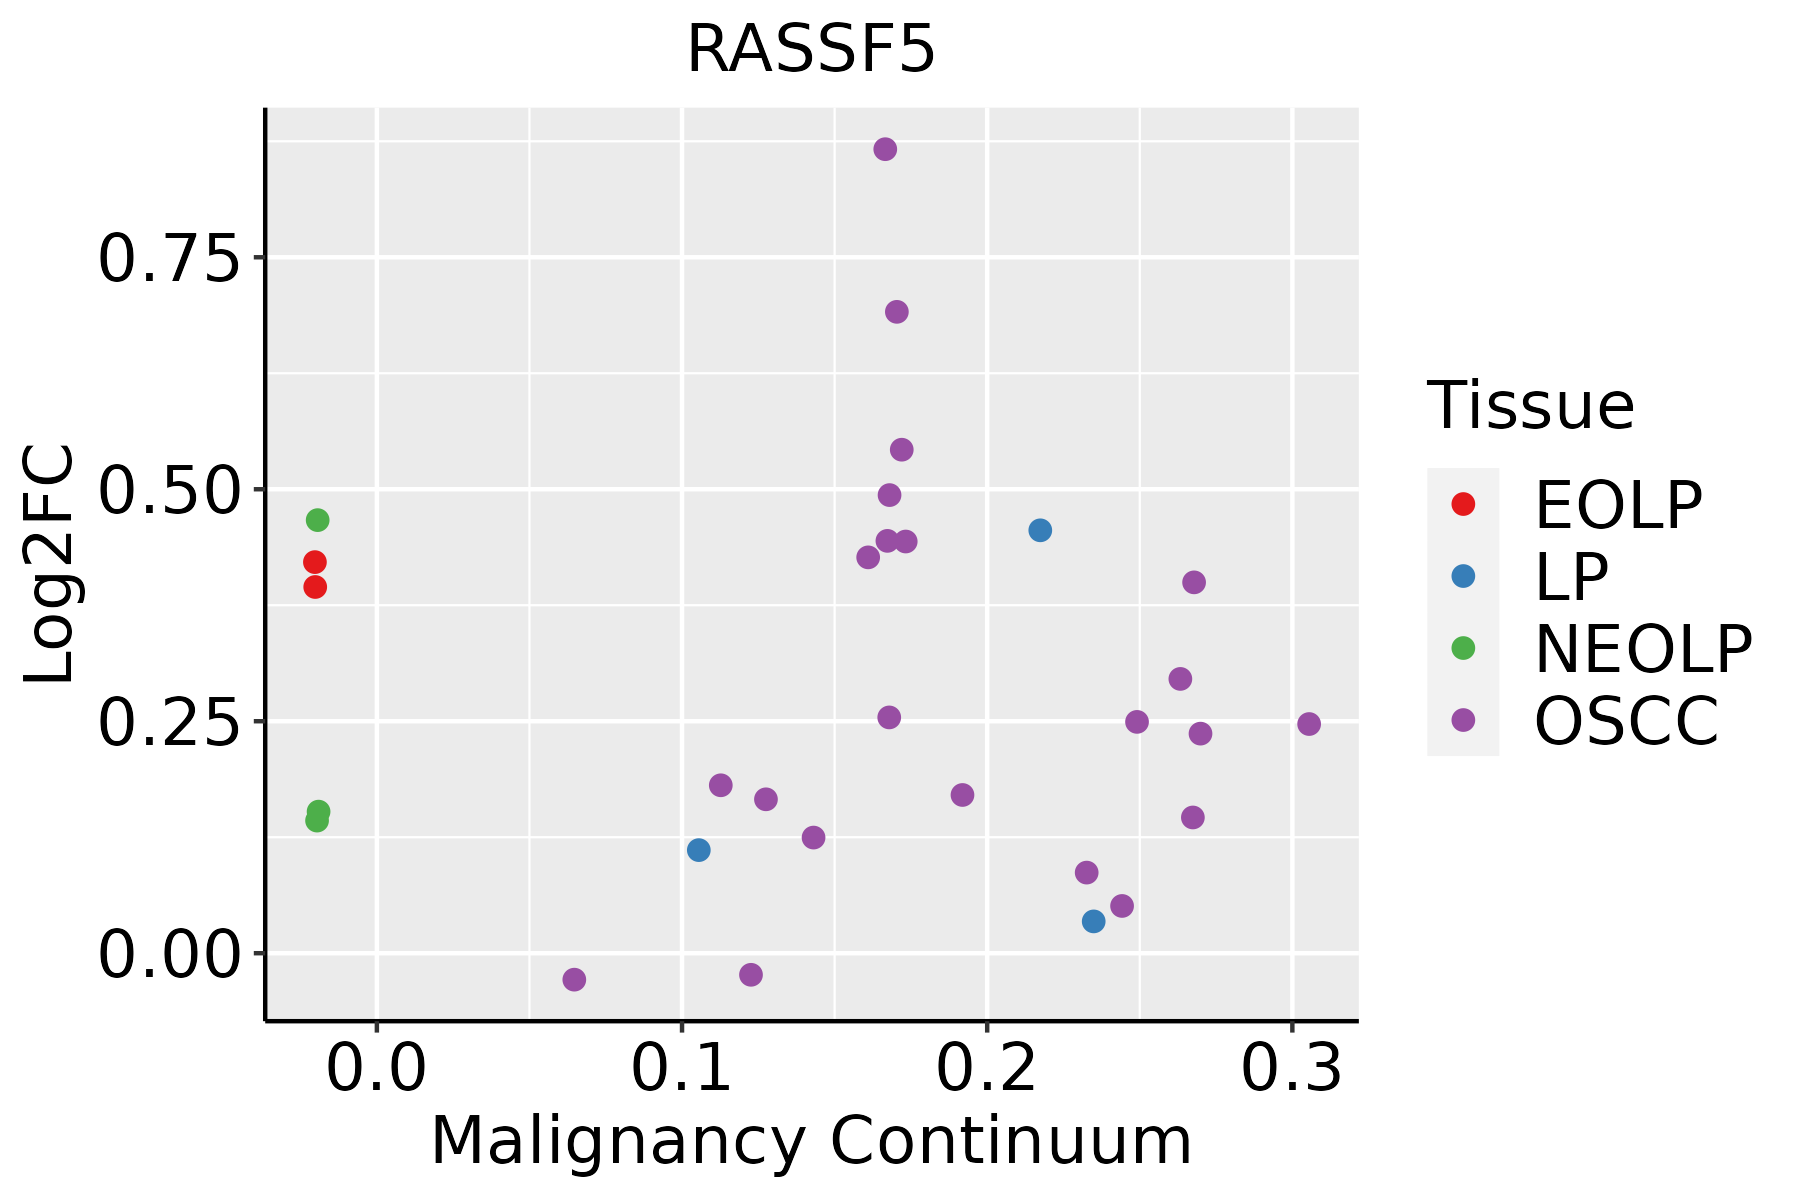 | EOLP: Erosive Oral lichen planus |
| LP: leukoplakia | ||
| NEOLP: Non-erosive oral lichen planus | ||
| OSCC: Oral squamous cell carcinoma |
| ∗log2FC in expression of this searched gene in stem-like cells from each diseased tissue sample relative to stem-like cells in normal samples in each tissue plotted against the malignancy continuum. Samples are colored based on if they are from different disease stage. |
Top |
Malignant transformation related pathway analysis |
| Find out the enriched GO biological processes and KEGG pathways involved in transition from healthy to precancer to cancer |
| Tissue | Disease Stage | Enriched GO biological Processes |
| Colorectum | AD |  |
| Colorectum | SER |  |
| Colorectum | MSS |  |
| Colorectum | MSI-H |  |
| Colorectum | FAP |  |
| ∗Top 15 enriched GO BP terms are showed in the bar plot of each disease state in each tissue. Each row represents a significant GO biological process which is colored according to the -log10(p.adjust). |
| Page: 1 2 3 4 5 6 7 8 9 |
| GO ID | Tissue | Disease Stage | Description | Gene Ratio | Bg Ratio | pvalue | p.adjust | Count |
| GO:003450415 | Oral cavity | OSCC | protein localization to nucleus | 193/7305 | 290/18723 | 1.22e-21 | 2.35e-19 | 193 |
| GO:190332020 | Oral cavity | OSCC | regulation of protein modification by small protein conjugation or removal | 165/7305 | 242/18723 | 2.52e-20 | 3.99e-18 | 165 |
| GO:003139620 | Oral cavity | OSCC | regulation of protein ubiquitination | 143/7305 | 210/18723 | 1.01e-17 | 9.80e-16 | 143 |
| GO:190018015 | Oral cavity | OSCC | regulation of protein localization to nucleus | 93/7305 | 136/18723 | 3.46e-12 | 1.35e-10 | 93 |
| GO:19033227 | Oral cavity | OSCC | positive regulation of protein modification by small protein conjugation or removal | 88/7305 | 138/18723 | 3.24e-09 | 7.39e-08 | 88 |
| GO:00313986 | Oral cavity | OSCC | positive regulation of protein ubiquitination | 75/7305 | 119/18723 | 9.46e-08 | 1.65e-06 | 75 |
| GO:190332026 | Oral cavity | EOLP | regulation of protein modification by small protein conjugation or removal | 73/2218 | 242/18723 | 1.41e-14 | 6.47e-12 | 73 |
| GO:003139626 | Oral cavity | EOLP | regulation of protein ubiquitination | 62/2218 | 210/18723 | 3.86e-12 | 7.34e-10 | 62 |
| GO:003450422 | Oral cavity | EOLP | protein localization to nucleus | 72/2218 | 290/18723 | 5.47e-10 | 4.31e-08 | 72 |
| GO:190332221 | Oral cavity | EOLP | positive regulation of protein modification by small protein conjugation or removal | 33/2218 | 138/18723 | 5.51e-05 | 7.04e-04 | 33 |
| GO:003139821 | Oral cavity | EOLP | positive regulation of protein ubiquitination | 28/2218 | 119/18723 | 2.61e-04 | 2.53e-03 | 28 |
| GO:190018021 | Oral cavity | EOLP | regulation of protein localization to nucleus | 30/2218 | 136/18723 | 5.23e-04 | 4.52e-03 | 30 |
| GO:190332033 | Oral cavity | NEOLP | regulation of protein modification by small protein conjugation or removal | 72/2005 | 242/18723 | 2.44e-16 | 1.61e-13 | 72 |
| GO:003139633 | Oral cavity | NEOLP | regulation of protein ubiquitination | 62/2005 | 210/18723 | 4.31e-14 | 1.60e-11 | 62 |
| GO:003450432 | Oral cavity | NEOLP | protein localization to nucleus | 71/2005 | 290/18723 | 1.49e-11 | 2.21e-09 | 71 |
| GO:190018031 | Oral cavity | NEOLP | regulation of protein localization to nucleus | 37/2005 | 136/18723 | 6.09e-08 | 2.39e-06 | 37 |
| GO:190332231 | Oral cavity | NEOLP | positive regulation of protein modification by small protein conjugation or removal | 31/2005 | 138/18723 | 4.77e-05 | 6.58e-04 | 31 |
| GO:003139831 | Oral cavity | NEOLP | positive regulation of protein ubiquitination | 26/2005 | 119/18723 | 3.00e-04 | 2.97e-03 | 26 |
| Page: 1 |
| Pathway ID | Tissue | Disease Stage | Description | Gene Ratio | Bg Ratio | pvalue | p.adjust | qvalue | Count |
| hsa0421820 | Oral cavity | OSCC | Cellular senescence | 112/3704 | 156/8465 | 8.04e-13 | 1.42e-11 | 7.21e-12 | 112 |
| hsa052236 | Oral cavity | OSCC | Non-small cell lung cancer | 46/3704 | 72/8465 | 4.37e-04 | 1.32e-03 | 6.72e-04 | 46 |
| hsa0467030 | Oral cavity | OSCC | Leukocyte transendothelial migration | 63/3704 | 114/8465 | 8.46e-03 | 1.96e-02 | 9.95e-03 | 63 |
| hsa0401518 | Oral cavity | OSCC | Rap1 signaling pathway | 107/3704 | 210/8465 | 2.01e-02 | 4.34e-02 | 2.21e-02 | 107 |
| hsa04218110 | Oral cavity | OSCC | Cellular senescence | 112/3704 | 156/8465 | 8.04e-13 | 1.42e-11 | 7.21e-12 | 112 |
| hsa0522315 | Oral cavity | OSCC | Non-small cell lung cancer | 46/3704 | 72/8465 | 4.37e-04 | 1.32e-03 | 6.72e-04 | 46 |
| hsa04670113 | Oral cavity | OSCC | Leukocyte transendothelial migration | 63/3704 | 114/8465 | 8.46e-03 | 1.96e-02 | 9.95e-03 | 63 |
| hsa0401519 | Oral cavity | OSCC | Rap1 signaling pathway | 107/3704 | 210/8465 | 2.01e-02 | 4.34e-02 | 2.21e-02 | 107 |
| hsa0421845 | Oral cavity | EOLP | Cellular senescence | 50/1218 | 156/8465 | 1.27e-08 | 1.83e-07 | 1.08e-07 | 50 |
| hsa04670210 | Oral cavity | EOLP | Leukocyte transendothelial migration | 37/1218 | 114/8465 | 7.00e-07 | 6.85e-06 | 4.04e-06 | 37 |
| hsa0522322 | Oral cavity | EOLP | Non-small cell lung cancer | 19/1218 | 72/8465 | 5.29e-03 | 1.63e-02 | 9.60e-03 | 19 |
| hsa0421855 | Oral cavity | EOLP | Cellular senescence | 50/1218 | 156/8465 | 1.27e-08 | 1.83e-07 | 1.08e-07 | 50 |
| hsa0467038 | Oral cavity | EOLP | Leukocyte transendothelial migration | 37/1218 | 114/8465 | 7.00e-07 | 6.85e-06 | 4.04e-06 | 37 |
| hsa0522332 | Oral cavity | EOLP | Non-small cell lung cancer | 19/1218 | 72/8465 | 5.29e-03 | 1.63e-02 | 9.60e-03 | 19 |
| hsa0421861 | Oral cavity | NEOLP | Cellular senescence | 43/1112 | 156/8465 | 1.05e-06 | 1.19e-05 | 7.49e-06 | 43 |
| hsa0467046 | Oral cavity | NEOLP | Leukocyte transendothelial migration | 31/1112 | 114/8465 | 4.39e-05 | 3.41e-04 | 2.14e-04 | 31 |
| hsa0401524 | Oral cavity | NEOLP | Rap1 signaling pathway | 40/1112 | 210/8465 | 9.07e-03 | 3.17e-02 | 1.99e-02 | 40 |
| hsa0421871 | Oral cavity | NEOLP | Cellular senescence | 43/1112 | 156/8465 | 1.05e-06 | 1.19e-05 | 7.49e-06 | 43 |
| hsa0467056 | Oral cavity | NEOLP | Leukocyte transendothelial migration | 31/1112 | 114/8465 | 4.39e-05 | 3.41e-04 | 2.14e-04 | 31 |
| hsa0401534 | Oral cavity | NEOLP | Rap1 signaling pathway | 40/1112 | 210/8465 | 9.07e-03 | 3.17e-02 | 1.99e-02 | 40 |
| Page: 1 |
Top |
Cell-cell communication analysis |
| Identification of potential cell-cell interactions between two cell types and their ligand-receptor pairs for different disease states |
| Ligand | Receptor | LRpair | Pathway | Tissue | Disease Stage |
| Page: 1 |
Top |
Single-cell gene regulatory network inference analysis |
| Find out the significant the regulons (TFs) and the target genes of each regulon across cell types for different disease states |
| TF | Cell Type | Tissue | Disease Stage | Target Gene | RSS | Regulon Activity |
| ∗The dot plots of a searched regulon are shown for all cell subpopulations in each disease state of each tissue based on the regulon specific score inferred using pySCENIC and by calculating the average expression. |
| Page: 1 |
Top |
Somatic mutation of malignant transformation related genes |
| Annotation of somatic variants for genes involved in malignant transformation |
| Hugo Symbol | Variant Class | Variant Classification | dbSNP RS | HGVSc | HGVSp | HGVSp Short | SWISSPROT | BIOTYPE | SIFT | PolyPhen | Tumor Sample Barcode | Tissue | Histology | Sex | Age | Stage | Therapy Types | Drugs | Outcome |
| RASSF5 | SNV | Missense_Mutation | c.601G>A | p.Glu201Lys | p.E201K | Q8WWW0 | protein_coding | tolerated(0.29) | benign(0.007) | TCGA-AC-A23H-01 | Breast | breast invasive carcinoma | Female | >=65 | I/II | Unknown | Unknown | PD | |
| RASSF5 | SNV | Missense_Mutation | novel | c.1069T>G | p.Phe357Val | p.F357V | Q8WWW0 | protein_coding | deleterious(0) | probably_damaging(0.997) | TCGA-AN-A046-01 | Breast | breast invasive carcinoma | Female | >=65 | I/II | Unknown | Unknown | SD |
| RASSF5 | SNV | Missense_Mutation | c.1221N>C | p.Glu407Asp | p.E407D | Q8WWW0 | protein_coding | deleterious(0) | benign(0.277) | TCGA-AO-A0J6-01 | Breast | breast invasive carcinoma | Female | <65 | I/II | Chemotherapy | doxorubicin | SD | |
| RASSF5 | SNV | Missense_Mutation | c.1191G>C | p.Lys397Asn | p.K397N | Q8WWW0 | protein_coding | tolerated(0.07) | benign(0.003) | TCGA-C8-A26Y-01 | Breast | breast invasive carcinoma | Female | >=65 | I/II | Unknown | Unknown | SD | |
| RASSF5 | SNV | Missense_Mutation | novel | c.760N>C | p.Ala254Pro | p.A254P | Q8WWW0 | protein_coding | tolerated(0.2) | benign(0.042) | TCGA-GM-A3XL-01 | Breast | breast invasive carcinoma | Female | <65 | I/II | Chemotherapy | fluorouracil | CR |
| RASSF5 | SNV | Missense_Mutation | rs781811232 | c.488G>T | p.Arg163Leu | p.R163L | Q8WWW0 | protein_coding | deleterious(0) | benign(0.038) | TCGA-C5-A8XH-01 | Cervix | cervical & endocervical cancer | Female | <65 | I/II | Unknown | Unknown | SD |
| RASSF5 | SNV | Missense_Mutation | c.523N>C | p.Gly175Arg | p.G175R | Q8WWW0 | protein_coding | tolerated(0.42) | benign(0.006) | TCGA-A6-3808-01 | Colorectum | colon adenocarcinoma | Male | >=65 | I/II | Unknown | Unknown | SD | |
| RASSF5 | SNV | Missense_Mutation | c.329N>T | p.Pro110Leu | p.P110L | Q8WWW0 | protein_coding | deleterious(0.04) | benign(0.054) | TCGA-A6-6780-01 | Colorectum | colon adenocarcinoma | Male | >=65 | I/II | Unknown | Unknown | SD | |
| RASSF5 | SNV | Missense_Mutation | c.847N>A | p.Pro283Thr | p.P283T | Q8WWW0 | protein_coding | deleterious(0) | probably_damaging(1) | TCGA-AA-3492-01 | Colorectum | colon adenocarcinoma | Female | >=65 | I/II | Unknown | Unknown | SD | |
| RASSF5 | SNV | Missense_Mutation | novel | c.1206N>G | p.Phe402Leu | p.F402L | Q8WWW0 | protein_coding | tolerated(0.12) | benign(0.416) | TCGA-AA-3841-01 | Colorectum | colon adenocarcinoma | Male | >=65 | I/II | Chemotherapy | folinic | CR |
| Page: 1 2 3 4 |
Top |
Related drugs of malignant transformation related genes |
| Identification of chemicals and drugs interact with genes involved in malignant transfromation |
| (DGIdb 4.0) |
| Entrez ID | Symbol | Category | Interaction Types | Drug Claim Name | Drug Name | PMIDs |
| Page: 1 |

Copyright 2023-Present -The University of Texas Health Science Center at Houston |