
|
|||||
|
 | |
| |
| |
| |
| |
| |
|
Gene: RASSF4 |
Gene summary for RASSF4 |
| Gene information | Species | Human | Gene symbol | RASSF4 | Gene ID | 83937 |
| Gene name | Ras association domain family member 4 | |
| Gene Alias | AD037 | |
| Cytomap | 10q11.21 | |
| Gene Type | protein-coding | GO ID | GO:0007049 | UniProtAcc | Q9H2L5 |
Top |
Malignant transformation analysis |
| Identification of the aberrant gene expression in precancerous and cancerous lesions by comparing the gene expression of stem-like cells in diseased tissues with normal stem cells |
| Entrez ID | Symbol | Replicates | Species | Organ | Tissue | Adj P-value | Log2FC | Malignancy |
| 83937 | RASSF4 | P2T-E | Human | Esophagus | ESCC | 3.85e-02 | 1.07e-01 | 0.1177 |
| 83937 | RASSF4 | P10T-E | Human | Esophagus | ESCC | 4.55e-05 | 4.48e-02 | 0.116 |
| 83937 | RASSF4 | P11T-E | Human | Esophagus | ESCC | 3.52e-03 | 6.15e-01 | 0.1426 |
| 83937 | RASSF4 | P12T-E | Human | Esophagus | ESCC | 4.33e-04 | 1.44e-01 | 0.1122 |
| 83937 | RASSF4 | P19T-E | Human | Esophagus | ESCC | 1.57e-04 | 1.01e+00 | 0.1662 |
| 83937 | RASSF4 | P24T-E | Human | Esophagus | ESCC | 3.25e-05 | 4.80e-01 | 0.1287 |
| 83937 | RASSF4 | P37T-E | Human | Esophagus | ESCC | 3.51e-02 | 6.53e-02 | 0.1371 |
| 83937 | RASSF4 | P57T-E | Human | Esophagus | ESCC | 6.98e-09 | 1.45e-01 | 0.0926 |
| 83937 | RASSF4 | P75T-E | Human | Esophagus | ESCC | 1.72e-02 | 8.19e-02 | 0.1125 |
| 83937 | RASSF4 | P76T-E | Human | Esophagus | ESCC | 2.33e-06 | 5.07e-02 | 0.1207 |
| 83937 | RASSF4 | P130T-E | Human | Esophagus | ESCC | 3.62e-15 | 3.95e-01 | 0.1676 |
| 83937 | RASSF4 | S43 | Human | Liver | Cirrhotic | 2.70e-03 | -8.29e-02 | -0.0187 |
| 83937 | RASSF4 | HCC1_Meng | Human | Liver | HCC | 5.51e-21 | -1.57e-01 | 0.0246 |
| 83937 | RASSF4 | HCC2_Meng | Human | Liver | HCC | 3.95e-04 | -2.25e-01 | 0.0107 |
| 83937 | RASSF4 | cirrhotic2 | Human | Liver | Cirrhotic | 1.98e-11 | 1.96e-01 | 0.0201 |
| 83937 | RASSF4 | cirrhotic3 | Human | Liver | Cirrhotic | 6.03e-03 | 4.72e-02 | 0.0215 |
| 83937 | RASSF4 | HCC2 | Human | Liver | HCC | 3.99e-09 | 4.07e+00 | 0.5341 |
| 83937 | RASSF4 | Pt13.b | Human | Liver | HCC | 2.14e-19 | 2.83e-01 | 0.0251 |
| 83937 | RASSF4 | Pt14.a | Human | Liver | HCC | 4.80e-03 | 3.05e-01 | 0.0169 |
| 83937 | RASSF4 | S014 | Human | Liver | HCC | 1.03e-02 | 4.37e-01 | 0.2254 |
| Page: 1 2 |
| Tissue | Expression Dynamics | Abbreviation |
| Esophagus | 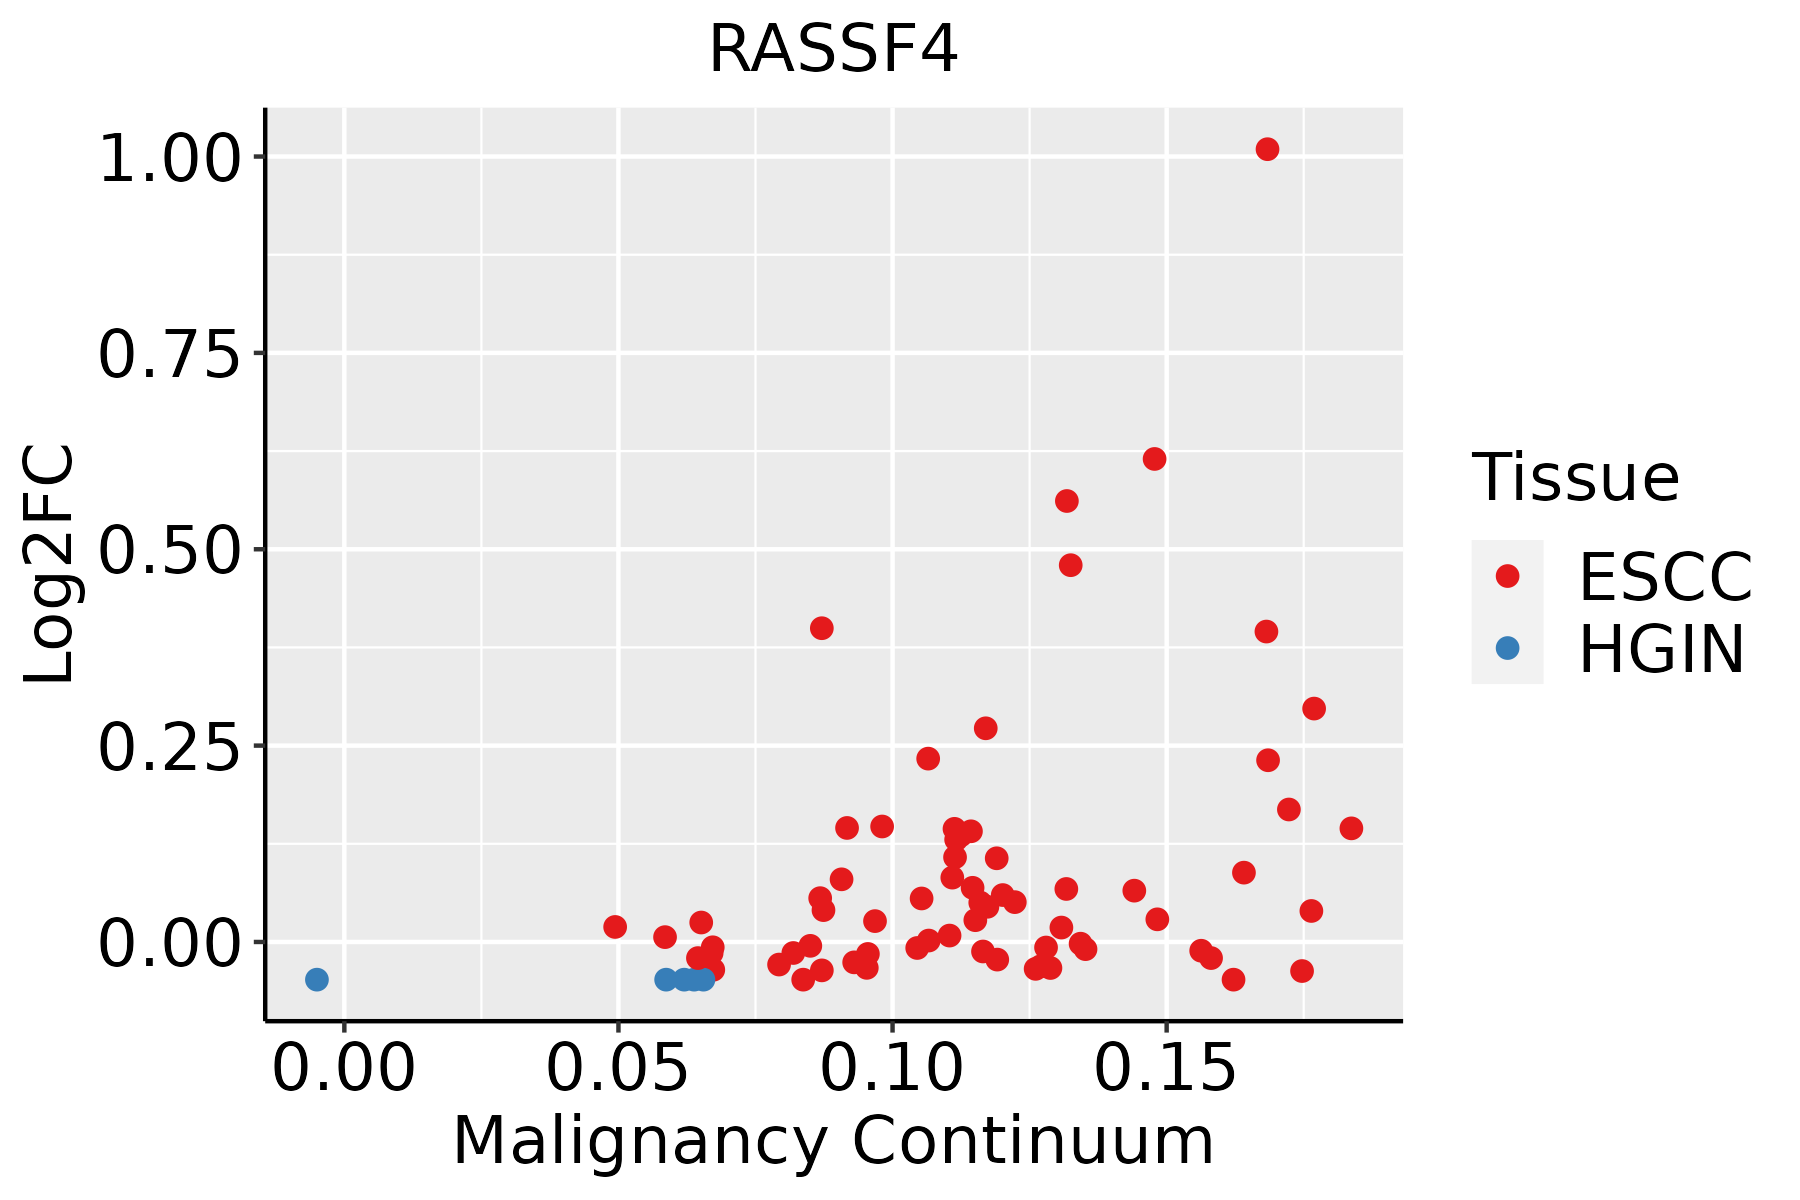 | ESCC: Esophageal squamous cell carcinoma |
| HGIN: High-grade intraepithelial neoplasias | ||
| LGIN: Low-grade intraepithelial neoplasias | ||
| Liver | 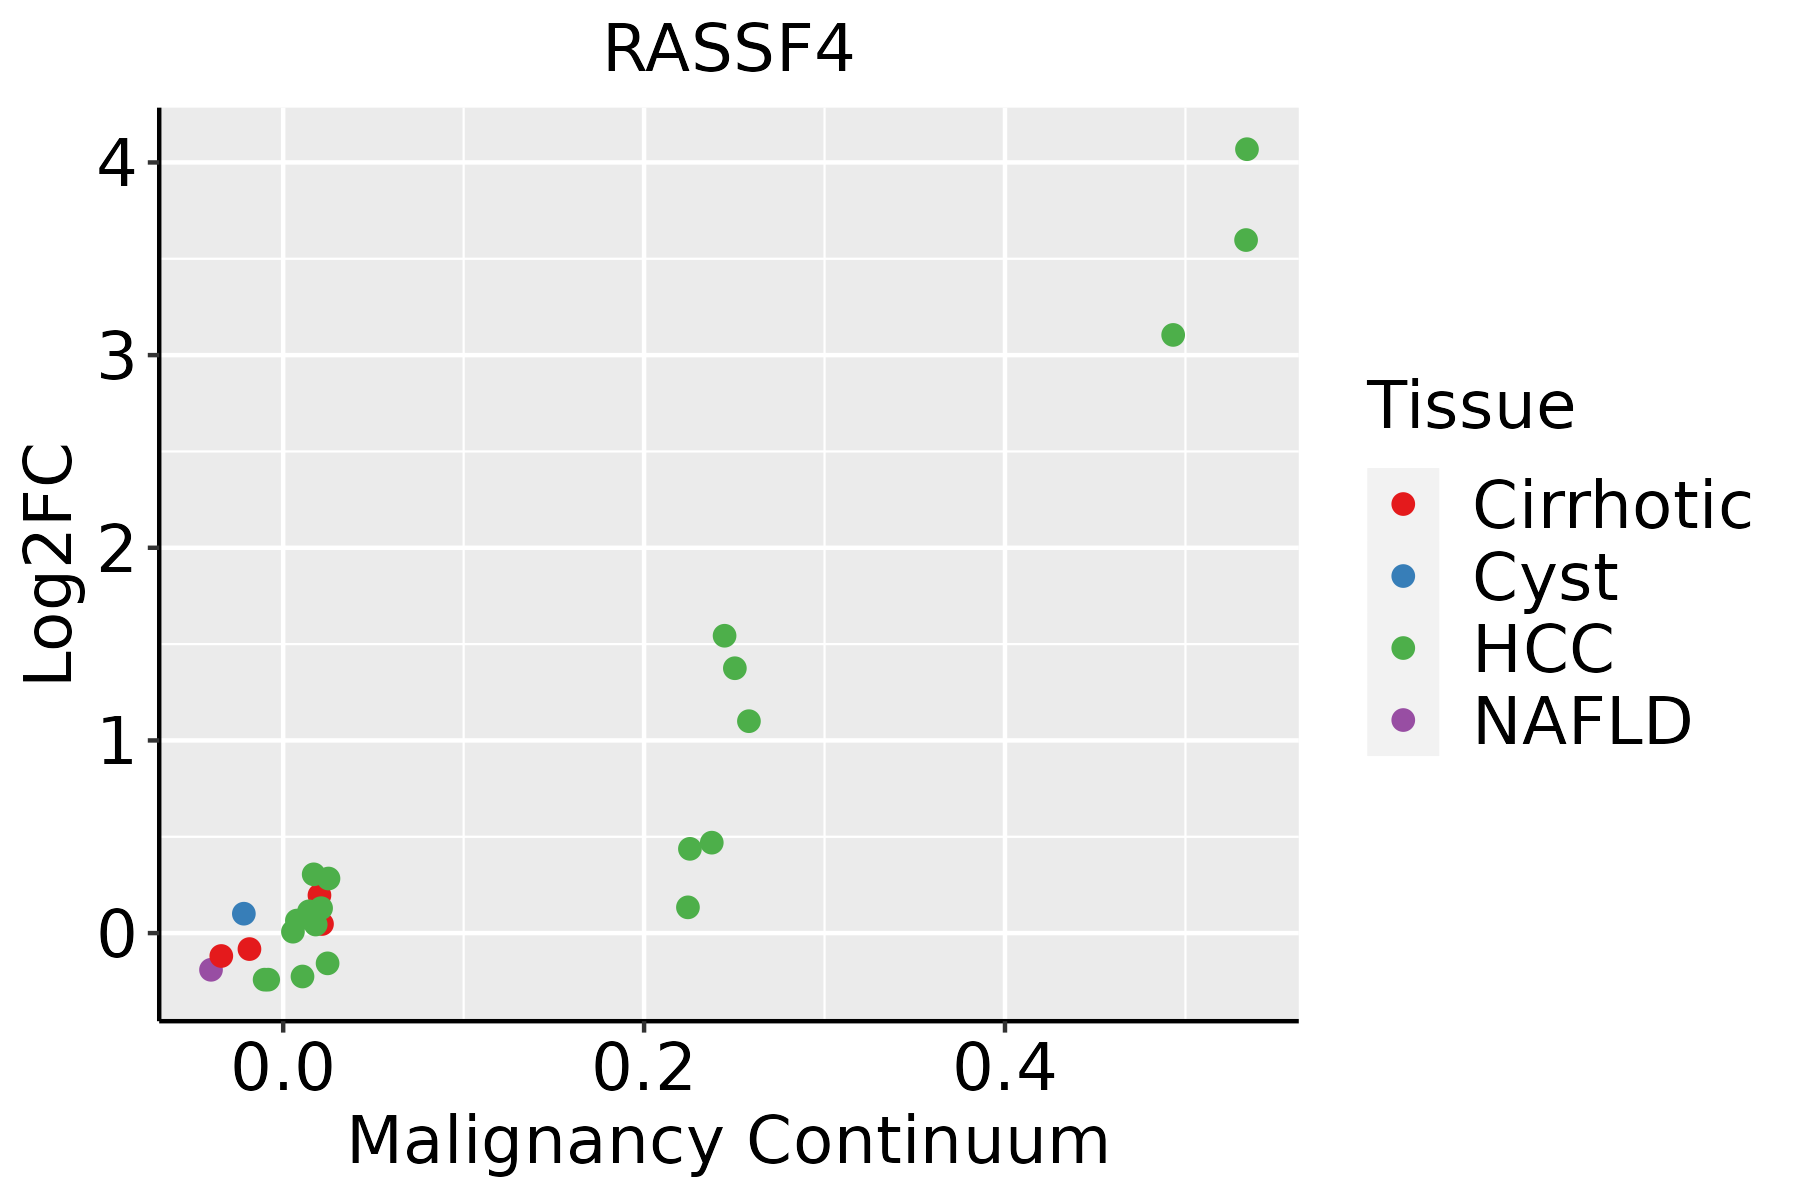 | HCC: Hepatocellular carcinoma |
| NAFLD: Non-alcoholic fatty liver disease | ||
| Oral Cavity |  | EOLP: Erosive Oral lichen planus |
| LP: leukoplakia | ||
| NEOLP: Non-erosive oral lichen planus | ||
| OSCC: Oral squamous cell carcinoma | ||
| Thyroid | 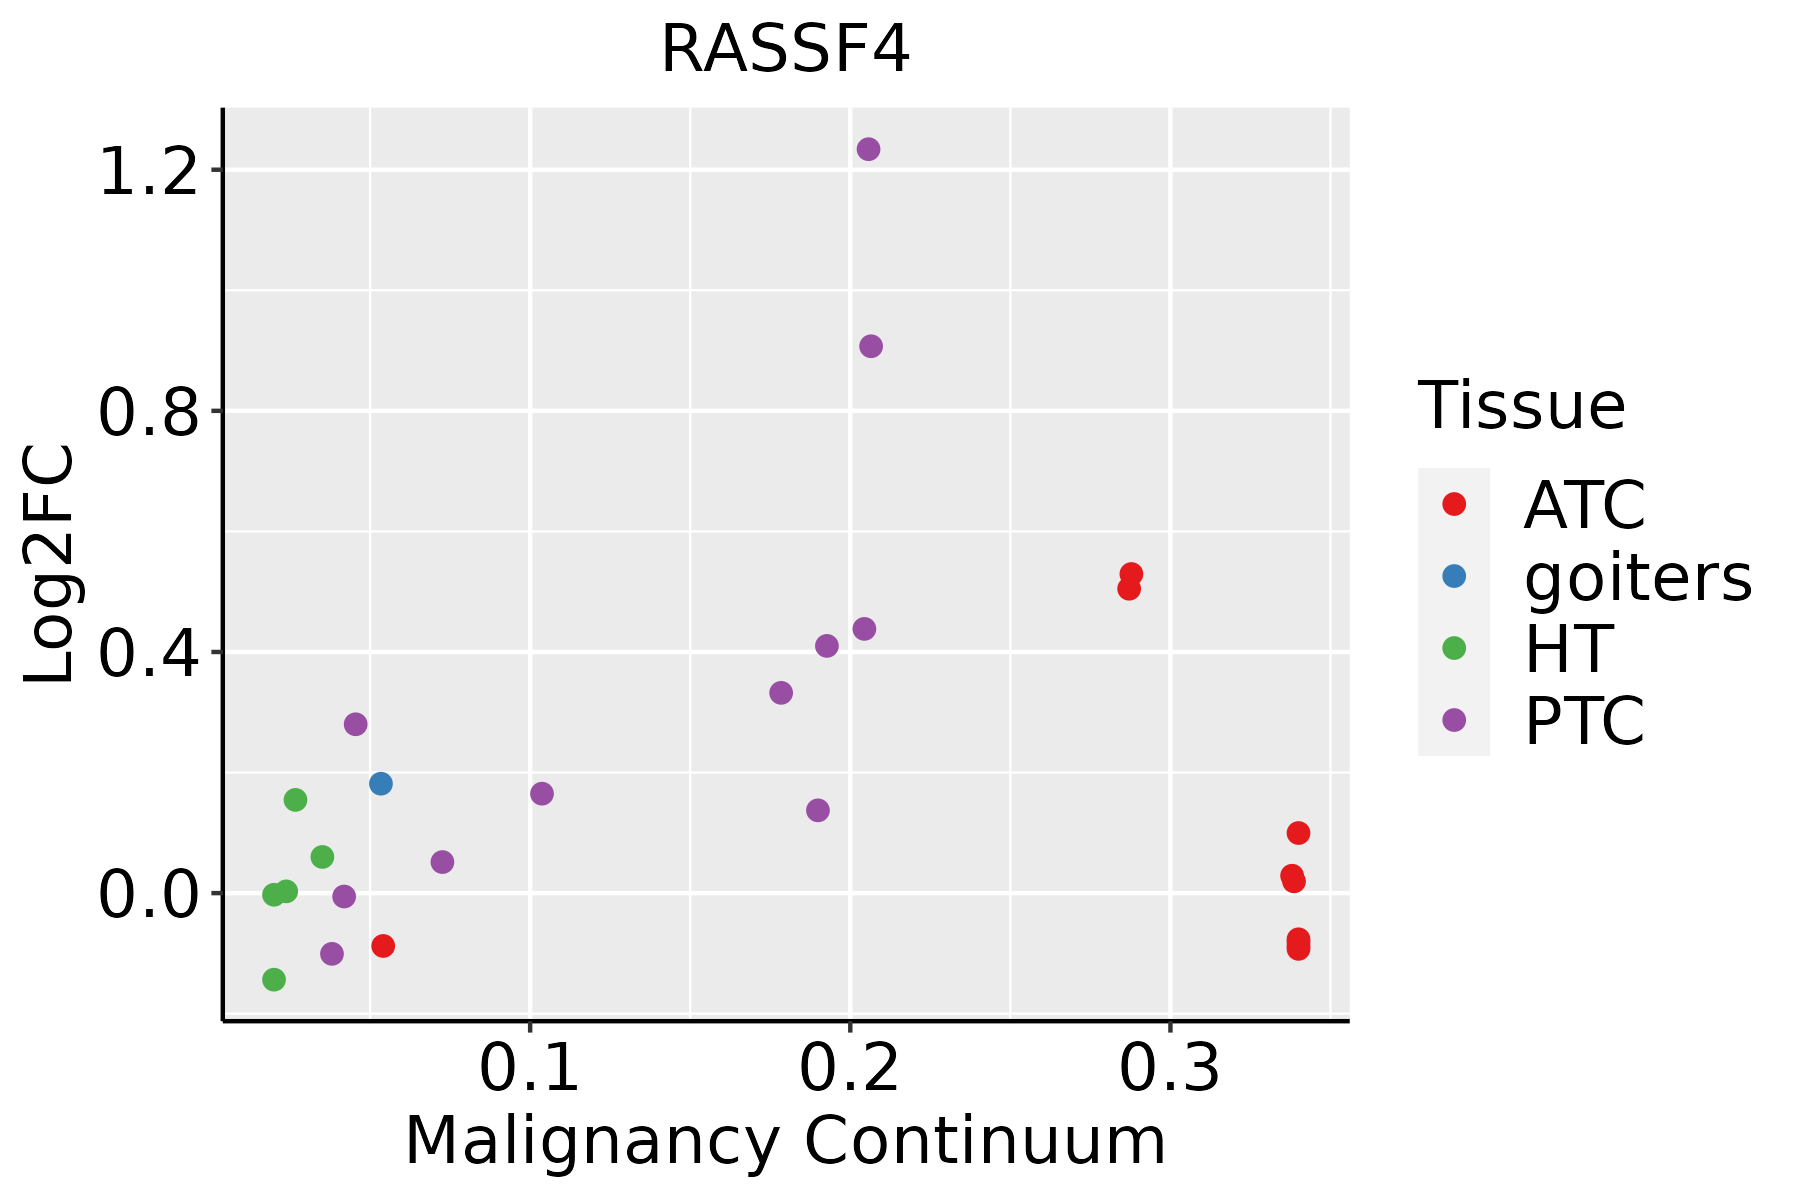 | ATC: Anaplastic thyroid cancer |
| HT: Hashimoto's thyroiditis | ||
| PTC: Papillary thyroid cancer |
| ∗log2FC in expression of this searched gene in stem-like cells from each diseased tissue sample relative to stem-like cells in normal samples in each tissue plotted against the malignancy continuum. Samples are colored based on if they are from different disease stage. |
Top |
Malignant transformation related pathway analysis |
| Find out the enriched GO biological processes and KEGG pathways involved in transition from healthy to precancer to cancer |
| Tissue | Disease Stage | Enriched GO biological Processes |
| Colorectum | AD |  |
| Colorectum | SER |  |
| Colorectum | MSS |  |
| Colorectum | MSI-H |  |
| Colorectum | FAP |  |
| ∗Top 15 enriched GO BP terms are showed in the bar plot of each disease state in each tissue. Each row represents a significant GO biological process which is colored according to the -log10(p.adjust). |
| Page: 1 2 3 4 5 6 7 8 9 |
| GO ID | Tissue | Disease Stage | Description | Gene Ratio | Bg Ratio | pvalue | p.adjust | Count |
| Page: 1 |
| Pathway ID | Tissue | Disease Stage | Description | Gene Ratio | Bg Ratio | pvalue | p.adjust | qvalue | Count |
| Page: 1 |
Top |
Cell-cell communication analysis |
| Identification of potential cell-cell interactions between two cell types and their ligand-receptor pairs for different disease states |
| Ligand | Receptor | LRpair | Pathway | Tissue | Disease Stage |
| Page: 1 |
Top |
Single-cell gene regulatory network inference analysis |
| Find out the significant the regulons (TFs) and the target genes of each regulon across cell types for different disease states |
| TF | Cell Type | Tissue | Disease Stage | Target Gene | RSS | Regulon Activity |
| ∗The dot plots of a searched regulon are shown for all cell subpopulations in each disease state of each tissue based on the regulon specific score inferred using pySCENIC and by calculating the average expression. |
| Page: 1 |
Top |
Somatic mutation of malignant transformation related genes |
| Annotation of somatic variants for genes involved in malignant transformation |
| Hugo Symbol | Variant Class | Variant Classification | dbSNP RS | HGVSc | HGVSp | HGVSp Short | SWISSPROT | BIOTYPE | SIFT | PolyPhen | Tumor Sample Barcode | Tissue | Histology | Sex | Age | Stage | Therapy Types | Drugs | Outcome |
| RASSF4 | SNV | Missense_Mutation | novel | c.245C>T | p.Ser82Phe | p.S82F | Q9H2L5 | protein_coding | tolerated(0.18) | benign(0.087) | TCGA-5L-AAT1-01 | Breast | breast invasive carcinoma | Female | <65 | III/IV | Hormone Therapy | letrozol | SD |
| RASSF4 | SNV | Missense_Mutation | c.814N>G | p.Gln272Glu | p.Q272E | Q9H2L5 | protein_coding | deleterious(0) | possibly_damaging(0.64) | TCGA-A2-A0EQ-01 | Breast | breast invasive carcinoma | Female | <65 | I/II | Chemotherapy | adriamycin | SD | |
| RASSF4 | SNV | Missense_Mutation | c.898A>T | p.Thr300Ser | p.T300S | Q9H2L5 | protein_coding | tolerated(0.15) | probably_damaging(0.994) | TCGA-AR-A256-01 | Breast | breast invasive carcinoma | Female | <65 | I/II | Chemotherapy | doxorubicin | PD | |
| RASSF4 | insertion | Frame_Shift_Ins | novel | c.130_131insTTCACATGGCGAAAGCAGGAGCAAGAGAGAGGGAGTGG | p.His44LeufsTer21 | p.H44Lfs*21 | Q9H2L5 | protein_coding | TCGA-A8-A09C-01 | Breast | breast invasive carcinoma | Female | >=65 | I/II | Unknown | Unknown | SD | ||
| RASSF4 | insertion | Frame_Shift_Ins | novel | c.78_79insAGAGG | p.Leu27ArgfsTer4 | p.L27Rfs*4 | Q9H2L5 | protein_coding | TCGA-B6-A0IE-01 | Breast | breast invasive carcinoma | Female | <65 | III/IV | Unknown | Unknown | PD | ||
| RASSF4 | insertion | Frame_Shift_Ins | novel | c.80_81insCCAGATGGCAGGCACTTTATACGAAATAGGTGTGTACA | p.Leu28GlnfsTer14 | p.L28Qfs*14 | Q9H2L5 | protein_coding | TCGA-B6-A0IE-01 | Breast | breast invasive carcinoma | Female | <65 | III/IV | Unknown | Unknown | PD | ||
| RASSF4 | SNV | Missense_Mutation | rs548850403 | c.487C>T | p.Arg163Trp | p.R163W | Q9H2L5 | protein_coding | deleterious(0) | probably_damaging(0.988) | TCGA-2W-A8YY-01 | Cervix | cervical & endocervical cancer | Female | <65 | I/II | Chemotherapy | cisplatin | CR |
| RASSF4 | SNV | Missense_Mutation | c.652G>C | p.Glu218Gln | p.E218Q | Q9H2L5 | protein_coding | deleterious(0) | probably_damaging(1) | TCGA-EK-A3GK-01 | Cervix | cervical & endocervical cancer | Female | <65 | I/II | Unknown | Unknown | SD | |
| RASSF4 | SNV | Missense_Mutation | rs137923619 | c.481N>T | p.Arg161Cys | p.R161C | Q9H2L5 | protein_coding | deleterious(0) | possibly_damaging(0.77) | TCGA-A6-6780-01 | Colorectum | colon adenocarcinoma | Male | >=65 | I/II | Unknown | Unknown | SD |
| RASSF4 | SNV | Missense_Mutation | rs756742625 | c.65N>T | p.Ser22Leu | p.S22L | Q9H2L5 | protein_coding | deleterious(0.01) | benign(0.319) | TCGA-AA-3710-01 | Colorectum | colon adenocarcinoma | Female | >=65 | I/II | Unknown | Unknown | SD |
| Page: 1 2 3 4 5 |
Top |
Related drugs of malignant transformation related genes |
| Identification of chemicals and drugs interact with genes involved in malignant transfromation |
| (DGIdb 4.0) |
| Entrez ID | Symbol | Category | Interaction Types | Drug Claim Name | Drug Name | PMIDs |
| Page: 1 |

Copyright 2023-Present -The University of Texas Health Science Center at Houston |