
|
|||||
|
 | |
| |
| |
| |
| |
| |
|
Gene: RASSF1 |
Gene summary for RASSF1 |
| Gene information | Species | Human | Gene symbol | RASSF1 | Gene ID | 11186 |
| Gene name | Ras association domain family member 1 | |
| Gene Alias | 123F2 | |
| Cytomap | 3p21.31 | |
| Gene Type | protein-coding | GO ID | GO:0000226 | UniProtAcc | Q9NS23 |
Top |
Malignant transformation analysis |
| Identification of the aberrant gene expression in precancerous and cancerous lesions by comparing the gene expression of stem-like cells in diseased tissues with normal stem cells |
| Entrez ID | Symbol | Replicates | Species | Organ | Tissue | Adj P-value | Log2FC | Malignancy |
| 11186 | RASSF1 | LZE4T | Human | Esophagus | ESCC | 5.77e-06 | 2.08e-01 | 0.0811 |
| 11186 | RASSF1 | LZE20T | Human | Esophagus | ESCC | 3.75e-02 | 4.47e-02 | 0.0662 |
| 11186 | RASSF1 | LZE22T | Human | Esophagus | ESCC | 3.42e-06 | 2.45e-01 | 0.068 |
| 11186 | RASSF1 | LZE24T | Human | Esophagus | ESCC | 7.33e-11 | 2.29e-01 | 0.0596 |
| 11186 | RASSF1 | LZE21T | Human | Esophagus | ESCC | 2.12e-05 | 1.91e-01 | 0.0655 |
| 11186 | RASSF1 | LZE6T | Human | Esophagus | ESCC | 7.82e-04 | 1.09e-01 | 0.0845 |
| 11186 | RASSF1 | P1T-E | Human | Esophagus | ESCC | 4.10e-12 | 3.68e-01 | 0.0875 |
| 11186 | RASSF1 | P2T-E | Human | Esophagus | ESCC | 1.12e-16 | 2.83e-01 | 0.1177 |
| 11186 | RASSF1 | P4T-E | Human | Esophagus | ESCC | 2.59e-16 | 4.18e-01 | 0.1323 |
| 11186 | RASSF1 | P5T-E | Human | Esophagus | ESCC | 1.42e-06 | 1.62e-01 | 0.1327 |
| 11186 | RASSF1 | P8T-E | Human | Esophagus | ESCC | 6.41e-07 | 8.55e-02 | 0.0889 |
| 11186 | RASSF1 | P9T-E | Human | Esophagus | ESCC | 1.14e-13 | 3.10e-01 | 0.1131 |
| 11186 | RASSF1 | P10T-E | Human | Esophagus | ESCC | 1.77e-22 | 4.19e-01 | 0.116 |
| 11186 | RASSF1 | P11T-E | Human | Esophagus | ESCC | 3.55e-08 | 4.39e-01 | 0.1426 |
| 11186 | RASSF1 | P12T-E | Human | Esophagus | ESCC | 5.95e-24 | 4.38e-01 | 0.1122 |
| 11186 | RASSF1 | P16T-E | Human | Esophagus | ESCC | 4.14e-21 | 2.88e-01 | 0.1153 |
| 11186 | RASSF1 | P19T-E | Human | Esophagus | ESCC | 1.03e-11 | 8.97e-01 | 0.1662 |
| 11186 | RASSF1 | P20T-E | Human | Esophagus | ESCC | 6.88e-14 | 2.78e-01 | 0.1124 |
| 11186 | RASSF1 | P21T-E | Human | Esophagus | ESCC | 1.82e-22 | 3.74e-01 | 0.1617 |
| 11186 | RASSF1 | P22T-E | Human | Esophagus | ESCC | 1.16e-08 | 1.14e-01 | 0.1236 |
| Page: 1 2 3 4 |
| Tissue | Expression Dynamics | Abbreviation |
| Esophagus |  | ESCC: Esophageal squamous cell carcinoma |
| HGIN: High-grade intraepithelial neoplasias | ||
| LGIN: Low-grade intraepithelial neoplasias | ||
| Liver | 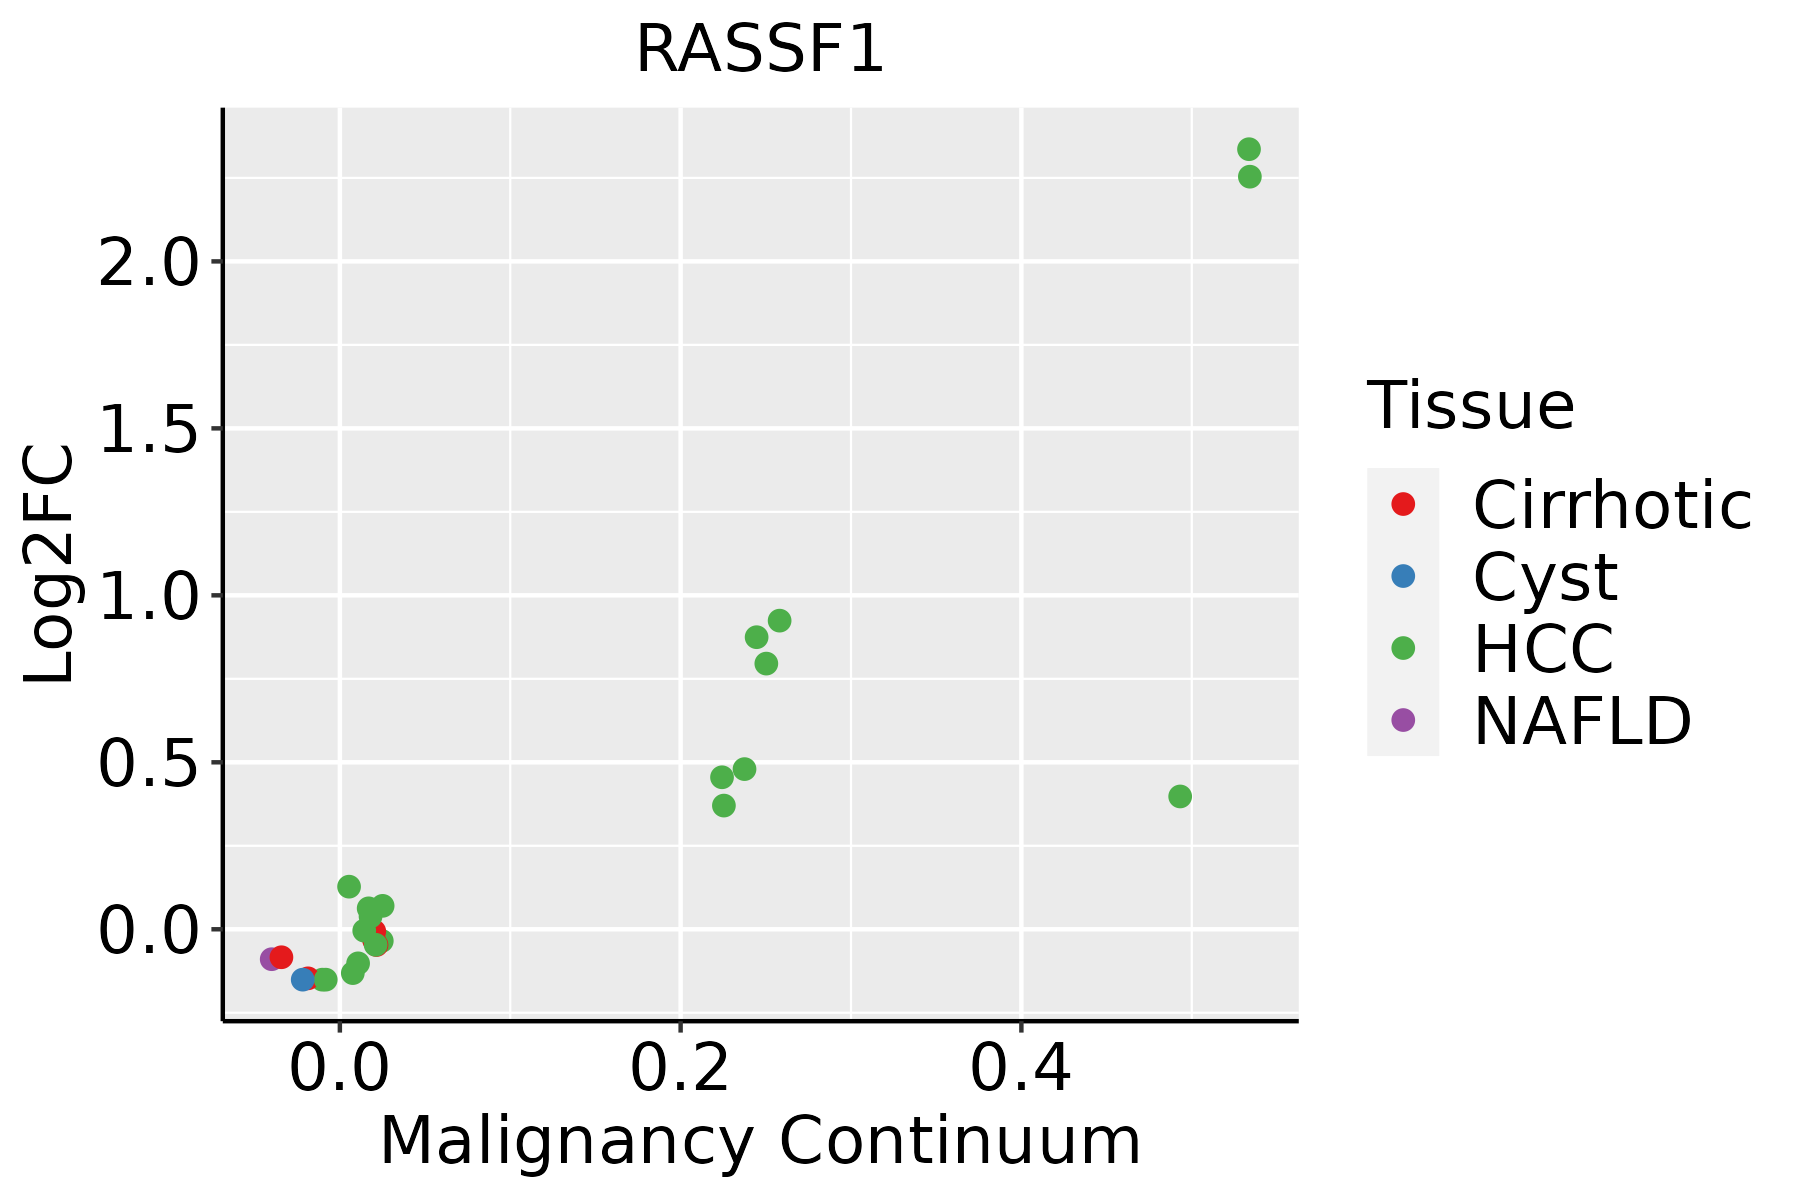 | HCC: Hepatocellular carcinoma |
| NAFLD: Non-alcoholic fatty liver disease | ||
| Skin |  | AK: Actinic keratosis |
| cSCC: Cutaneous squamous cell carcinoma | ||
| SCCIS:squamous cell carcinoma in situ |
| ∗log2FC in expression of this searched gene in stem-like cells from each diseased tissue sample relative to stem-like cells in normal samples in each tissue plotted against the malignancy continuum. Samples are colored based on if they are from different disease stage. |
Top |
Malignant transformation related pathway analysis |
| Find out the enriched GO biological processes and KEGG pathways involved in transition from healthy to precancer to cancer |
| Tissue | Disease Stage | Enriched GO biological Processes |
| Colorectum | AD |  |
| Colorectum | SER |  |
| Colorectum | MSS |  |
| Colorectum | MSI-H |  |
| Colorectum | FAP |  |
| ∗Top 15 enriched GO BP terms are showed in the bar plot of each disease state in each tissue. Each row represents a significant GO biological process which is colored according to the -log10(p.adjust). |
| Page: 1 2 3 4 5 6 7 8 9 |
| GO ID | Tissue | Disease Stage | Description | Gene Ratio | Bg Ratio | pvalue | p.adjust | Count |
| GO:00705078 | Esophagus | ESCC | regulation of microtubule cytoskeleton organization | 99/8552 | 148/18723 | 1.43e-07 | 2.29e-06 | 99 |
| GO:000726510 | Esophagus | ESCC | Ras protein signal transduction | 201/8552 | 337/18723 | 1.44e-07 | 2.30e-06 | 201 |
| GO:00328864 | Esophagus | ESCC | regulation of microtubule-based process | 134/8552 | 240/18723 | 9.44e-04 | 4.80e-03 | 134 |
| GO:000726521 | Liver | HCC | Ras protein signal transduction | 187/7958 | 337/18723 | 8.89e-07 | 1.35e-05 | 187 |
| GO:007050711 | Liver | HCC | regulation of microtubule cytoskeleton organization | 88/7958 | 148/18723 | 2.28e-05 | 2.41e-04 | 88 |
| GO:0032886 | Liver | HCC | regulation of microtubule-based process | 123/7958 | 240/18723 | 3.69e-03 | 1.64e-02 | 123 |
| GO:00107209 | Oral cavity | OSCC | positive regulation of cell development | 159/7305 | 298/18723 | 3.06e-07 | 4.66e-06 | 159 |
| GO:00507696 | Oral cavity | OSCC | positive regulation of neurogenesis | 120/7305 | 225/18723 | 8.45e-06 | 9.02e-05 | 120 |
| GO:00507679 | Oral cavity | OSCC | regulation of neurogenesis | 179/7305 | 364/18723 | 4.49e-05 | 3.84e-04 | 179 |
| GO:00519624 | Oral cavity | OSCC | positive regulation of nervous system development | 135/7305 | 272/18723 | 2.20e-04 | 1.44e-03 | 135 |
| GO:00519605 | Oral cavity | OSCC | regulation of nervous system development | 205/7305 | 443/18723 | 9.80e-04 | 5.11e-03 | 205 |
| GO:001072014 | Oral cavity | LP | positive regulation of cell development | 93/4623 | 298/18723 | 6.07e-03 | 3.60e-02 | 93 |
| GO:000726523 | Skin | cSCC | Ras protein signal transduction | 132/4864 | 337/18723 | 6.17e-08 | 1.57e-06 | 132 |
| GO:007050716 | Skin | cSCC | regulation of microtubule cytoskeleton organization | 61/4864 | 148/18723 | 3.61e-05 | 3.90e-04 | 61 |
| GO:003288612 | Skin | cSCC | regulation of microtubule-based process | 82/4864 | 240/18723 | 2.82e-03 | 1.58e-02 | 82 |
| Page: 1 |
| Pathway ID | Tissue | Disease Stage | Description | Gene Ratio | Bg Ratio | pvalue | p.adjust | qvalue | Count |
| hsa0521910 | Esophagus | ESCC | Bladder cancer | 35/4205 | 41/8465 | 1.91e-06 | 1.15e-05 | 5.87e-06 | 35 |
| hsa052237 | Esophagus | ESCC | Non-small cell lung cancer | 48/4205 | 72/8465 | 2.57e-03 | 7.05e-03 | 3.61e-03 | 48 |
| hsa0439018 | Esophagus | ESCC | Hippo signaling pathway | 92/4205 | 157/8465 | 1.46e-02 | 3.31e-02 | 1.69e-02 | 92 |
| hsa0521917 | Esophagus | ESCC | Bladder cancer | 35/4205 | 41/8465 | 1.91e-06 | 1.15e-05 | 5.87e-06 | 35 |
| hsa0522316 | Esophagus | ESCC | Non-small cell lung cancer | 48/4205 | 72/8465 | 2.57e-03 | 7.05e-03 | 3.61e-03 | 48 |
| hsa0439019 | Esophagus | ESCC | Hippo signaling pathway | 92/4205 | 157/8465 | 1.46e-02 | 3.31e-02 | 1.69e-02 | 92 |
| hsa052192 | Liver | HCC | Bladder cancer | 30/4020 | 41/8465 | 7.37e-04 | 2.94e-03 | 1.63e-03 | 30 |
| hsa052232 | Liver | HCC | Non-small cell lung cancer | 46/4020 | 72/8465 | 3.61e-03 | 1.12e-02 | 6.22e-03 | 46 |
| hsa052193 | Liver | HCC | Bladder cancer | 30/4020 | 41/8465 | 7.37e-04 | 2.94e-03 | 1.63e-03 | 30 |
| hsa0522311 | Liver | HCC | Non-small cell lung cancer | 46/4020 | 72/8465 | 3.61e-03 | 1.12e-02 | 6.22e-03 | 46 |
| Page: 1 |
Top |
Cell-cell communication analysis |
| Identification of potential cell-cell interactions between two cell types and their ligand-receptor pairs for different disease states |
| Ligand | Receptor | LRpair | Pathway | Tissue | Disease Stage |
| Page: 1 |
Top |
Single-cell gene regulatory network inference analysis |
| Find out the significant the regulons (TFs) and the target genes of each regulon across cell types for different disease states |
| TF | Cell Type | Tissue | Disease Stage | Target Gene | RSS | Regulon Activity |
| ∗The dot plots of a searched regulon are shown for all cell subpopulations in each disease state of each tissue based on the regulon specific score inferred using pySCENIC and by calculating the average expression. |
| Page: 1 |
Top |
Somatic mutation of malignant transformation related genes |
| Annotation of somatic variants for genes involved in malignant transformation |
| Hugo Symbol | Variant Class | Variant Classification | dbSNP RS | HGVSc | HGVSp | HGVSp Short | SWISSPROT | BIOTYPE | SIFT | PolyPhen | Tumor Sample Barcode | Tissue | Histology | Sex | Age | Stage | Therapy Types | Drugs | Outcome |
| RASSF1 | SNV | Missense_Mutation | c.513G>C | p.Gln171His | p.Q171H | Q9NS23 | protein_coding | tolerated(1) | benign(0.247) | TCGA-E2-A15G-01 | Breast | breast invasive carcinoma | Female | >=65 | I/II | Hormone Therapy | arimidex | SD | |
| RASSF1 | SNV | Missense_Mutation | rs781352974 | c.274A>C | p.Thr92Pro | p.T92P | Q9NS23 | protein_coding | deleterious(0.01) | possibly_damaging(0.685) | TCGA-E2-A1IE-01 | Breast | breast invasive carcinoma | Female | <65 | I/II | Chemotherapy | doxorubicin | PD |
| RASSF1 | SNV | Missense_Mutation | c.708N>C | p.Lys236Asn | p.K236N | Q9NS23 | protein_coding | deleterious(0) | probably_damaging(0.997) | TCGA-C5-A1MH-01 | Cervix | cervical & endocervical cancer | Female | >=65 | III/IV | Chemotherapy | cisplatin | PD | |
| RASSF1 | SNV | Missense_Mutation | rs781352974 | c.274N>C | p.Thr92Pro | p.T92P | Q9NS23 | protein_coding | deleterious(0.01) | possibly_damaging(0.685) | TCGA-C5-A7UC-01 | Cervix | cervical & endocervical cancer | Female | <65 | I/II | Unknown | Unknown | SD |
| RASSF1 | SNV | Missense_Mutation | rs376674291 | c.667C>T | p.Arg223Cys | p.R223C | Q9NS23 | protein_coding | deleterious(0.02) | probably_damaging(0.964) | TCGA-A6-6653-01 | Colorectum | colon adenocarcinoma | Male | >=65 | I/II | Unknown | Unknown | SD |
| RASSF1 | SNV | Missense_Mutation | rs781352974 | c.274A>C | p.Thr92Pro | p.T92P | Q9NS23 | protein_coding | deleterious(0.01) | possibly_damaging(0.685) | TCGA-AA-3488-01 | Colorectum | colon adenocarcinoma | Male | <65 | III/IV | Unknown | Unknown | PD |
| RASSF1 | SNV | Missense_Mutation | novel | c.655N>G | p.His219Asp | p.H219D | Q9NS23 | protein_coding | deleterious(0) | probably_damaging(1) | TCGA-AY-4070-01 | Colorectum | colon adenocarcinoma | Female | <65 | III/IV | Chemotherapy | 5-fu | PD |
| RASSF1 | SNV | Missense_Mutation | rs750917798 | c.613C>T | p.Arg205Cys | p.R205C | Q9NS23 | protein_coding | deleterious(0.03) | benign(0.03) | TCGA-AZ-4313-01 | Colorectum | colon adenocarcinoma | Female | <65 | I/II | Unknown | Unknown | SD |
| RASSF1 | SNV | Missense_Mutation | c.278N>A | p.Cys93Tyr | p.C93Y | Q9NS23 | protein_coding | deleterious(0) | possibly_damaging(0.762) | TCGA-G4-6588-01 | Colorectum | colon adenocarcinoma | Female | <65 | I/II | Unknown | Unknown | SD | |
| RASSF1 | deletion | Frame_Shift_Del | novel | c.892_895delNNNN | p.Asp298ProfsTer77 | p.D298Pfs*77 | Q9NS23 | protein_coding | TCGA-A6-3807-01 | Colorectum | colon adenocarcinoma | Female | <65 | III/IV | Ancillary | leucovorin | SD |
| Page: 1 2 3 4 |
Top |
Related drugs of malignant transformation related genes |
| Identification of chemicals and drugs interact with genes involved in malignant transfromation |
| (DGIdb 4.0) |
| Entrez ID | Symbol | Category | Interaction Types | Drug Claim Name | Drug Name | PMIDs |
| Page: 1 |

Copyright 2023-Present -The University of Texas Health Science Center at Houston |